
|
|||||
|
 | |
| |
| |
| |
| |
| |
|
Gene: ZNF587 |
Gene summary for ZNF587 |
| Gene information | Species | Human | Gene symbol | ZNF587 | Gene ID | 84914 |
| Gene name | zinc finger protein 587 | |
| Gene Alias | ZF6 | |
| Cytomap | 19q13.43 | |
| Gene Type | protein-coding | GO ID | GO:0006139 | UniProtAcc | Q96SQ5 |
Top |
Malignant transformation analysis |
| Identification of the aberrant gene expression in precancerous and cancerous lesions by comparing the gene expression of stem-like cells in diseased tissues with normal stem cells |
| Entrez ID | Symbol | Replicates | Species | Organ | Tissue | Adj P-value | Log2FC | Malignancy |
| 84914 | ZNF587 | HCC1_Meng | Human | Liver | HCC | 3.02e-23 | 6.84e-03 | 0.0246 |
| 84914 | ZNF587 | HCC2_Meng | Human | Liver | HCC | 1.82e-12 | 9.27e-02 | 0.0107 |
| 84914 | ZNF587 | HCC1 | Human | Liver | HCC | 5.77e-04 | 2.77e+00 | 0.5336 |
| 84914 | ZNF587 | HCC2 | Human | Liver | HCC | 2.54e-04 | 1.54e+00 | 0.5341 |
| 84914 | ZNF587 | HCC5 | Human | Liver | HCC | 2.16e-06 | 2.05e+00 | 0.4932 |
| 84914 | ZNF587 | S028 | Human | Liver | HCC | 3.21e-03 | 2.45e-01 | 0.2503 |
| 84914 | ZNF587 | male-WTA | Human | Thyroid | PTC | 8.59e-06 | 7.59e-02 | 0.1037 |
| 84914 | ZNF587 | PTC01 | Human | Thyroid | PTC | 1.44e-03 | 7.92e-02 | 0.1899 |
| 84914 | ZNF587 | PTC03 | Human | Thyroid | PTC | 1.79e-02 | 1.28e-01 | 0.1784 |
| 84914 | ZNF587 | PTC04 | Human | Thyroid | PTC | 5.69e-16 | 2.24e-01 | 0.1927 |
| 84914 | ZNF587 | PTC05 | Human | Thyroid | PTC | 1.99e-09 | 2.99e-01 | 0.2065 |
| 84914 | ZNF587 | PTC06 | Human | Thyroid | PTC | 2.51e-21 | 4.17e-01 | 0.2057 |
| 84914 | ZNF587 | PTC07 | Human | Thyroid | PTC | 4.27e-10 | 2.19e-01 | 0.2044 |
| 84914 | ZNF587 | ATC11 | Human | Thyroid | ATC | 7.49e-03 | 2.26e-01 | 0.3386 |
| 84914 | ZNF587 | ATC12 | Human | Thyroid | ATC | 1.11e-07 | 1.84e-01 | 0.34 |
| 84914 | ZNF587 | ATC13 | Human | Thyroid | ATC | 2.99e-14 | 3.44e-01 | 0.34 |
| 84914 | ZNF587 | ATC1 | Human | Thyroid | ATC | 4.70e-02 | 1.10e-01 | 0.2878 |
| 84914 | ZNF587 | ATC2 | Human | Thyroid | ATC | 2.02e-16 | 1.04e+00 | 0.34 |
| 84914 | ZNF587 | ATC3 | Human | Thyroid | ATC | 6.22e-03 | 1.84e-01 | 0.338 |
| 84914 | ZNF587 | ATC4 | Human | Thyroid | ATC | 8.48e-13 | 2.56e-01 | 0.34 |
| Page: 1 2 |
| Tissue | Expression Dynamics | Abbreviation |
| Liver |  | HCC: Hepatocellular carcinoma |
| NAFLD: Non-alcoholic fatty liver disease | ||
| Thyroid | 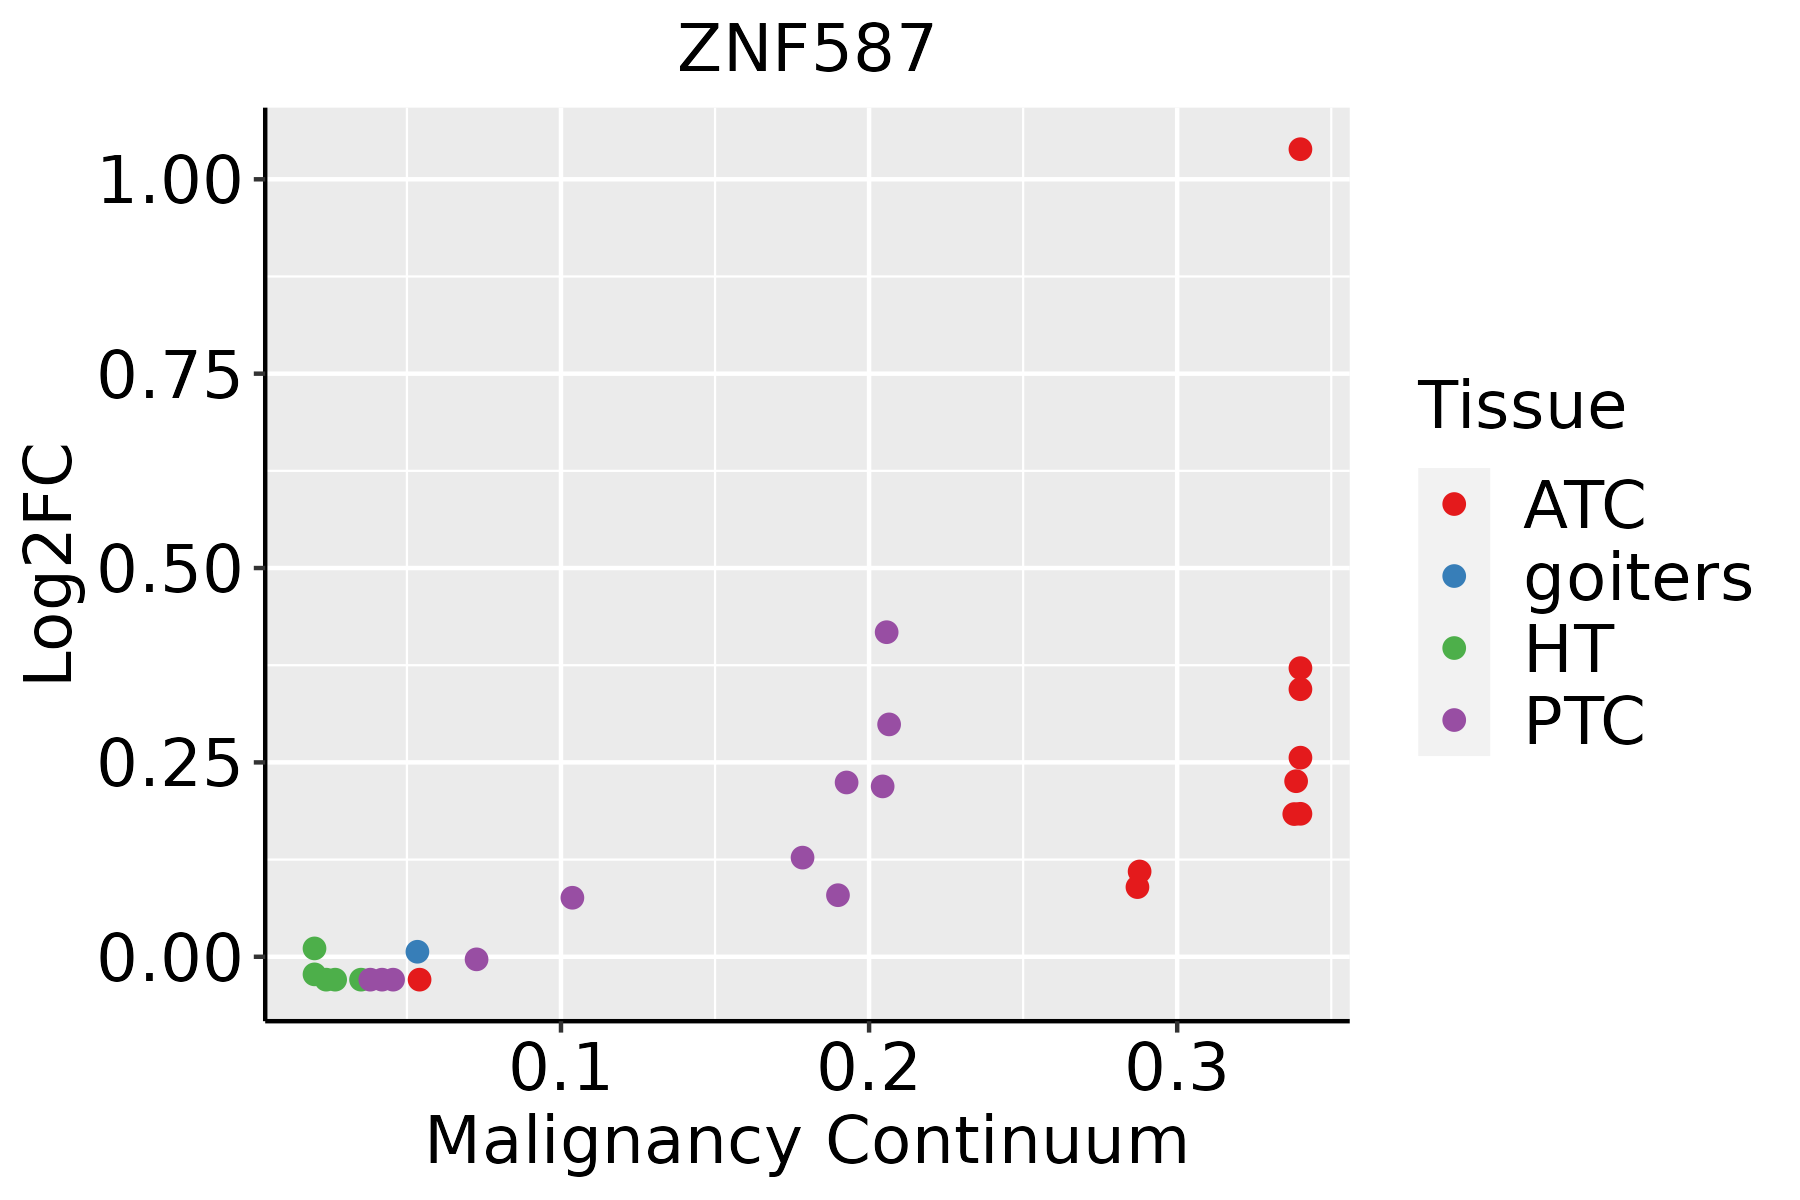 | ATC: Anaplastic thyroid cancer |
| HT: Hashimoto's thyroiditis | ||
| PTC: Papillary thyroid cancer |
| ∗log2FC in expression of this searched gene in stem-like cells from each diseased tissue sample relative to stem-like cells in normal samples in each tissue plotted against the malignancy continuum. Samples are colored based on if they are from different disease stage. |
Top |
Malignant transformation related pathway analysis |
| Find out the enriched GO biological processes and KEGG pathways involved in transition from healthy to precancer to cancer |
| Tissue | Disease Stage | Enriched GO biological Processes |
| Colorectum | AD |  |
| Colorectum | SER |  |
| Colorectum | MSS |  |
| Colorectum | MSI-H |  |
| Colorectum | FAP |  |
| ∗Top 15 enriched GO BP terms are showed in the bar plot of each disease state in each tissue. Each row represents a significant GO biological process which is colored according to the -log10(p.adjust). |
| Page: 1 2 3 4 5 6 7 8 9 |
| GO ID | Tissue | Disease Stage | Description | Gene Ratio | Bg Ratio | pvalue | p.adjust | Count |
| Page: 1 |
| Pathway ID | Tissue | Disease Stage | Description | Gene Ratio | Bg Ratio | pvalue | p.adjust | qvalue | Count |
| Page: 1 |
Top |
Cell-cell communication analysis |
| Identification of potential cell-cell interactions between two cell types and their ligand-receptor pairs for different disease states |
| Ligand | Receptor | LRpair | Pathway | Tissue | Disease Stage |
| Page: 1 |
Top |
Single-cell gene regulatory network inference analysis |
| Find out the significant the regulons (TFs) and the target genes of each regulon across cell types for different disease states |
| TF | Cell Type | Tissue | Disease Stage | Target Gene | RSS | Regulon Activity |
| ZNF587 | MYOFIB | Colorectum | AD | MLPH,MUC4,SYTL2, etc. | 1.16e-01 |  |
| ZNF587 | PERI | Colorectum | ADJ | MLPH,MUC4,SYTL2, etc. | 5.68e-02 |  |
| ZNF587 | CFIB | Colorectum | CRC | MLPH,MUC4,SYTL2, etc. | 5.31e-02 |  |
| ZNF587 | PCV | Colorectum | CRC | MLPH,MUC4,SYTL2, etc. | 0.00e+00 | |
| ZNF587 | PERI | Colorectum | Healthy | MLPH,MUC4,SYTL2, etc. | 4.88e-02 |  |
| ZNF587 | PERI | Colorectum | MSI-H | MLPH,MUC4,SYTL2, etc. | 4.37e-01 |  |
| ∗The dot plots of a searched regulon are shown for all cell subpopulations in each disease state of each tissue based on the regulon specific score inferred using pySCENIC and by calculating the average expression. |
| Page: 1 |
Top |
Somatic mutation of malignant transformation related genes |
| Annotation of somatic variants for genes involved in malignant transformation |
| Hugo Symbol | Variant Class | Variant Classification | dbSNP RS | HGVSc | HGVSp | HGVSp Short | SWISSPROT | BIOTYPE | SIFT | PolyPhen | Tumor Sample Barcode | Tissue | Histology | Sex | Age | Stage | Therapy Types | Drugs | Outcome |
| ZNF587 | SNV | Missense_Mutation | rs369121362 | c.481N>T | p.Arg161Cys | p.R161C | Q96SQ5 | protein_coding | tolerated(1) | benign(0) | TCGA-A2-A3Y0-01 | Breast | breast invasive carcinoma | Female | <65 | I/II | Chemotherapy | adriamycin | CR |
| ZNF587 | SNV | Missense_Mutation | rs549141100 | c.1199N>A | p.Arg400Gln | p.R400Q | Q96SQ5 | protein_coding | deleterious(0.02) | possibly_damaging(0.729) | TCGA-AN-A0FZ-01 | Breast | breast invasive carcinoma | Female | <65 | III/IV | Unknown | Unknown | SD |
| ZNF587 | SNV | Missense_Mutation | rs755988325 | c.1084N>T | p.Arg362Cys | p.R362C | Q96SQ5 | protein_coding | tolerated(0.07) | benign(0.285) | TCGA-AO-A0JE-01 | Breast | breast invasive carcinoma | Female | <65 | III/IV | Chemotherapy | doxorubicin | SD |
| ZNF587 | SNV | Missense_Mutation | rs552665720 | c.1598C>G | p.Ser533Cys | p.S533C | Q96SQ5 | protein_coding | deleterious(0.03) | possibly_damaging(0.907) | TCGA-B6-A0IK-01 | Breast | breast invasive carcinoma | Female | <65 | III/IV | Unknown | Unknown | PD |
| ZNF587 | SNV | Missense_Mutation | rs754280571 | c.577N>C | p.Glu193Gln | p.E193Q | Q96SQ5 | protein_coding | deleterious(0.02) | benign(0.015) | TCGA-C8-A12T-01 | Breast | breast invasive carcinoma | Female | <65 | I/II | Unknown | Unknown | SD |
| ZNF587 | SNV | Missense_Mutation | c.1295G>C | p.Gly432Ala | p.G432A | Q96SQ5 | protein_coding | tolerated(0.05) | possibly_damaging(0.906) | TCGA-C8-A27B-01 | Breast | breast invasive carcinoma | Female | <65 | I/II | Chemotherapy | 5-fluorouracil | CR | |
| ZNF587 | SNV | Missense_Mutation | rs779562247 | c.1085N>A | p.Arg362His | p.R362H | Q96SQ5 | protein_coding | tolerated(0.19) | benign(0) | TCGA-D8-A146-01 | Breast | breast invasive carcinoma | Female | <65 | I/II | Unknown | Unknown | SD |
| ZNF587 | SNV | Missense_Mutation | c.1511G>T | p.Ser504Ile | p.S504I | Q96SQ5 | protein_coding | tolerated(0.07) | benign(0.227) | TCGA-D8-A1JK-01 | Breast | breast invasive carcinoma | Female | >=65 | I/II | Unknown | Unknown | SD | |
| ZNF587 | insertion | Frame_Shift_Ins | novel | c.449_450insTATTT | p.Lys150AsnfsTer3 | p.K150Nfs*3 | Q96SQ5 | protein_coding | TCGA-AO-A0JD-01 | Breast | breast invasive carcinoma | Female | <65 | III/IV | Chemotherapy | cyclophosphamide | SD | ||
| ZNF587 | insertion | In_Frame_Ins | novel | c.449_450insTATTTGCAG | p.Lys150delinsAsnIleCysArg | p.K150delinsNICR | Q96SQ5 | protein_coding | TCGA-AR-A0U0-01 | Breast | breast invasive carcinoma | Female | >=65 | I/II | Unknown | Unknown | SD |
| Page: 1 2 3 4 5 6 7 8 |
Top |
Related drugs of malignant transformation related genes |
| Identification of chemicals and drugs interact with genes involved in malignant transfromation |
| (DGIdb 4.0) |
| Entrez ID | Symbol | Category | Interaction Types | Drug Claim Name | Drug Name | PMIDs |
| Page: 1 |

Copyright 2023-Present -The University of Texas Health Science Center at Houston |