
|
|||||
|
 | |
| |
| |
| |
| |
| |
|
Gene: ZNF585A |
Gene summary for ZNF585A |
| Gene information | Species | Human | Gene symbol | ZNF585A | Gene ID | 199704 |
| Gene name | zinc finger protein 585A | |
| Gene Alias | Zfp27 | |
| Cytomap | 19q13.12 | |
| Gene Type | protein-coding | GO ID | GO:0006139 | UniProtAcc | Q6P3V2 |
Top |
Malignant transformation analysis |
| Identification of the aberrant gene expression in precancerous and cancerous lesions by comparing the gene expression of stem-like cells in diseased tissues with normal stem cells |
| Entrez ID | Symbol | Replicates | Species | Organ | Tissue | Adj P-value | Log2FC | Malignancy |
| 199704 | ZNF585A | LZE4T | Human | Esophagus | ESCC | 6.35e-03 | 1.09e-01 | 0.0811 |
| 199704 | ZNF585A | LZE5T | Human | Esophagus | ESCC | 1.54e-04 | 2.40e-01 | 0.0514 |
| 199704 | ZNF585A | LZE7T | Human | Esophagus | ESCC | 2.56e-05 | 2.02e-01 | 0.0667 |
| 199704 | ZNF585A | LZE20T | Human | Esophagus | ESCC | 1.74e-07 | 2.18e-01 | 0.0662 |
| 199704 | ZNF585A | LZE22T | Human | Esophagus | ESCC | 1.57e-02 | 1.81e-01 | 0.068 |
| 199704 | ZNF585A | LZE24T | Human | Esophagus | ESCC | 1.80e-03 | 1.02e-01 | 0.0596 |
| 199704 | ZNF585A | P1T-E | Human | Esophagus | ESCC | 3.58e-07 | 3.19e-01 | 0.0875 |
| 199704 | ZNF585A | P2T-E | Human | Esophagus | ESCC | 1.04e-11 | 2.50e-01 | 0.1177 |
| 199704 | ZNF585A | P8T-E | Human | Esophagus | ESCC | 8.59e-27 | 4.94e-01 | 0.0889 |
| 199704 | ZNF585A | P9T-E | Human | Esophagus | ESCC | 1.11e-03 | 1.30e-01 | 0.1131 |
| 199704 | ZNF585A | P10T-E | Human | Esophagus | ESCC | 3.86e-28 | 4.74e-01 | 0.116 |
| 199704 | ZNF585A | P11T-E | Human | Esophagus | ESCC | 3.66e-11 | 3.64e-01 | 0.1426 |
| 199704 | ZNF585A | P12T-E | Human | Esophagus | ESCC | 7.30e-05 | 1.40e-01 | 0.1122 |
| 199704 | ZNF585A | P15T-E | Human | Esophagus | ESCC | 8.38e-13 | 2.67e-01 | 0.1149 |
| 199704 | ZNF585A | P16T-E | Human | Esophagus | ESCC | 5.75e-08 | 2.05e-01 | 0.1153 |
| 199704 | ZNF585A | P19T-E | Human | Esophagus | ESCC | 2.24e-09 | 8.01e-01 | 0.1662 |
| 199704 | ZNF585A | P21T-E | Human | Esophagus | ESCC | 1.54e-17 | 2.83e-01 | 0.1617 |
| 199704 | ZNF585A | P22T-E | Human | Esophagus | ESCC | 7.14e-20 | 3.74e-01 | 0.1236 |
| 199704 | ZNF585A | P24T-E | Human | Esophagus | ESCC | 2.56e-10 | 2.43e-01 | 0.1287 |
| 199704 | ZNF585A | P27T-E | Human | Esophagus | ESCC | 7.78e-05 | 9.73e-02 | 0.1055 |
| Page: 1 2 3 4 |
| Tissue | Expression Dynamics | Abbreviation |
| Esophagus | 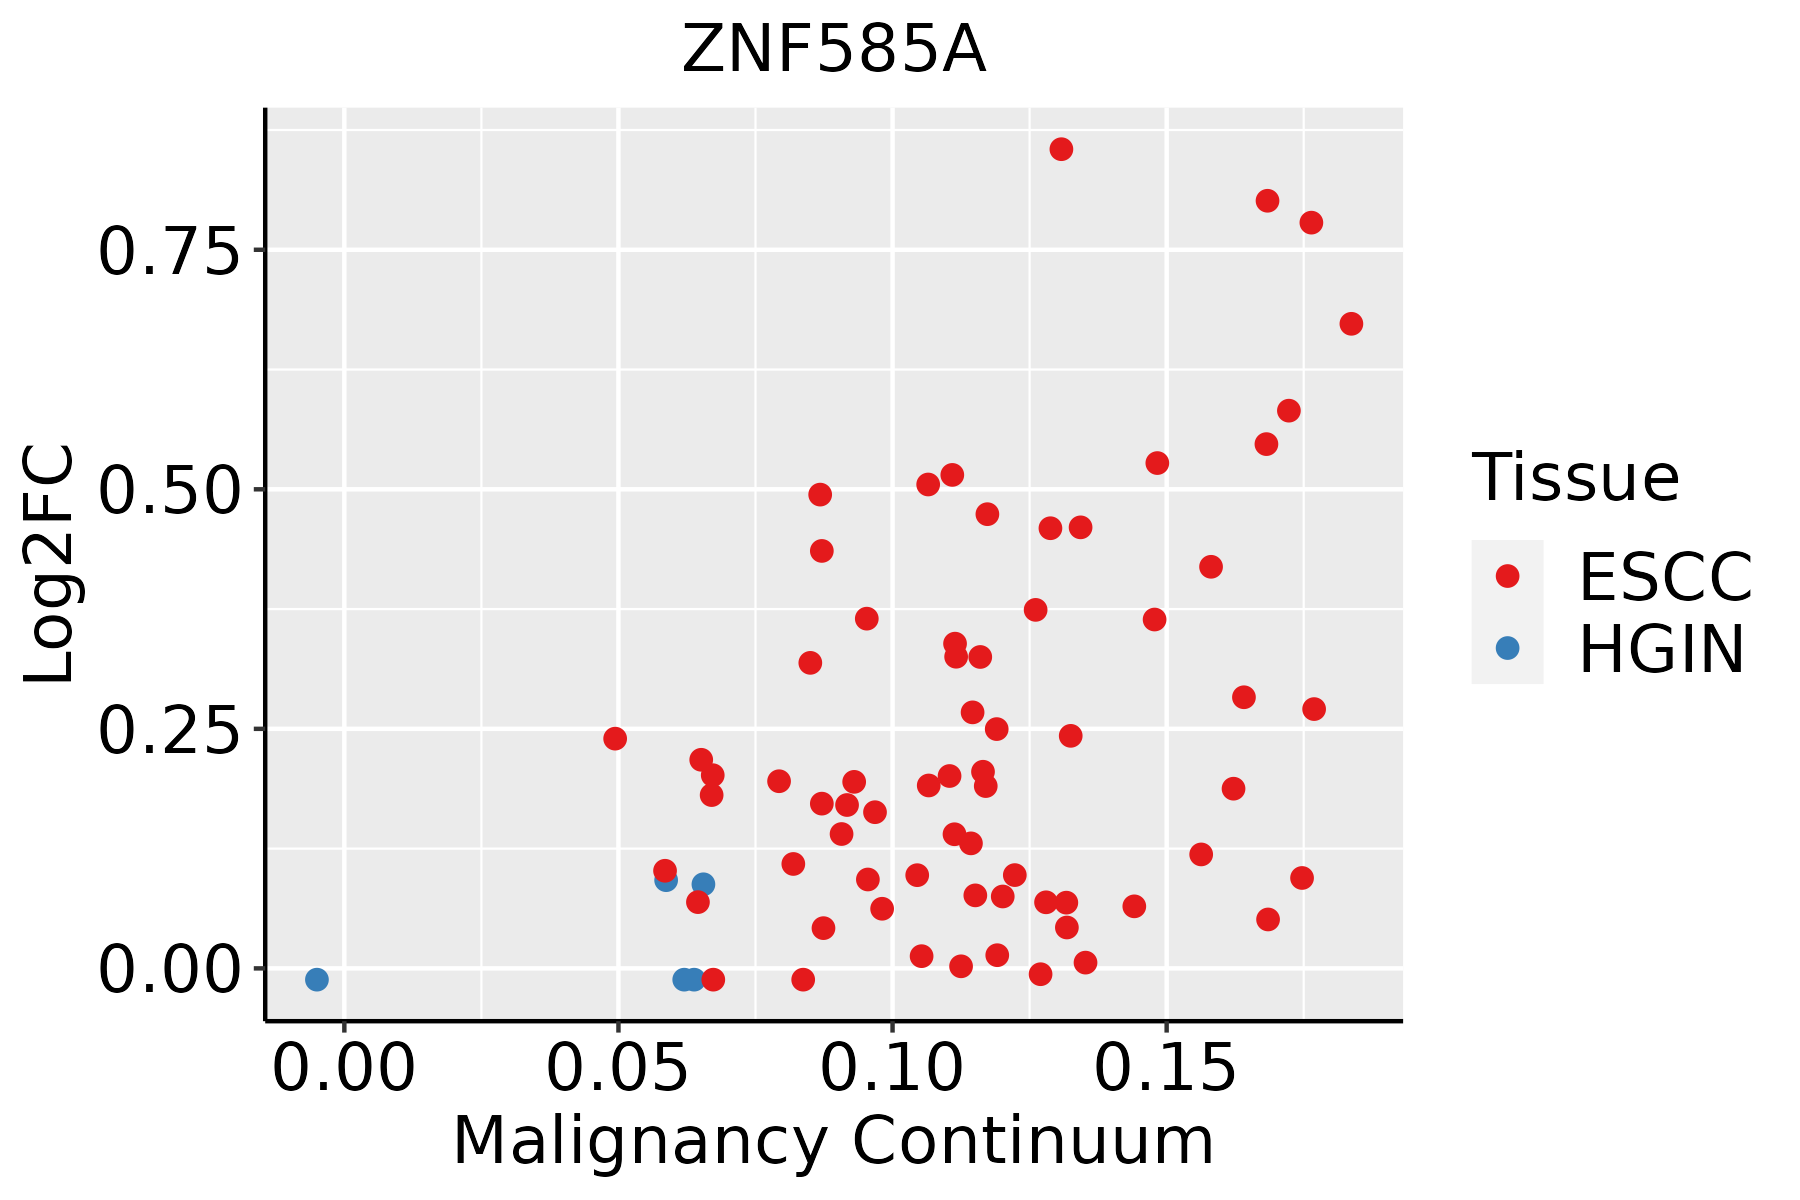 | ESCC: Esophageal squamous cell carcinoma |
| HGIN: High-grade intraepithelial neoplasias | ||
| LGIN: Low-grade intraepithelial neoplasias | ||
| Liver | 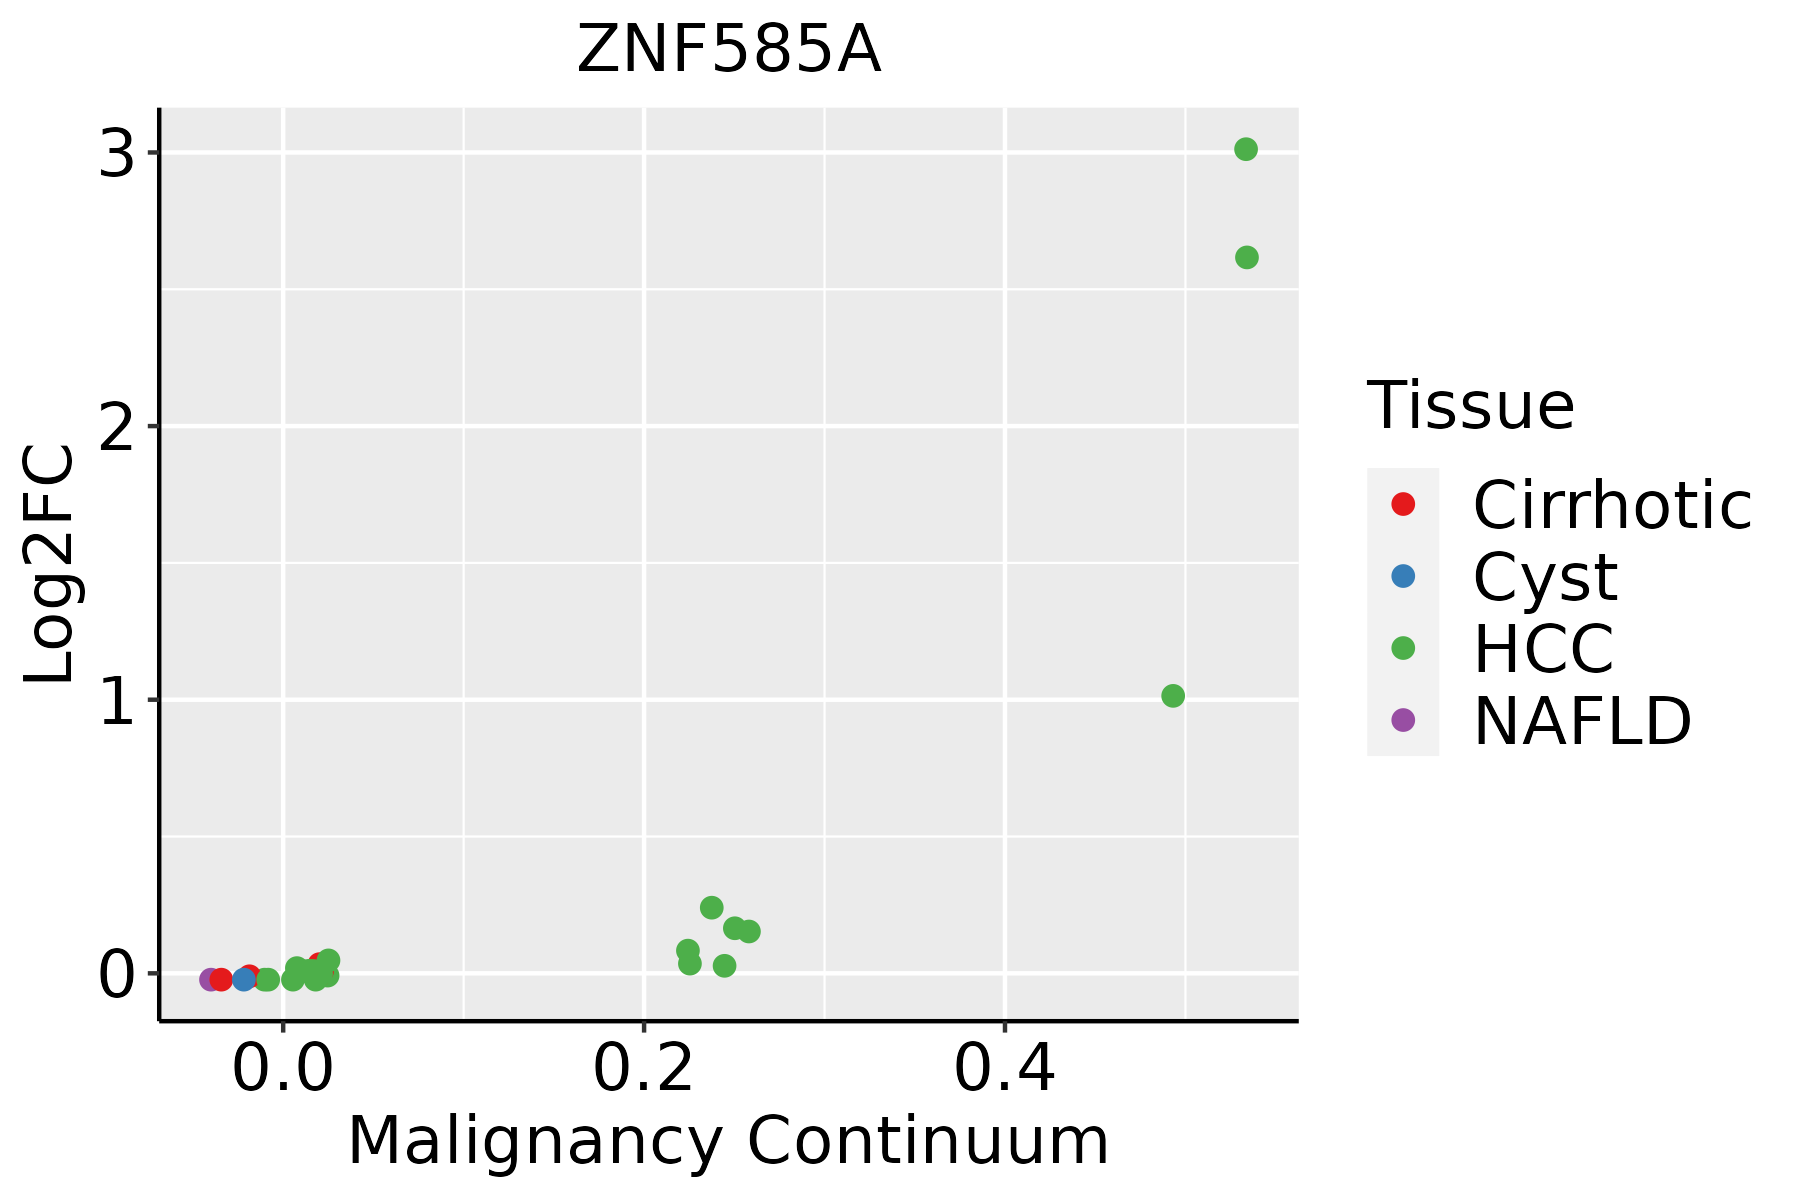 | HCC: Hepatocellular carcinoma |
| NAFLD: Non-alcoholic fatty liver disease | ||
| Thyroid | 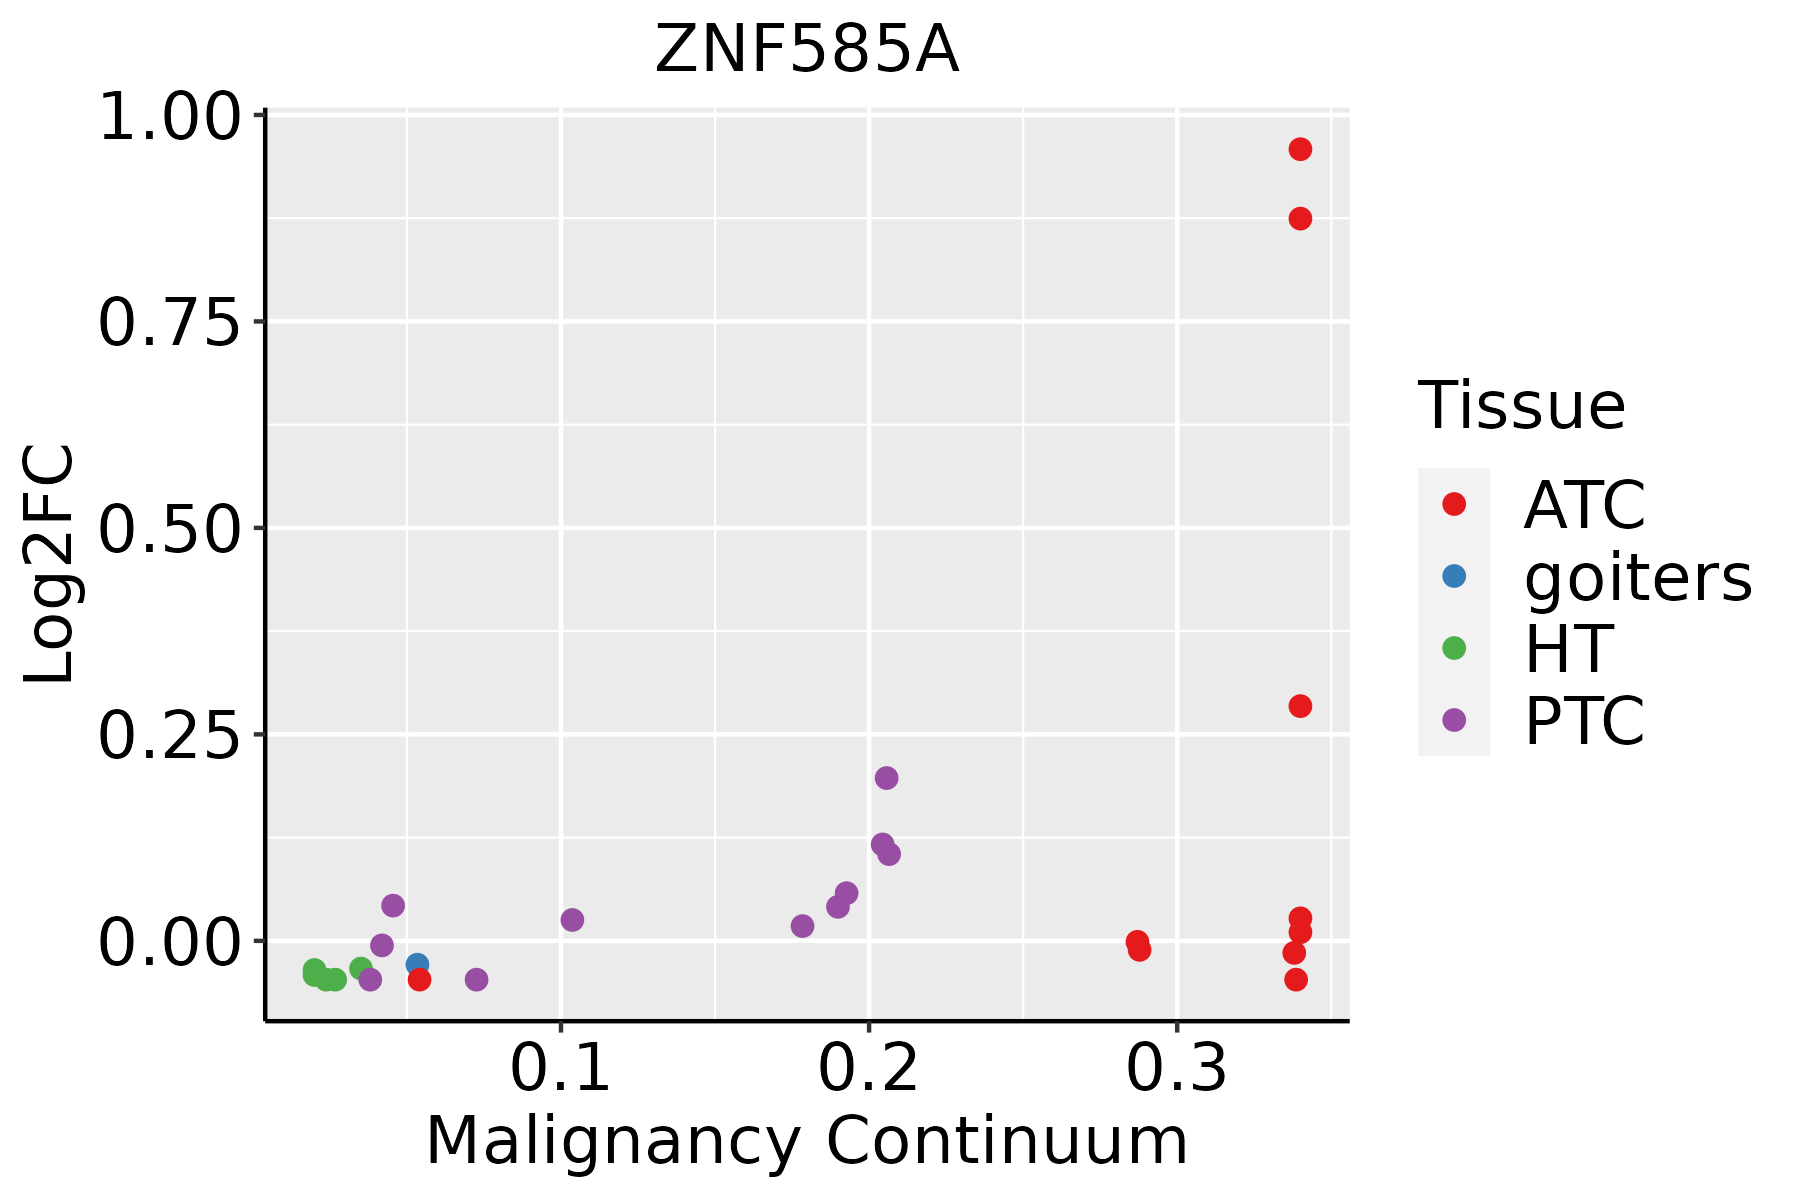 | ATC: Anaplastic thyroid cancer |
| HT: Hashimoto's thyroiditis | ||
| PTC: Papillary thyroid cancer |
| ∗log2FC in expression of this searched gene in stem-like cells from each diseased tissue sample relative to stem-like cells in normal samples in each tissue plotted against the malignancy continuum. Samples are colored based on if they are from different disease stage. |
Top |
Malignant transformation related pathway analysis |
| Find out the enriched GO biological processes and KEGG pathways involved in transition from healthy to precancer to cancer |
| Tissue | Disease Stage | Enriched GO biological Processes |
| Colorectum | AD |  |
| Colorectum | SER |  |
| Colorectum | MSS |  |
| Colorectum | MSI-H |  |
| Colorectum | FAP |  |
| ∗Top 15 enriched GO BP terms are showed in the bar plot of each disease state in each tissue. Each row represents a significant GO biological process which is colored according to the -log10(p.adjust). |
| Page: 1 2 3 4 5 6 7 8 9 |
| GO ID | Tissue | Disease Stage | Description | Gene Ratio | Bg Ratio | pvalue | p.adjust | Count |
| Page: 1 |
| Pathway ID | Tissue | Disease Stage | Description | Gene Ratio | Bg Ratio | pvalue | p.adjust | qvalue | Count |
| Page: 1 |
Top |
Cell-cell communication analysis |
| Identification of potential cell-cell interactions between two cell types and their ligand-receptor pairs for different disease states |
| Ligand | Receptor | LRpair | Pathway | Tissue | Disease Stage |
| Page: 1 |
Top |
Single-cell gene regulatory network inference analysis |
| Find out the significant the regulons (TFs) and the target genes of each regulon across cell types for different disease states |
| TF | Cell Type | Tissue | Disease Stage | Target Gene | RSS | Regulon Activity |
| ∗The dot plots of a searched regulon are shown for all cell subpopulations in each disease state of each tissue based on the regulon specific score inferred using pySCENIC and by calculating the average expression. |
| Page: 1 |
Top |
Somatic mutation of malignant transformation related genes |
| Annotation of somatic variants for genes involved in malignant transformation |
| Hugo Symbol | Variant Class | Variant Classification | dbSNP RS | HGVSc | HGVSp | HGVSp Short | SWISSPROT | BIOTYPE | SIFT | PolyPhen | Tumor Sample Barcode | Tissue | Histology | Sex | Age | Stage | Therapy Types | Drugs | Outcome |
| ZNF585A | SNV | Missense_Mutation | c.1729C>T | p.Pro577Ser | p.P577S | Q6P3V2 | protein_coding | deleterious(0.03) | probably_damaging(0.999) | TCGA-A2-A0YG-01 | Breast | breast invasive carcinoma | Female | <65 | III/IV | Chemotherapy | cytoxan | SD | |
| ZNF585A | SNV | Missense_Mutation | rs572122130 | c.1660N>A | p.Glu554Lys | p.E554K | Q6P3V2 | protein_coding | deleterious(0.04) | possibly_damaging(0.793) | TCGA-AN-A046-01 | Breast | breast invasive carcinoma | Female | >=65 | I/II | Unknown | Unknown | SD |
| ZNF585A | SNV | Missense_Mutation | novel | c.1705N>A | p.Gln569Lys | p.Q569K | Q6P3V2 | protein_coding | deleterious(0.03) | benign(0.025) | TCGA-BH-A0B6-01 | Breast | breast invasive carcinoma | Female | <65 | I/II | Unknown | Unknown | SD |
| ZNF585A | SNV | Missense_Mutation | c.1345N>G | p.Ser449Ala | p.S449A | Q6P3V2 | protein_coding | tolerated(0.28) | possibly_damaging(0.867) | TCGA-C8-A1HE-01 | Breast | breast invasive carcinoma | Female | <65 | I/II | Unknown | Unknown | SD | |
| ZNF585A | SNV | Missense_Mutation | novel | c.1078N>A | p.Gly360Arg | p.G360R | Q6P3V2 | protein_coding | deleterious(0.03) | probably_damaging(1) | TCGA-2W-A8YY-01 | Cervix | cervical & endocervical cancer | Female | <65 | I/II | Chemotherapy | cisplatin | CR |
| ZNF585A | SNV | Missense_Mutation | novel | c.958C>G | p.His320Asp | p.H320D | Q6P3V2 | protein_coding | deleterious(0.01) | probably_damaging(0.974) | TCGA-C5-A2LZ-01 | Cervix | cervical & endocervical cancer | Female | >=65 | III/IV | Unknown | Unknown | PD |
| ZNF585A | SNV | Missense_Mutation | novel | c.1239N>A | p.Met413Ile | p.M413I | Q6P3V2 | protein_coding | tolerated(0.1) | benign(0.034) | TCGA-ZJ-AAXU-01 | Cervix | cervical & endocervical cancer | Female | <65 | I/II | Unknown | Unknown | SD |
| ZNF585A | SNV | Missense_Mutation | c.970N>G | p.Lys324Glu | p.K324E | Q6P3V2 | protein_coding | deleterious(0.01) | benign(0.134) | TCGA-A6-2686-01 | Colorectum | colon adenocarcinoma | Female | >=65 | I/II | Unknown | Unknown | SD | |
| ZNF585A | SNV | Missense_Mutation | c.1573A>G | p.Asn525Asp | p.N525D | Q6P3V2 | protein_coding | tolerated(0.13) | benign(0.099) | TCGA-A6-A565-01 | Colorectum | colon adenocarcinoma | Female | <65 | III/IV | Unspecific | 5FU | PD | |
| ZNF585A | SNV | Missense_Mutation | c.1891N>C | p.Glu631Gln | p.E631Q | Q6P3V2 | protein_coding | deleterious(0.01) | benign(0.079) | TCGA-AA-3715-01 | Colorectum | colon adenocarcinoma | Male | >=65 | I/II | Unknown | Unknown | PD |
| Page: 1 2 3 4 5 6 7 8 9 10 11 12 13 |
Top |
Related drugs of malignant transformation related genes |
| Identification of chemicals and drugs interact with genes involved in malignant transfromation |
| (DGIdb 4.0) |
| Entrez ID | Symbol | Category | Interaction Types | Drug Claim Name | Drug Name | PMIDs |
| Page: 1 |

Copyright 2023-Present -The University of Texas Health Science Center at Houston |