
|
|||||
|
 | |
| |
| |
| |
| |
| |
|
Gene: ZNF584 |
Gene summary for ZNF584 |
| Gene information | Species | Human | Gene symbol | ZNF584 | Gene ID | 201514 |
| Gene name | zinc finger protein 584 | |
| Gene Alias | ZNF584 | |
| Cytomap | 19q13.43 | |
| Gene Type | protein-coding | GO ID | GO:0006139 | UniProtAcc | B4DQS1 |
Top |
Malignant transformation analysis |
| Identification of the aberrant gene expression in precancerous and cancerous lesions by comparing the gene expression of stem-like cells in diseased tissues with normal stem cells |
| Entrez ID | Symbol | Replicates | Species | Organ | Tissue | Adj P-value | Log2FC | Malignancy |
| 201514 | ZNF584 | LZE7T | Human | Esophagus | ESCC | 3.02e-05 | 1.87e-01 | 0.0667 |
| 201514 | ZNF584 | LZE24T | Human | Esophagus | ESCC | 1.55e-06 | 1.72e-01 | 0.0596 |
| 201514 | ZNF584 | P2T-E | Human | Esophagus | ESCC | 3.79e-09 | 1.13e-01 | 0.1177 |
| 201514 | ZNF584 | P4T-E | Human | Esophagus | ESCC | 9.95e-07 | 8.89e-02 | 0.1323 |
| 201514 | ZNF584 | P8T-E | Human | Esophagus | ESCC | 6.31e-08 | 1.80e-01 | 0.0889 |
| 201514 | ZNF584 | P9T-E | Human | Esophagus | ESCC | 3.38e-02 | 4.63e-02 | 0.1131 |
| 201514 | ZNF584 | P10T-E | Human | Esophagus | ESCC | 3.16e-15 | 3.13e-01 | 0.116 |
| 201514 | ZNF584 | P11T-E | Human | Esophagus | ESCC | 1.40e-10 | 2.39e-01 | 0.1426 |
| 201514 | ZNF584 | P12T-E | Human | Esophagus | ESCC | 1.89e-08 | 1.38e-01 | 0.1122 |
| 201514 | ZNF584 | P15T-E | Human | Esophagus | ESCC | 5.02e-04 | 7.85e-02 | 0.1149 |
| 201514 | ZNF584 | P16T-E | Human | Esophagus | ESCC | 4.68e-13 | 7.54e-02 | 0.1153 |
| 201514 | ZNF584 | P20T-E | Human | Esophagus | ESCC | 1.08e-03 | 8.13e-02 | 0.1124 |
| 201514 | ZNF584 | P21T-E | Human | Esophagus | ESCC | 1.11e-05 | 1.27e-01 | 0.1617 |
| 201514 | ZNF584 | P22T-E | Human | Esophagus | ESCC | 4.04e-10 | 1.35e-01 | 0.1236 |
| 201514 | ZNF584 | P23T-E | Human | Esophagus | ESCC | 5.72e-10 | 2.64e-01 | 0.108 |
| 201514 | ZNF584 | P24T-E | Human | Esophagus | ESCC | 1.03e-07 | 6.22e-02 | 0.1287 |
| 201514 | ZNF584 | P26T-E | Human | Esophagus | ESCC | 1.44e-16 | 1.89e-01 | 0.1276 |
| 201514 | ZNF584 | P27T-E | Human | Esophagus | ESCC | 2.41e-13 | 1.82e-01 | 0.1055 |
| 201514 | ZNF584 | P28T-E | Human | Esophagus | ESCC | 8.72e-06 | 1.56e-01 | 0.1149 |
| 201514 | ZNF584 | P30T-E | Human | Esophagus | ESCC | 2.06e-11 | 2.29e-01 | 0.137 |
| Page: 1 2 3 |
| Tissue | Expression Dynamics | Abbreviation |
| Esophagus | 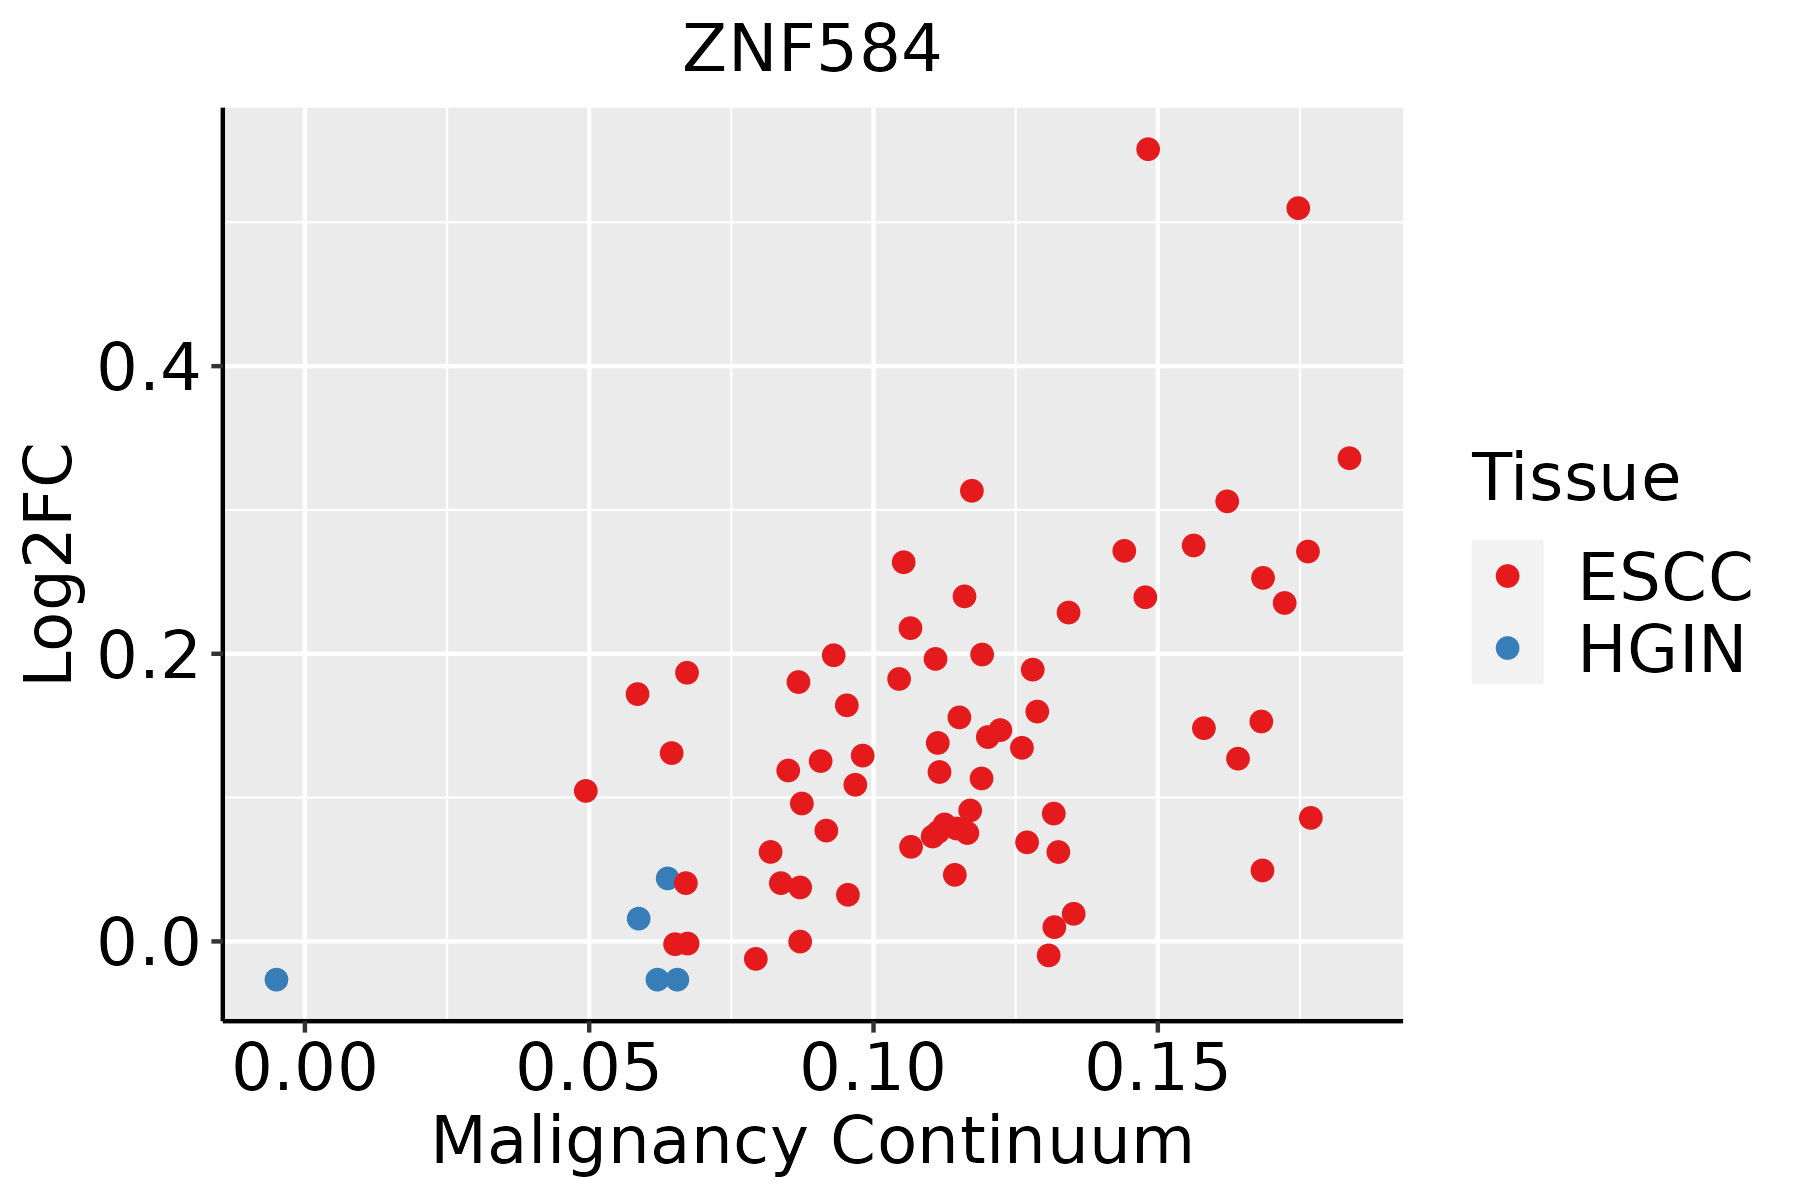 | ESCC: Esophageal squamous cell carcinoma |
| HGIN: High-grade intraepithelial neoplasias | ||
| LGIN: Low-grade intraepithelial neoplasias |
| ∗log2FC in expression of this searched gene in stem-like cells from each diseased tissue sample relative to stem-like cells in normal samples in each tissue plotted against the malignancy continuum. Samples are colored based on if they are from different disease stage. |
Top |
Malignant transformation related pathway analysis |
| Find out the enriched GO biological processes and KEGG pathways involved in transition from healthy to precancer to cancer |
| Tissue | Disease Stage | Enriched GO biological Processes |
| Colorectum | AD |  |
| Colorectum | SER |  |
| Colorectum | MSS |  |
| Colorectum | MSI-H |  |
| Colorectum | FAP |  |
| ∗Top 15 enriched GO BP terms are showed in the bar plot of each disease state in each tissue. Each row represents a significant GO biological process which is colored according to the -log10(p.adjust). |
| Page: 1 2 3 4 5 6 7 8 9 |
| GO ID | Tissue | Disease Stage | Description | Gene Ratio | Bg Ratio | pvalue | p.adjust | Count |
| Page: 1 |
| Pathway ID | Tissue | Disease Stage | Description | Gene Ratio | Bg Ratio | pvalue | p.adjust | qvalue | Count |
| Page: 1 |
Top |
Cell-cell communication analysis |
| Identification of potential cell-cell interactions between two cell types and their ligand-receptor pairs for different disease states |
| Ligand | Receptor | LRpair | Pathway | Tissue | Disease Stage |
| Page: 1 |
Top |
Single-cell gene regulatory network inference analysis |
| Find out the significant the regulons (TFs) and the target genes of each regulon across cell types for different disease states |
| TF | Cell Type | Tissue | Disease Stage | Target Gene | RSS | Regulon Activity |
| ∗The dot plots of a searched regulon are shown for all cell subpopulations in each disease state of each tissue based on the regulon specific score inferred using pySCENIC and by calculating the average expression. |
| Page: 1 |
Top |
Somatic mutation of malignant transformation related genes |
| Annotation of somatic variants for genes involved in malignant transformation |
| Hugo Symbol | Variant Class | Variant Classification | dbSNP RS | HGVSc | HGVSp | HGVSp Short | SWISSPROT | BIOTYPE | SIFT | PolyPhen | Tumor Sample Barcode | Tissue | Histology | Sex | Age | Stage | Therapy Types | Drugs | Outcome |
| ZNF584 | insertion | Nonsense_Mutation | novel | c.1231_1232insGTTCACACAGGCATAAAACCTTTTAAGTGT | p.Glu411delinsGlySerHisArgHisLysThrPheTerValTer | p.E411delinsGSHRHKTF*V* | Q8IVC4 | protein_coding | TCGA-A2-A0CP-01 | Breast | breast invasive carcinoma | Female | <65 | I/II | Chemotherapy | cytoxan | SD | ||
| ZNF584 | insertion | Frame_Shift_Ins | novel | c.587_588insGCCATTCTCCTGCCTAAGCCTCCCGAGTAGCTGGGACTACAGGTGC | p.Phe196LeufsTer23 | p.F196Lfs*23 | Q8IVC4 | protein_coding | TCGA-A8-A06O-01 | Breast | breast invasive carcinoma | Female | <65 | I/II | Hormone Therapy | letrozole | SD | ||
| ZNF584 | insertion | In_Frame_Ins | novel | c.222_223insCACCGTGTTAGCCAGGATAGTCTTGATCTCCTGACC | p.Gln74_Ser75insHisArgValSerGlnAspSerLeuAspLeuLeuThr | p.Q74_S75insHRVSQDSLDLLT | Q8IVC4 | protein_coding | TCGA-AR-A0TY-01 | Breast | breast invasive carcinoma | Female | <65 | I/II | Unspecific | Paclitaxel | PD | ||
| ZNF584 | insertion | Nonsense_Mutation | novel | c.855_856insTTGCGAACGTCTGGGTTTAAGTGATCTCCT | p.Leu285_Ile286insLeuArgThrSerGlyPheLysTerSerPro | p.L285_I286insLRTSGFK*SP | Q8IVC4 | protein_coding | TCGA-B6-A0RG-01 | Breast | breast invasive carcinoma | Female | <65 | I/II | Unknown | Unknown | SD | ||
| ZNF584 | SNV | Missense_Mutation | novel | c.7G>T | p.Gly3Trp | p.G3W | Q8IVC4 | protein_coding | deleterious_low_confidence(0.01) | possibly_damaging(0.825) | TCGA-MA-AA3W-01 | Cervix | cervical & endocervical cancer | Female | <65 | I/II | Chemotherapy | cisplatin | CR |
| ZNF584 | SNV | Missense_Mutation | novel | c.278G>A | p.Arg93Lys | p.R93K | Q8IVC4 | protein_coding | tolerated(0.97) | benign(0) | TCGA-VS-A8EJ-01 | Cervix | cervical & endocervical cancer | Female | <65 | I/II | Chemotherapy | cisplatin | PD |
| ZNF584 | SNV | Missense_Mutation | c.766N>A | p.Ala256Thr | p.A256T | Q8IVC4 | protein_coding | tolerated(0.27) | benign(0.284) | TCGA-AA-3492-01 | Colorectum | colon adenocarcinoma | Female | >=65 | I/II | Unknown | Unknown | SD | |
| ZNF584 | SNV | Missense_Mutation | c.926A>G | p.Tyr309Cys | p.Y309C | Q8IVC4 | protein_coding | tolerated(0.12) | probably_damaging(0.987) | TCGA-AA-3663-01 | Colorectum | colon adenocarcinoma | Male | <65 | I/II | Unknown | Unknown | SD | |
| ZNF584 | SNV | Missense_Mutation | c.785G>T | p.Arg262Met | p.R262M | Q8IVC4 | protein_coding | deleterious(0) | probably_damaging(0.992) | TCGA-AA-3977-01 | Colorectum | colon adenocarcinoma | Male | >=65 | I/II | Unknown | Unknown | SD | |
| ZNF584 | SNV | Missense_Mutation | rs200181589 | c.1226N>A | p.Arg409His | p.R409H | Q8IVC4 | protein_coding | deleterious(0) | benign(0) | TCGA-CM-4743-01 | Colorectum | colon adenocarcinoma | Male | >=65 | I/II | Chemotherapy | capecitabine | SD |
| Page: 1 2 3 4 5 |
Top |
Related drugs of malignant transformation related genes |
| Identification of chemicals and drugs interact with genes involved in malignant transfromation |
| (DGIdb 4.0) |
| Entrez ID | Symbol | Category | Interaction Types | Drug Claim Name | Drug Name | PMIDs |
| Page: 1 |

Copyright 2023-Present -The University of Texas Health Science Center at Houston |