
|
|||||
|
 | |
| |
| |
| |
| |
| |
|
Gene: ZNF579 |
Gene summary for ZNF579 |
| Gene information | Species | Human | Gene symbol | ZNF579 | Gene ID | 163033 |
| Gene name | zinc finger protein 579 | |
| Gene Alias | ZNF579 | |
| Cytomap | 19q13.42 | |
| Gene Type | protein-coding | GO ID | GO:0005575 | UniProtAcc | Q8NAF0 |
Top |
Malignant transformation analysis |
| Identification of the aberrant gene expression in precancerous and cancerous lesions by comparing the gene expression of stem-like cells in diseased tissues with normal stem cells |
| Entrez ID | Symbol | Replicates | Species | Organ | Tissue | Adj P-value | Log2FC | Malignancy |
| 163033 | ZNF579 | HCC1_Meng | Human | Liver | HCC | 1.76e-35 | 8.76e-02 | 0.0246 |
| 163033 | ZNF579 | HCC2_Meng | Human | Liver | HCC | 5.47e-09 | 7.02e-02 | 0.0107 |
| 163033 | ZNF579 | HCC1 | Human | Liver | HCC | 1.03e-02 | 2.07e+00 | 0.5336 |
| 163033 | ZNF579 | S014 | Human | Liver | HCC | 1.89e-02 | 2.32e-01 | 0.2254 |
| 163033 | ZNF579 | S016 | Human | Liver | HCC | 3.91e-02 | 1.83e-01 | 0.2243 |
| 163033 | ZNF579 | S027 | Human | Liver | HCC | 2.00e-06 | 4.86e-01 | 0.2446 |
| 163033 | ZNF579 | S028 | Human | Liver | HCC | 1.16e-16 | 6.87e-01 | 0.2503 |
| 163033 | ZNF579 | S029 | Human | Liver | HCC | 3.16e-09 | 5.20e-01 | 0.2581 |
| Page: 1 |
| Tissue | Expression Dynamics | Abbreviation |
| Liver | 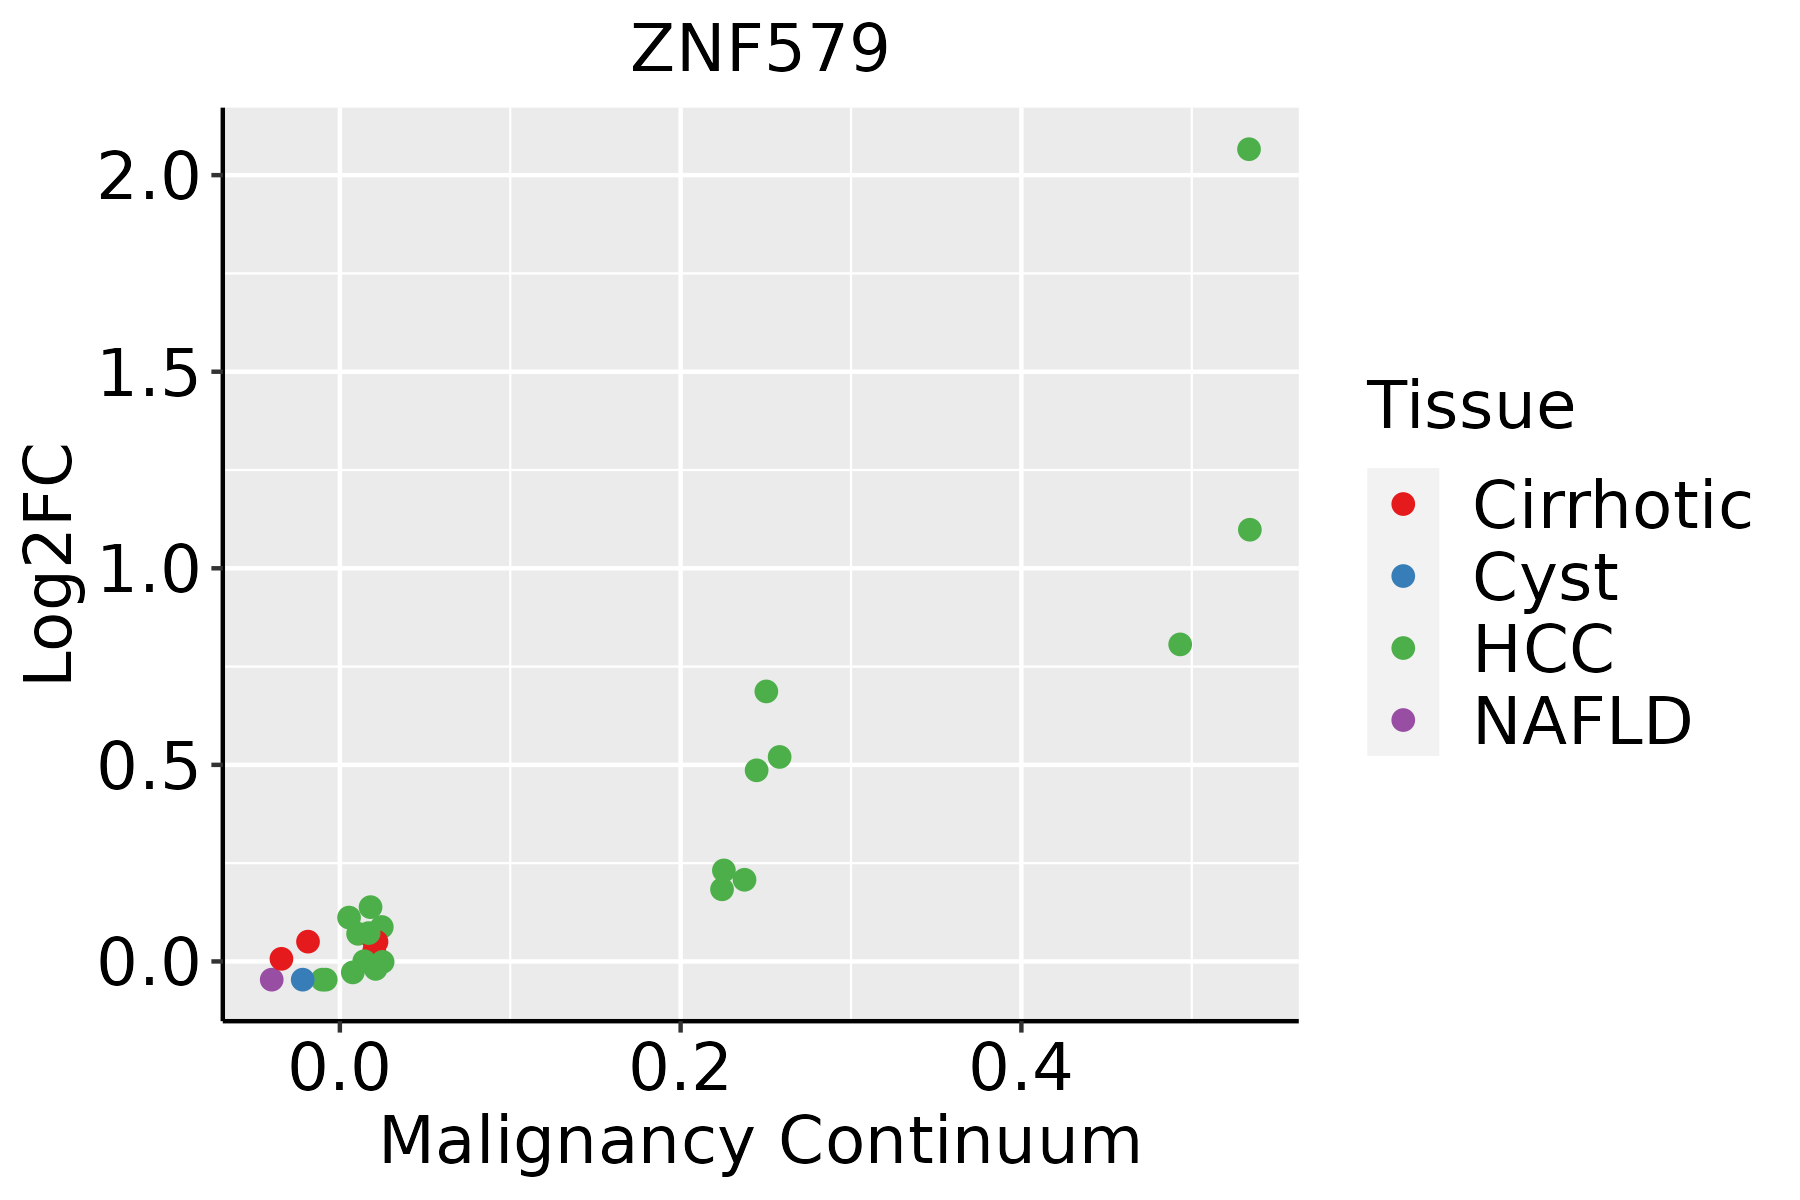 | HCC: Hepatocellular carcinoma |
| NAFLD: Non-alcoholic fatty liver disease |
| ∗log2FC in expression of this searched gene in stem-like cells from each diseased tissue sample relative to stem-like cells in normal samples in each tissue plotted against the malignancy continuum. Samples are colored based on if they are from different disease stage. |
Top |
Malignant transformation related pathway analysis |
| Find out the enriched GO biological processes and KEGG pathways involved in transition from healthy to precancer to cancer |
| Tissue | Disease Stage | Enriched GO biological Processes |
| Colorectum | AD |  |
| Colorectum | SER |  |
| Colorectum | MSS |  |
| Colorectum | MSI-H |  |
| Colorectum | FAP |  |
| ∗Top 15 enriched GO BP terms are showed in the bar plot of each disease state in each tissue. Each row represents a significant GO biological process which is colored according to the -log10(p.adjust). |
| Page: 1 2 3 4 5 6 7 8 9 |
| GO ID | Tissue | Disease Stage | Description | Gene Ratio | Bg Ratio | pvalue | p.adjust | Count |
| Page: 1 |
| Pathway ID | Tissue | Disease Stage | Description | Gene Ratio | Bg Ratio | pvalue | p.adjust | qvalue | Count |
| Page: 1 |
Top |
Cell-cell communication analysis |
| Identification of potential cell-cell interactions between two cell types and their ligand-receptor pairs for different disease states |
| Ligand | Receptor | LRpair | Pathway | Tissue | Disease Stage |
| Page: 1 |
Top |
Single-cell gene regulatory network inference analysis |
| Find out the significant the regulons (TFs) and the target genes of each regulon across cell types for different disease states |
| TF | Cell Type | Tissue | Disease Stage | Target Gene | RSS | Regulon Activity |
| ZNF579 | LYMEND | Breast | ADJ | KLHL25,NEBL,EID2, etc. | 4.81e-02 |  |
| ZNF579 | MSC.ADIPO | Breast | ADJ | KLHL25,NEBL,EID2, etc. | 7.70e-02 | |
| ZNF579 | MSC.ADIPO | Breast | Healthy | KLHL25,NEBL,EID2, etc. | 2.04e-01 |  |
| ZNF579 | LYMEND | Breast | Healthy | KLHL25,NEBL,EID2, etc. | 5.44e-02 | |
| ZNF579 | M2MAC | Cervix | Healthy | NUPR1,MEG3,TP53I3, etc. | 3.52e-02 |  |
| ZNF579 | NK | Cervix | Healthy | NUPR1,MEG3,TP53I3, etc. | 3.26e-02 | |
| ZNF579 | M2MAC | Cervix | N_HPV | NUPR1,MEG3,TP53I3, etc. | 4.76e-02 |  |
| ZNF579 | M2MAC | Endometrium | AEH | DNASE2,SLC29A1,FAM8A1, etc. | 2.06e-01 |  |
| ZNF579 | FIB | Esophagus | ADJ | ARG2,PLIN2,FCN3, etc. | 2.22e-16 |  |
| ZNF579 | MYOFIB | Esophagus | ADJ | ARG2,PLIN2,FCN3, etc. | 0.00e+00 | |
| ∗The dot plots of a searched regulon are shown for all cell subpopulations in each disease state of each tissue based on the regulon specific score inferred using pySCENIC and by calculating the average expression. |
| Page: 1 2 3 |
Top |
Somatic mutation of malignant transformation related genes |
| Annotation of somatic variants for genes involved in malignant transformation |
| Hugo Symbol | Variant Class | Variant Classification | dbSNP RS | HGVSc | HGVSp | HGVSp Short | SWISSPROT | BIOTYPE | SIFT | PolyPhen | Tumor Sample Barcode | Tissue | Histology | Sex | Age | Stage | Therapy Types | Drugs | Outcome |
| ZNF579 | SNV | Missense_Mutation | rs192618440 | c.1588N>T | p.Ala530Ser | p.A530S | Q8NAF0 | protein_coding | tolerated(0.14) | possibly_damaging(0.718) | TCGA-MA-AA42-01 | Cervix | cervical & endocervical cancer | Female | >=65 | I/II | Unknown | Unknown | SD |
| ZNF579 | SNV | Missense_Mutation | novel | c.1354C>T | p.Arg452Cys | p.R452C | Q8NAF0 | protein_coding | deleterious(0) | probably_damaging(0.971) | TCGA-VS-A94X-01 | Cervix | cervical & endocervical cancer | Female | <65 | I/II | Chemotherapy | cisplatin | PD |
| ZNF579 | SNV | Missense_Mutation | c.929N>T | p.Ala310Val | p.A310V | Q8NAF0 | protein_coding | tolerated(0.1) | possibly_damaging(0.533) | TCGA-AD-6964-01 | Colorectum | colon adenocarcinoma | Male | <65 | III/IV | Chemotherapy | folfox | PD | |
| ZNF579 | SNV | Missense_Mutation | c.1537T>A | p.Ser513Thr | p.S513T | Q8NAF0 | protein_coding | deleterious_low_confidence(0.03) | benign(0.255) | TCGA-AD-6965-01 | Colorectum | colon adenocarcinoma | Male | <65 | III/IV | Chemotherapy | oxaliplatin | PD | |
| ZNF579 | SNV | Missense_Mutation | c.788N>T | p.Pro263Leu | p.P263L | Q8NAF0 | protein_coding | deleterious(0.02) | benign(0.031) | TCGA-CK-4951-01 | Colorectum | colon adenocarcinoma | Female | >=65 | I/II | Unknown | Unknown | PD | |
| ZNF579 | SNV | Missense_Mutation | c.1478N>T | p.Ala493Val | p.A493V | Q8NAF0 | protein_coding | tolerated_low_confidence(0.28) | benign(0.003) | TCGA-F4-6856-01 | Colorectum | colon adenocarcinoma | Male | <65 | I/II | Ancillary | leucovorin | CR | |
| ZNF579 | SNV | Missense_Mutation | novel | c.962N>A | p.Gly321Asp | p.G321D | Q8NAF0 | protein_coding | deleterious(0.01) | possibly_damaging(0.878) | TCGA-BG-A222-01 | Endometrium | uterine corpus endometrioid carcinoma | Female | <65 | I/II | Unknown | Unknown | SD |
| ZNF579 | SNV | Missense_Mutation | novel | c.82N>T | p.Arg28Trp | p.R28W | Q8NAF0 | protein_coding | deleterious_low_confidence(0) | probably_damaging(0.948) | TCGA-D1-A175-01 | Endometrium | uterine corpus endometrioid carcinoma | Female | <65 | I/II | Chemotherapy | paclitaxel | SD |
| ZNF579 | SNV | Missense_Mutation | c.1502C>T | p.Pro501Leu | p.P501L | Q8NAF0 | protein_coding | tolerated_low_confidence(0.08) | benign(0.013) | TCGA-D1-A17A-01 | Endometrium | uterine corpus endometrioid carcinoma | Female | <65 | I/II | Unknown | Unknown | SD | |
| ZNF579 | SNV | Missense_Mutation | novel | c.1666N>T | p.Gly556Trp | p.G556W | Q8NAF0 | protein_coding | deleterious_low_confidence(0) | probably_damaging(0.983) | TCGA-D1-A2G0-01 | Endometrium | uterine corpus endometrioid carcinoma | Female | >=65 | I/II | Unknown | Unknown | SD |
| Page: 1 2 |
Top |
Related drugs of malignant transformation related genes |
| Identification of chemicals and drugs interact with genes involved in malignant transfromation |
| (DGIdb 4.0) |
| Entrez ID | Symbol | Category | Interaction Types | Drug Claim Name | Drug Name | PMIDs |
| Page: 1 |

Copyright 2023-Present -The University of Texas Health Science Center at Houston |