
|
|||||
|
 | |
| |
| |
| |
| |
| |
|
Gene: ZNF568 |
Gene summary for ZNF568 |
| Gene information | Species | Human | Gene symbol | ZNF568 | Gene ID | 374900 |
| Gene name | zinc finger protein 568 | |
| Gene Alias | ZFP568 | |
| Cytomap | 19q13.12 | |
| Gene Type | protein-coding | GO ID | GO:0000003 | UniProtAcc | A2VDJ6 |
Top |
Malignant transformation analysis |
| Identification of the aberrant gene expression in precancerous and cancerous lesions by comparing the gene expression of stem-like cells in diseased tissues with normal stem cells |
| Entrez ID | Symbol | Replicates | Species | Organ | Tissue | Adj P-value | Log2FC | Malignancy |
| 374900 | ZNF568 | HCC2 | Human | Liver | HCC | 1.10e-05 | 1.43e+00 | 0.5341 |
| 374900 | ZNF568 | Pt13.b | Human | Liver | HCC | 4.21e-03 | 3.92e-02 | 0.0251 |
| 374900 | ZNF568 | S014 | Human | Liver | HCC | 5.93e-22 | 7.23e-01 | 0.2254 |
| 374900 | ZNF568 | S015 | Human | Liver | HCC | 1.74e-12 | 7.71e-01 | 0.2375 |
| 374900 | ZNF568 | S016 | Human | Liver | HCC | 3.92e-26 | 7.19e-01 | 0.2243 |
| 374900 | ZNF568 | PTC05 | Human | Thyroid | PTC | 5.22e-03 | 1.75e-01 | 0.2065 |
| 374900 | ZNF568 | PTC06 | Human | Thyroid | PTC | 3.40e-07 | 1.83e-01 | 0.2057 |
| 374900 | ZNF568 | PTC07 | Human | Thyroid | PTC | 1.77e-04 | 1.51e-01 | 0.2044 |
| 374900 | ZNF568 | ATC13 | Human | Thyroid | ATC | 1.08e-114 | 2.16e+00 | 0.34 |
| 374900 | ZNF568 | ATC5 | Human | Thyroid | ATC | 2.93e-110 | 2.27e+00 | 0.34 |
| Page: 1 |
| Tissue | Expression Dynamics | Abbreviation |
| Liver | 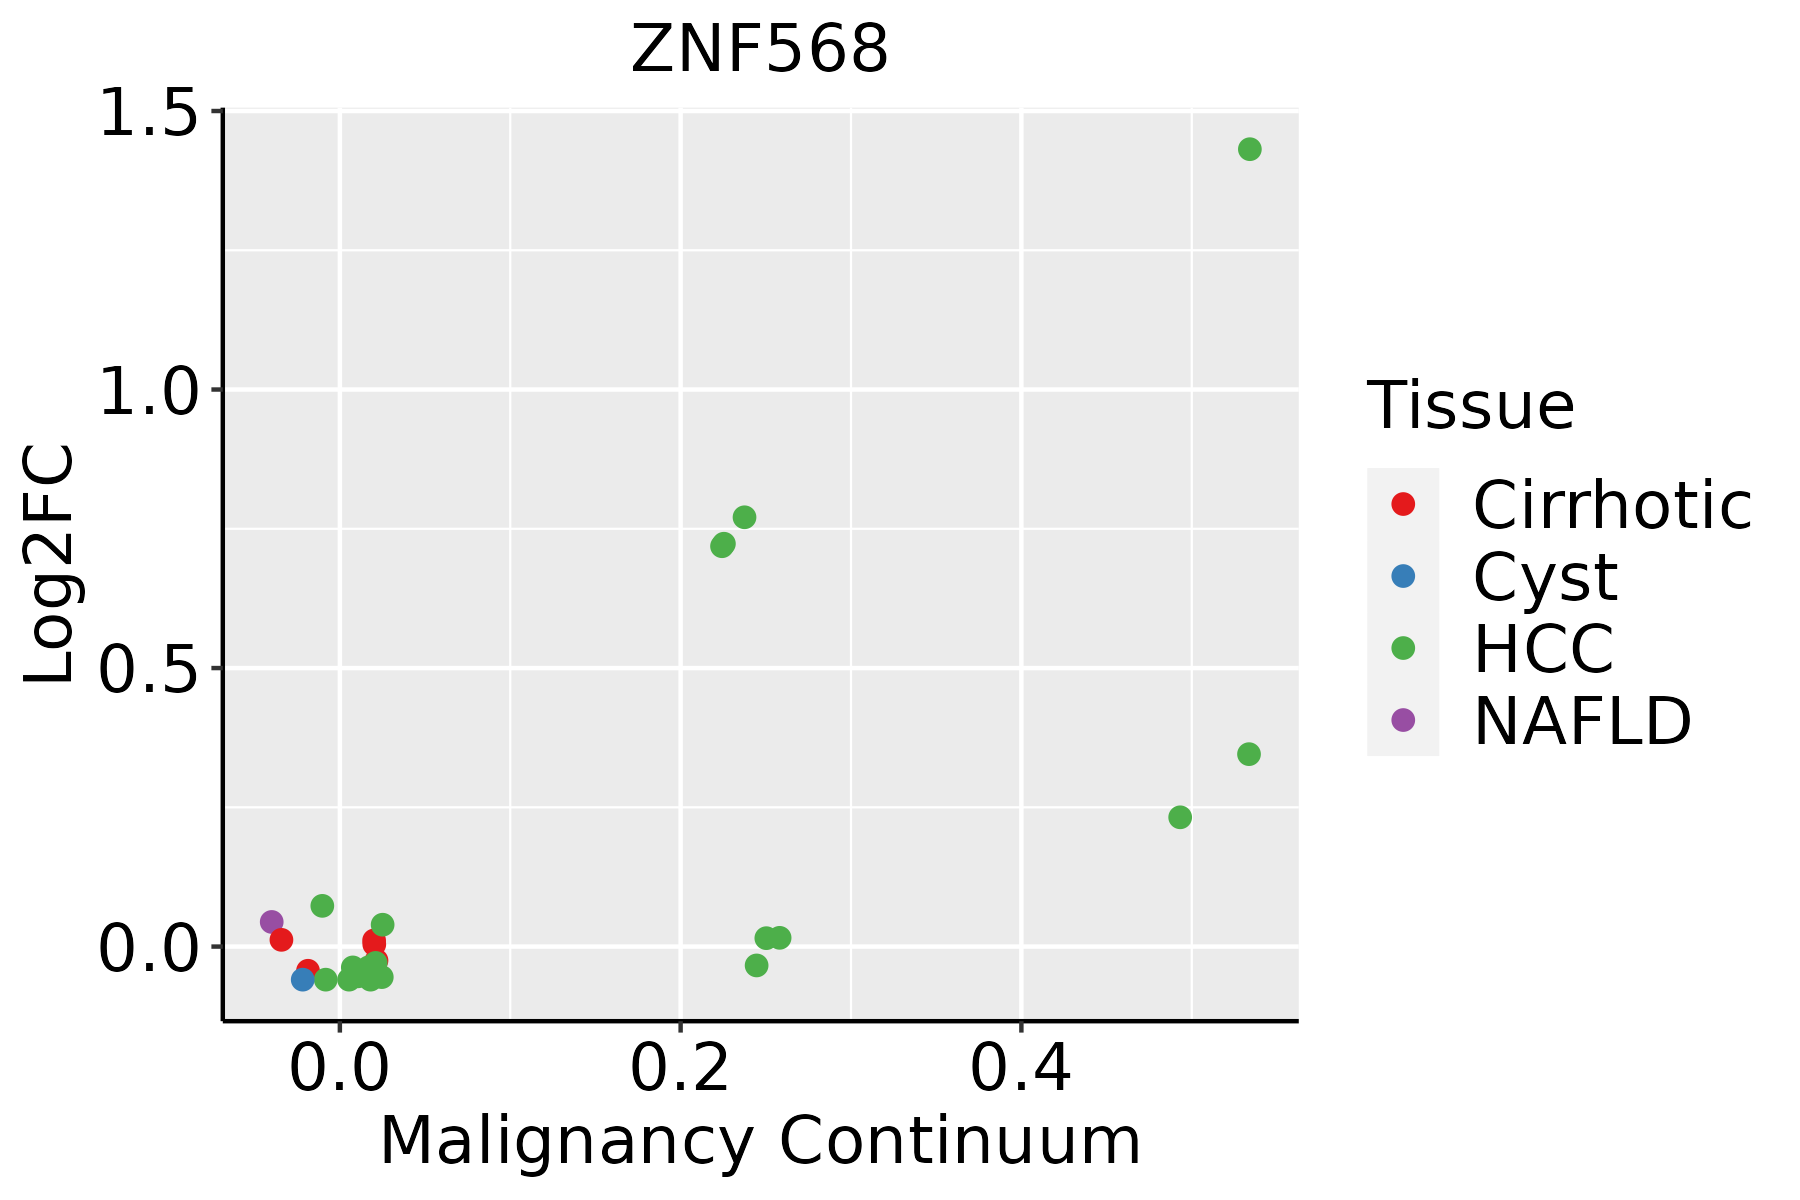 | HCC: Hepatocellular carcinoma |
| NAFLD: Non-alcoholic fatty liver disease | ||
| Thyroid | 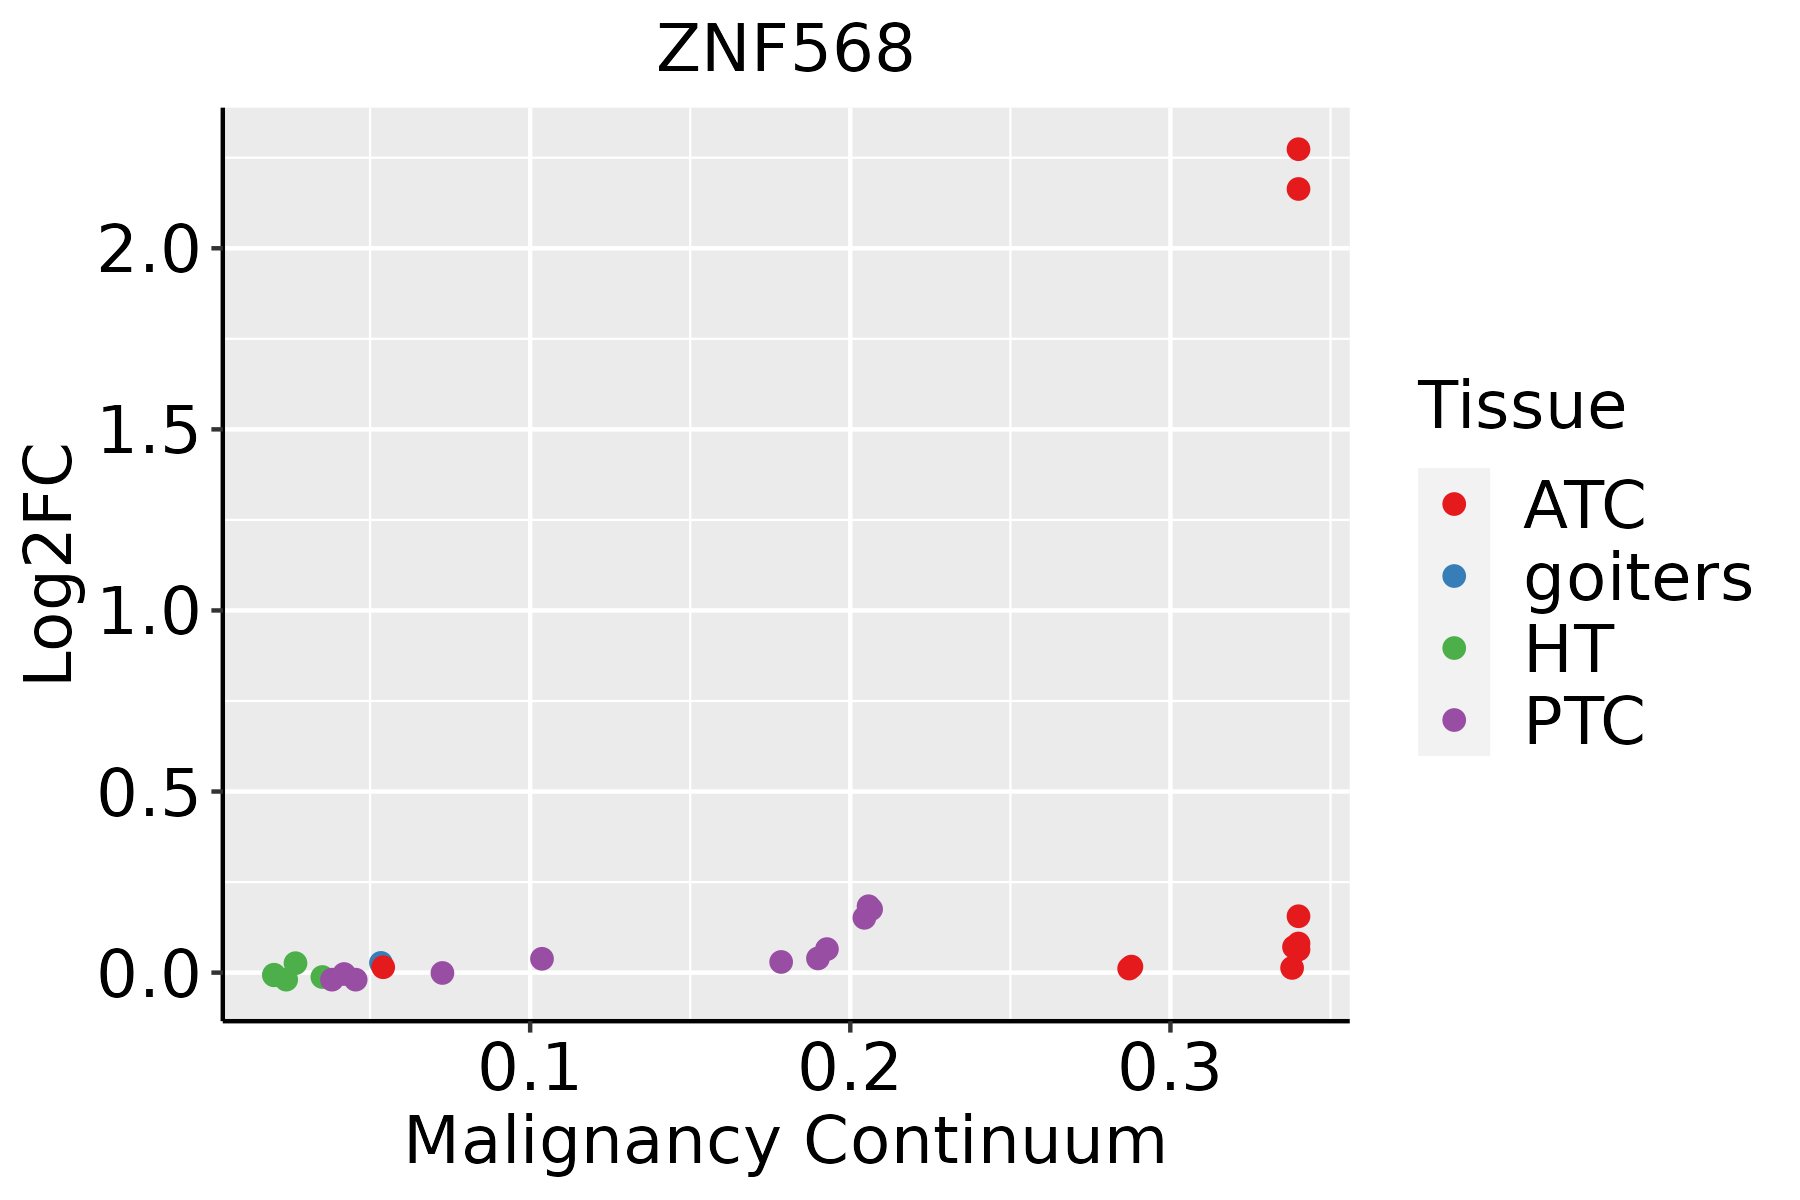 | ATC: Anaplastic thyroid cancer |
| HT: Hashimoto's thyroiditis | ||
| PTC: Papillary thyroid cancer |
| ∗log2FC in expression of this searched gene in stem-like cells from each diseased tissue sample relative to stem-like cells in normal samples in each tissue plotted against the malignancy continuum. Samples are colored based on if they are from different disease stage. |
Top |
Malignant transformation related pathway analysis |
| Find out the enriched GO biological processes and KEGG pathways involved in transition from healthy to precancer to cancer |
| Tissue | Disease Stage | Enriched GO biological Processes |
| Colorectum | AD |  |
| Colorectum | SER |  |
| Colorectum | MSS |  |
| Colorectum | MSI-H |  |
| Colorectum | FAP |  |
| ∗Top 15 enriched GO BP terms are showed in the bar plot of each disease state in each tissue. Each row represents a significant GO biological process which is colored according to the -log10(p.adjust). |
| Page: 1 2 3 4 5 6 7 8 9 |
| GO ID | Tissue | Disease Stage | Description | Gene Ratio | Bg Ratio | pvalue | p.adjust | Count |
| GO:000170111 | Liver | HCC | in utero embryonic development | 204/7958 | 367/18723 | 2.44e-07 | 4.30e-06 | 204 |
| GO:000189211 | Liver | HCC | embryonic placenta development | 50/7958 | 82/18723 | 5.62e-04 | 3.61e-03 | 50 |
| GO:000189011 | Liver | HCC | placenta development | 81/7958 | 144/18723 | 5.91e-04 | 3.75e-03 | 81 |
| GO:00606694 | Liver | HCC | embryonic placenta morphogenesis | 19/7958 | 26/18723 | 1.57e-03 | 8.23e-03 | 19 |
| GO:006145811 | Liver | HCC | reproductive system development | 205/7958 | 427/18723 | 1.16e-02 | 4.27e-02 | 205 |
| GO:0001701111 | Thyroid | PTC | in utero embryonic development | 175/5968 | 367/18723 | 1.40e-10 | 4.73e-09 | 175 |
| GO:000189224 | Thyroid | PTC | embryonic placenta development | 44/5968 | 82/18723 | 3.51e-05 | 3.30e-04 | 44 |
| GO:0061458112 | Thyroid | PTC | reproductive system development | 173/5968 | 427/18723 | 8.70e-05 | 7.23e-04 | 173 |
| GO:0048608111 | Thyroid | PTC | reproductive structure development | 170/5968 | 424/18723 | 1.86e-04 | 1.41e-03 | 170 |
| GO:0001890112 | Thyroid | PTC | placenta development | 66/5968 | 144/18723 | 3.06e-04 | 2.14e-03 | 66 |
| GO:006066917 | Thyroid | PTC | embryonic placenta morphogenesis | 16/5968 | 26/18723 | 1.75e-03 | 9.51e-03 | 16 |
| GO:000170126 | Thyroid | ATC | in utero embryonic development | 183/6293 | 367/18723 | 6.62e-11 | 2.11e-09 | 183 |
| GO:006145827 | Thyroid | ATC | reproductive system development | 193/6293 | 427/18723 | 3.32e-07 | 4.92e-06 | 193 |
| GO:004860825 | Thyroid | ATC | reproductive structure development | 190/6293 | 424/18723 | 8.40e-07 | 1.11e-05 | 190 |
| GO:000189026 | Thyroid | ATC | placenta development | 70/6293 | 144/18723 | 1.33e-04 | 9.33e-04 | 70 |
| GO:0001892111 | Thyroid | ATC | embryonic placenta development | 42/6293 | 82/18723 | 7.34e-04 | 4.11e-03 | 42 |
| GO:00485688 | Thyroid | ATC | embryonic organ development | 172/6293 | 427/18723 | 2.08e-03 | 9.84e-03 | 172 |
| GO:006066918 | Thyroid | ATC | embryonic placenta morphogenesis | 15/6293 | 26/18723 | 9.95e-03 | 3.63e-02 | 15 |
| Page: 1 |
| Pathway ID | Tissue | Disease Stage | Description | Gene Ratio | Bg Ratio | pvalue | p.adjust | qvalue | Count |
| Page: 1 |
Top |
Cell-cell communication analysis |
| Identification of potential cell-cell interactions between two cell types and their ligand-receptor pairs for different disease states |
| Ligand | Receptor | LRpair | Pathway | Tissue | Disease Stage |
| Page: 1 |
Top |
Single-cell gene regulatory network inference analysis |
| Find out the significant the regulons (TFs) and the target genes of each regulon across cell types for different disease states |
| TF | Cell Type | Tissue | Disease Stage | Target Gene | RSS | Regulon Activity |
| ZNF568 | STM | Breast | ADJ | FDCSP,CXCL5,AL590617.2, etc. | 1.69e-02 |  |
| ZNF568 | LUMP | Breast | IDC | FDCSP,CXCL5,AL590617.2, etc. | 1.83e-01 |  |
| ZNF568 | PVA | Prostate | ADJ | PDZRN3,COMMD10,ERG, etc. | 1.33e-02 |  |
| ∗The dot plots of a searched regulon are shown for all cell subpopulations in each disease state of each tissue based on the regulon specific score inferred using pySCENIC and by calculating the average expression. |
| Page: 1 |
Top |
Somatic mutation of malignant transformation related genes |
| Annotation of somatic variants for genes involved in malignant transformation |
| Hugo Symbol | Variant Class | Variant Classification | dbSNP RS | HGVSc | HGVSp | HGVSp Short | SWISSPROT | BIOTYPE | SIFT | PolyPhen | Tumor Sample Barcode | Tissue | Histology | Sex | Age | Stage | Therapy Types | Drugs | Outcome |
| ZNF568 | SNV | Missense_Mutation | novel | c.205N>G | p.Gln69Glu | p.Q69E | Q3ZCX4 | protein_coding | deleterious(0) | probably_damaging(0.991) | TCGA-3C-AALI-01 | Breast | breast invasive carcinoma | Female | <65 | I/II | Unspecific | Poly E | Complete Response |
| ZNF568 | SNV | Missense_Mutation | c.1458G>A | p.Met486Ile | p.M486I | Q3ZCX4 | protein_coding | tolerated(0.48) | benign(0.269) | TCGA-BH-A0DO-01 | Breast | breast invasive carcinoma | Female | >=65 | I/II | Unknown | Unknown | SD | |
| ZNF568 | SNV | Missense_Mutation | c.170N>A | p.Leu57His | p.L57H | Q3ZCX4 | protein_coding | deleterious(0) | possibly_damaging(0.771) | TCGA-D8-A1XW-01 | Breast | breast invasive carcinoma | Female | <65 | I/II | Chemotherapy | adriamycin+cyclophosphamide | SD | |
| ZNF568 | deletion | Frame_Shift_Del | novel | c.73delN | p.Ala26LeufsTer23 | p.A26Lfs*23 | Q3ZCX4 | protein_coding | TCGA-D8-A27V-01 | Breast | breast invasive carcinoma | Female | <65 | I/II | Hormone Therapy | tamoxiphen | SD | ||
| ZNF568 | SNV | Missense_Mutation | novel | c.1091N>A | p.Cys364Tyr | p.C364Y | Q3ZCX4 | protein_coding | deleterious(0) | probably_damaging(1) | TCGA-C5-A1M7-01 | Cervix | cervical & endocervical cancer | Female | <65 | I/II | Unknown | Unknown | SD |
| ZNF568 | SNV | Missense_Mutation | novel | c.583N>C | p.Glu195Gln | p.E195Q | Q3ZCX4 | protein_coding | tolerated(1) | benign(0.001) | TCGA-C5-A7X8-01 | Cervix | cervical & endocervical cancer | Female | <65 | I/II | Chemotherapy | cisplatin | SD |
| ZNF568 | SNV | Missense_Mutation | c.1409N>T | p.Gly470Val | p.G470V | Q3ZCX4 | protein_coding | deleterious(0) | probably_damaging(0.984) | TCGA-EK-A2IP-01 | Cervix | cervical & endocervical cancer | Female | <65 | I/II | Unknown | Unknown | SD | |
| ZNF568 | SNV | Missense_Mutation | c.38N>G | p.Val13Gly | p.V13G | Q3ZCX4 | protein_coding | deleterious_low_confidence(0.03) | benign(0) | TCGA-FU-A40J-01 | Cervix | cervical & endocervical cancer | Female | <65 | III/IV | Chemotherapy | carboplatin | CR | |
| ZNF568 | SNV | Missense_Mutation | c.1124C>T | p.Ser375Leu | p.S375L | Q3ZCX4 | protein_coding | deleterious(0.01) | benign(0.354) | TCGA-JW-A5VL-01 | Cervix | cervical & endocervical cancer | Female | <65 | I/II | Unknown | Unknown | SD | |
| ZNF568 | SNV | Missense_Mutation | novel | c.157N>A | p.Val53Met | p.V53M | protein_coding | tolerated(0.05) | benign(0.142) | TCGA-VS-A8QH-01 | Cervix | cervical & endocervical cancer | Female | >=65 | I/II | Chemotherapy | gemcitabine | PD |
| Page: 1 2 3 4 5 6 7 8 9 10 11 12 13 14 15 |
Top |
Related drugs of malignant transformation related genes |
| Identification of chemicals and drugs interact with genes involved in malignant transfromation |
| (DGIdb 4.0) |
| Entrez ID | Symbol | Category | Interaction Types | Drug Claim Name | Drug Name | PMIDs |
| 374900 | ZNF568 | NA | opioids |
| Page: 1 |

Copyright 2023-Present -The University of Texas Health Science Center at Houston |