
|
|||||
|
 | |
| |
| |
| |
| |
| |
|
Gene: ZNF567 |
Gene summary for ZNF567 |
| Gene information | Species | Human | Gene symbol | ZNF567 | Gene ID | 163081 |
| Gene name | zinc finger protein 567 | |
| Gene Alias | ZNF567 | |
| Cytomap | 19q13.12 | |
| Gene Type | protein-coding | GO ID | GO:0006139 | UniProtAcc | B2R956 |
Top |
Malignant transformation analysis |
| Identification of the aberrant gene expression in precancerous and cancerous lesions by comparing the gene expression of stem-like cells in diseased tissues with normal stem cells |
| Entrez ID | Symbol | Replicates | Species | Organ | Tissue | Adj P-value | Log2FC | Malignancy |
| 163081 | ZNF567 | C38 | Human | Oral cavity | OSCC | 2.69e-02 | 3.42e-01 | 0.172 |
| 163081 | ZNF567 | C46 | Human | Oral cavity | OSCC | 1.87e-03 | 1.21e-01 | 0.1673 |
| 163081 | ZNF567 | C57 | Human | Oral cavity | OSCC | 2.85e-04 | 1.61e-01 | 0.1679 |
| 163081 | ZNF567 | LN22 | Human | Oral cavity | OSCC | 6.42e-11 | 9.82e-01 | 0.1733 |
| 163081 | ZNF567 | LN38 | Human | Oral cavity | OSCC | 4.11e-02 | 5.05e-01 | 0.168 |
| 163081 | ZNF567 | SYSMH3 | Human | Oral cavity | OSCC | 5.30e-07 | 1.59e-01 | 0.2442 |
| 163081 | ZNF567 | male-WTA | Human | Thyroid | PTC | 2.43e-03 | 3.20e-02 | 0.1037 |
| 163081 | ZNF567 | PTC01 | Human | Thyroid | PTC | 1.99e-05 | 8.25e-02 | 0.1899 |
| 163081 | ZNF567 | PTC04 | Human | Thyroid | PTC | 6.26e-06 | 1.33e-01 | 0.1927 |
| 163081 | ZNF567 | PTC05 | Human | Thyroid | PTC | 1.09e-04 | 2.14e-01 | 0.2065 |
| 163081 | ZNF567 | PTC06 | Human | Thyroid | PTC | 9.90e-10 | 1.95e-01 | 0.2057 |
| 163081 | ZNF567 | PTC07 | Human | Thyroid | PTC | 5.51e-11 | 2.16e-01 | 0.2044 |
| 163081 | ZNF567 | ATC12 | Human | Thyroid | ATC | 3.03e-02 | 7.57e-02 | 0.34 |
| 163081 | ZNF567 | ATC13 | Human | Thyroid | ATC | 1.27e-73 | 1.55e+00 | 0.34 |
| 163081 | ZNF567 | ATC2 | Human | Thyroid | ATC | 2.76e-07 | 5.20e-01 | 0.34 |
| 163081 | ZNF567 | ATC4 | Human | Thyroid | ATC | 1.35e-03 | 1.05e-01 | 0.34 |
| 163081 | ZNF567 | ATC5 | Human | Thyroid | ATC | 6.45e-83 | 1.66e+00 | 0.34 |
| Page: 1 |
| Tissue | Expression Dynamics | Abbreviation |
| Oral Cavity | 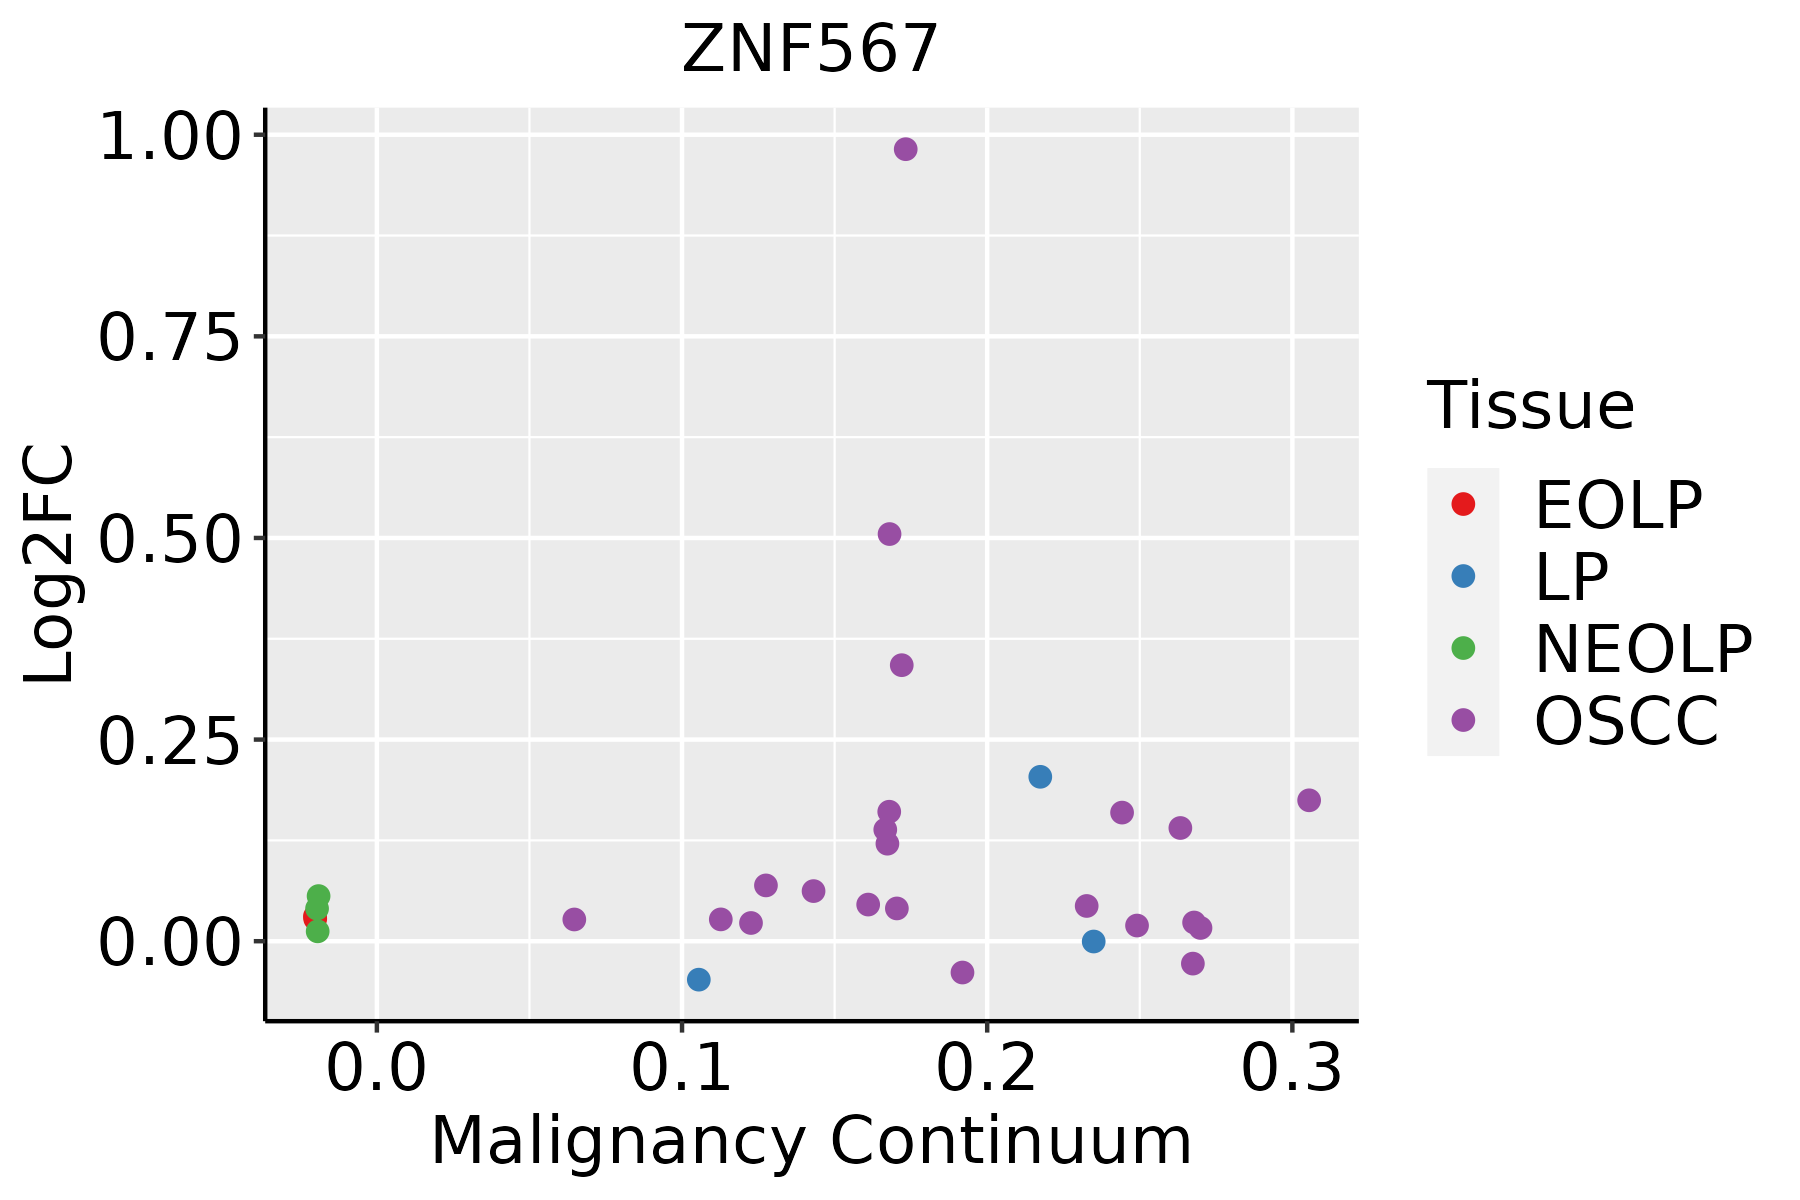 | EOLP: Erosive Oral lichen planus |
| LP: leukoplakia | ||
| NEOLP: Non-erosive oral lichen planus | ||
| OSCC: Oral squamous cell carcinoma | ||
| Thyroid |  | ATC: Anaplastic thyroid cancer |
| HT: Hashimoto's thyroiditis | ||
| PTC: Papillary thyroid cancer |
| ∗log2FC in expression of this searched gene in stem-like cells from each diseased tissue sample relative to stem-like cells in normal samples in each tissue plotted against the malignancy continuum. Samples are colored based on if they are from different disease stage. |
Top |
Malignant transformation related pathway analysis |
| Find out the enriched GO biological processes and KEGG pathways involved in transition from healthy to precancer to cancer |
| Tissue | Disease Stage | Enriched GO biological Processes |
| Colorectum | AD |  |
| Colorectum | SER |  |
| Colorectum | MSS |  |
| Colorectum | MSI-H |  |
| Colorectum | FAP |  |
| ∗Top 15 enriched GO BP terms are showed in the bar plot of each disease state in each tissue. Each row represents a significant GO biological process which is colored according to the -log10(p.adjust). |
| Page: 1 2 3 4 5 6 7 8 9 |
| GO ID | Tissue | Disease Stage | Description | Gene Ratio | Bg Ratio | pvalue | p.adjust | Count |
| Page: 1 |
| Pathway ID | Tissue | Disease Stage | Description | Gene Ratio | Bg Ratio | pvalue | p.adjust | qvalue | Count |
| Page: 1 |
Top |
Cell-cell communication analysis |
| Identification of potential cell-cell interactions between two cell types and their ligand-receptor pairs for different disease states |
| Ligand | Receptor | LRpair | Pathway | Tissue | Disease Stage |
| Page: 1 |
Top |
Single-cell gene regulatory network inference analysis |
| Find out the significant the regulons (TFs) and the target genes of each regulon across cell types for different disease states |
| TF | Cell Type | Tissue | Disease Stage | Target Gene | RSS | Regulon Activity |
| ZNF567 | CFIB | Colorectum | AD | CPLANE1,ASTN2,BRD1, etc. | 7.65e-02 |  |
| ZNF567 | PERI | Colorectum | MSI-H | CPLANE1,ASTN2,BRD1, etc. | 2.46e-01 |  |
| ∗The dot plots of a searched regulon are shown for all cell subpopulations in each disease state of each tissue based on the regulon specific score inferred using pySCENIC and by calculating the average expression. |
| Page: 1 |
Top |
Somatic mutation of malignant transformation related genes |
| Annotation of somatic variants for genes involved in malignant transformation |
| Hugo Symbol | Variant Class | Variant Classification | dbSNP RS | HGVSc | HGVSp | HGVSp Short | SWISSPROT | BIOTYPE | SIFT | PolyPhen | Tumor Sample Barcode | Tissue | Histology | Sex | Age | Stage | Therapy Types | Drugs | Outcome |
| ZNF567 | SNV | Missense_Mutation | c.1621T>A | p.Ser541Thr | p.S541T | Q8N184 | protein_coding | tolerated(1) | benign(0.001) | TCGA-A2-A0SY-01 | Breast | breast invasive carcinoma | Female | <65 | III/IV | Hormone Therapy | arimidex | SD | |
| ZNF567 | SNV | Missense_Mutation | novel | c.1469N>T | p.Ser490Leu | p.S490L | Q8N184 | protein_coding | deleterious(0) | benign(0.001) | TCGA-A8-A076-01 | Breast | breast invasive carcinoma | Female | >=65 | I/II | Hormone Therapy | anastrozole | SD |
| ZNF567 | SNV | Missense_Mutation | c.1402C>G | p.Gln468Glu | p.Q468E | Q8N184 | protein_coding | deleterious(0.01) | benign(0.377) | TCGA-AO-A128-01 | Breast | breast invasive carcinoma | Female | <65 | I/II | Chemotherapy | doxorubicin | SD | |
| ZNF567 | SNV | Missense_Mutation | c.1564C>G | p.Leu522Val | p.L522V | Q8N184 | protein_coding | tolerated(0.44) | possibly_damaging(0.795) | TCGA-AO-A128-01 | Breast | breast invasive carcinoma | Female | <65 | I/II | Chemotherapy | doxorubicin | SD | |
| ZNF567 | insertion | Frame_Shift_Ins | rs772591515 | c.309_310insA | p.Leu106ThrfsTer7 | p.L106Tfs*7 | Q8N184 | protein_coding | TCGA-A8-A09Z-01 | Breast | breast invasive carcinoma | Female | >=65 | I/II | Unknown | Unknown | SD | ||
| ZNF567 | SNV | Missense_Mutation | c.737N>T | p.Ala246Val | p.A246V | Q8N184 | protein_coding | tolerated(0.18) | benign(0.003) | TCGA-AA-3966-01 | Colorectum | colon adenocarcinoma | Female | >=65 | I/II | Unknown | Unknown | SD | |
| ZNF567 | SNV | Missense_Mutation | rs146394117 | c.1910G>T | p.Arg637Ile | p.R637I | Q8N184 | protein_coding | deleterious(0.01) | benign(0.006) | TCGA-AA-A00N-01 | Colorectum | colon adenocarcinoma | Male | >=65 | I/II | Unknown | Unknown | PD |
| ZNF567 | SNV | Missense_Mutation | rs764612587 | c.1007C>T | p.Ser336Leu | p.S336L | Q8N184 | protein_coding | tolerated(0.06) | benign(0.015) | TCGA-AA-A010-01 | Colorectum | colon adenocarcinoma | Female | <65 | I/II | Chemotherapy | folinic | CR |
| ZNF567 | SNV | Missense_Mutation | rs192986331 | c.1742G>T | p.Arg581Ile | p.R581I | Q8N184 | protein_coding | deleterious(0) | possibly_damaging(0.666) | TCGA-AA-A010-01 | Colorectum | colon adenocarcinoma | Female | <65 | I/II | Chemotherapy | folinic | CR |
| ZNF567 | SNV | Missense_Mutation | novel | c.1744N>G | p.Thr582Ala | p.T582A | Q8N184 | protein_coding | deleterious(0.01) | benign(0.012) | TCGA-AZ-4315-01 | Colorectum | colon adenocarcinoma | Male | <65 | I/II | Unknown | Unknown | SD |
| Page: 1 2 3 4 5 6 7 8 9 10 |
Top |
Related drugs of malignant transformation related genes |
| Identification of chemicals and drugs interact with genes involved in malignant transfromation |
| (DGIdb 4.0) |
| Entrez ID | Symbol | Category | Interaction Types | Drug Claim Name | Drug Name | PMIDs |
| Page: 1 |

Copyright 2023-Present -The University of Texas Health Science Center at Houston |