
|
|||||
|
 | |
| |
| |
| |
| |
| |
|
Gene: ZNF561 |
Gene summary for ZNF561 |
| Gene information | Species | Human | Gene symbol | ZNF561 | Gene ID | 93134 |
| Gene name | zinc finger protein 561 | |
| Gene Alias | ZNF561 | |
| Cytomap | 19p13.2 | |
| Gene Type | protein-coding | GO ID | GO:0006139 | UniProtAcc | A8KAD9 |
Top |
Malignant transformation analysis |
| Identification of the aberrant gene expression in precancerous and cancerous lesions by comparing the gene expression of stem-like cells in diseased tissues with normal stem cells |
| Entrez ID | Symbol | Replicates | Species | Organ | Tissue | Adj P-value | Log2FC | Malignancy |
| 93134 | ZNF561 | LZE4T | Human | Esophagus | ESCC | 7.07e-03 | 1.53e-01 | 0.0811 |
| 93134 | ZNF561 | LZE7T | Human | Esophagus | ESCC | 4.51e-03 | 4.12e-01 | 0.0667 |
| 93134 | ZNF561 | LZE8T | Human | Esophagus | ESCC | 6.03e-03 | 1.86e-01 | 0.067 |
| 93134 | ZNF561 | LZE20T | Human | Esophagus | ESCC | 1.89e-03 | 8.52e-02 | 0.0662 |
| 93134 | ZNF561 | LZE24T | Human | Esophagus | ESCC | 4.15e-11 | 2.82e-01 | 0.0596 |
| 93134 | ZNF561 | P1T-E | Human | Esophagus | ESCC | 2.95e-02 | 2.34e-01 | 0.0875 |
| 93134 | ZNF561 | P2T-E | Human | Esophagus | ESCC | 2.79e-06 | 2.46e-01 | 0.1177 |
| 93134 | ZNF561 | P4T-E | Human | Esophagus | ESCC | 6.57e-07 | 1.75e-01 | 0.1323 |
| 93134 | ZNF561 | P5T-E | Human | Esophagus | ESCC | 1.45e-09 | 2.66e-01 | 0.1327 |
| 93134 | ZNF561 | P8T-E | Human | Esophagus | ESCC | 5.08e-12 | 1.96e-01 | 0.0889 |
| 93134 | ZNF561 | P9T-E | Human | Esophagus | ESCC | 8.11e-09 | 2.88e-01 | 0.1131 |
| 93134 | ZNF561 | P10T-E | Human | Esophagus | ESCC | 8.78e-06 | 1.12e-01 | 0.116 |
| 93134 | ZNF561 | P11T-E | Human | Esophagus | ESCC | 9.92e-03 | 2.83e-01 | 0.1426 |
| 93134 | ZNF561 | P12T-E | Human | Esophagus | ESCC | 3.35e-16 | 2.58e-01 | 0.1122 |
| 93134 | ZNF561 | P15T-E | Human | Esophagus | ESCC | 5.27e-14 | 1.94e-01 | 0.1149 |
| 93134 | ZNF561 | P16T-E | Human | Esophagus | ESCC | 1.52e-17 | 1.68e-01 | 0.1153 |
| 93134 | ZNF561 | P17T-E | Human | Esophagus | ESCC | 4.24e-02 | 1.27e-01 | 0.1278 |
| 93134 | ZNF561 | P20T-E | Human | Esophagus | ESCC | 5.76e-07 | 1.77e-01 | 0.1124 |
| 93134 | ZNF561 | P21T-E | Human | Esophagus | ESCC | 2.15e-09 | 1.13e-01 | 0.1617 |
| 93134 | ZNF561 | P22T-E | Human | Esophagus | ESCC | 1.79e-08 | 9.43e-02 | 0.1236 |
| Page: 1 2 3 |
| Tissue | Expression Dynamics | Abbreviation |
| Esophagus | 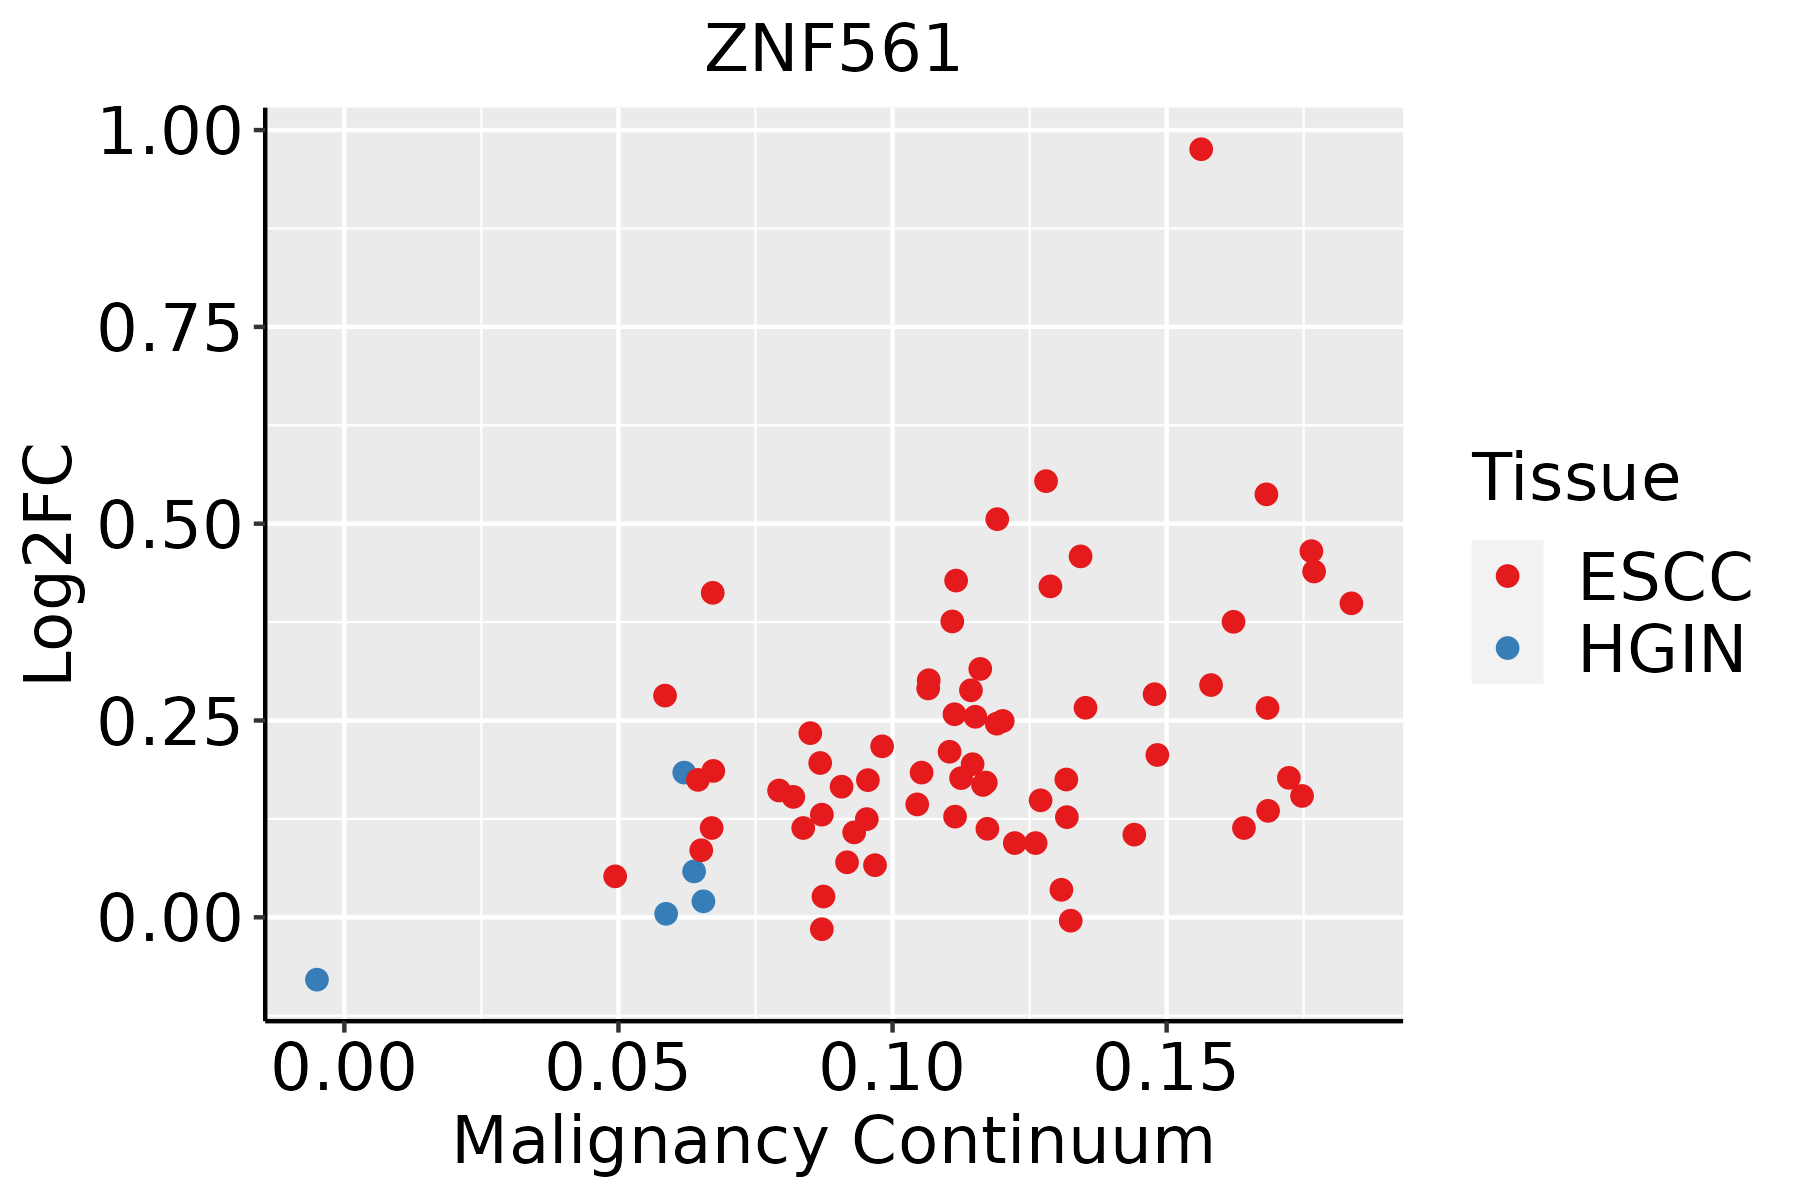 | ESCC: Esophageal squamous cell carcinoma |
| HGIN: High-grade intraepithelial neoplasias | ||
| LGIN: Low-grade intraepithelial neoplasias |
| ∗log2FC in expression of this searched gene in stem-like cells from each diseased tissue sample relative to stem-like cells in normal samples in each tissue plotted against the malignancy continuum. Samples are colored based on if they are from different disease stage. |
Top |
Malignant transformation related pathway analysis |
| Find out the enriched GO biological processes and KEGG pathways involved in transition from healthy to precancer to cancer |
| Tissue | Disease Stage | Enriched GO biological Processes |
| Colorectum | AD |  |
| Colorectum | SER |  |
| Colorectum | MSS |  |
| Colorectum | MSI-H |  |
| Colorectum | FAP |  |
| ∗Top 15 enriched GO BP terms are showed in the bar plot of each disease state in each tissue. Each row represents a significant GO biological process which is colored according to the -log10(p.adjust). |
| Page: 1 2 3 4 5 6 7 8 9 |
| GO ID | Tissue | Disease Stage | Description | Gene Ratio | Bg Ratio | pvalue | p.adjust | Count |
| Page: 1 |
| Pathway ID | Tissue | Disease Stage | Description | Gene Ratio | Bg Ratio | pvalue | p.adjust | qvalue | Count |
| Page: 1 |
Top |
Cell-cell communication analysis |
| Identification of potential cell-cell interactions between two cell types and their ligand-receptor pairs for different disease states |
| Ligand | Receptor | LRpair | Pathway | Tissue | Disease Stage |
| Page: 1 |
Top |
Single-cell gene regulatory network inference analysis |
| Find out the significant the regulons (TFs) and the target genes of each regulon across cell types for different disease states |
| TF | Cell Type | Tissue | Disease Stage | Target Gene | RSS | Regulon Activity |
| ZNF561 | DC | Liver | Healthy | UTY,TPGS1,TMEM117, etc. | 1.45e-02 |  |
| ZNF561 | GRA | Oral cavity | ADJ | ZDHHC14,RBAK,NBPF10, etc. | 3.40e-01 |  |
| ZNF561 | CD8TEXINT | Stomach | WIM | EDARADD,APBA2,GAST, etc. | 3.32e-02 |  |
| ZNF561 | MSC | Stomach | CAG | TMEM2,SEPT7,SNX10, etc. | 4.20e-02 |  |
| ZNF561 | PERI | Stomach | GC | TMEM2,SEPT7,SNX10, etc. | 5.28e-02 |  |
| ZNF561 | CAF | Stomach | WIM | TMEM2,SEPT7,SNX10, etc. | 1.06e-01 | |
| ZNF561 | iATC | Thyroid | ADJ | DIRC3,MYLK4,SPATA5, etc. | 2.72e-02 |  |
| ZNF561 | iATC | Thyroid | PTC | DIRC3,MYLK4,SPATA5, etc. | 1.05e-02 |  |
| ∗The dot plots of a searched regulon are shown for all cell subpopulations in each disease state of each tissue based on the regulon specific score inferred using pySCENIC and by calculating the average expression. |
| Page: 1 |
Top |
Somatic mutation of malignant transformation related genes |
| Annotation of somatic variants for genes involved in malignant transformation |
| Hugo Symbol | Variant Class | Variant Classification | dbSNP RS | HGVSc | HGVSp | HGVSp Short | SWISSPROT | BIOTYPE | SIFT | PolyPhen | Tumor Sample Barcode | Tissue | Histology | Sex | Age | Stage | Therapy Types | Drugs | Outcome |
| ZNF561 | SNV | Missense_Mutation | c.1244A>C | p.His415Pro | p.H415P | Q8N587 | protein_coding | deleterious(0) | probably_damaging(0.985) | TCGA-A8-A09D-01 | Breast | breast invasive carcinoma | Female | <65 | I/II | Chemotherapy | doxorubicin | CR | |
| ZNF561 | SNV | Missense_Mutation | rs372303901 | c.23G>A | p.Arg8His | p.R8H | Q8N587 | protein_coding | tolerated(1) | benign(0) | TCGA-AC-A2QH-01 | Breast | breast invasive carcinoma | Female | <65 | I/II | Chemotherapy | cytoxan | CR |
| ZNF561 | SNV | Missense_Mutation | rs775121778 | c.298N>G | p.Asn100Asp | p.N100D | Q8N587 | protein_coding | tolerated(0.48) | possibly_damaging(0.899) | TCGA-AC-A6IW-01 | Breast | breast invasive carcinoma | Female | >=65 | I/II | Unknown | Unknown | SD |
| ZNF561 | SNV | Missense_Mutation | rs750064577 | c.1322N>A | p.Arg441Gln | p.R441Q | Q8N587 | protein_coding | tolerated(0.06) | probably_damaging(0.966) | TCGA-AN-A046-01 | Breast | breast invasive carcinoma | Female | >=65 | I/II | Unknown | Unknown | SD |
| ZNF561 | SNV | Missense_Mutation | novel | c.797N>G | p.Ser266Cys | p.S266C | Q8N587 | protein_coding | tolerated(0.07) | probably_damaging(0.981) | TCGA-BH-A0B6-01 | Breast | breast invasive carcinoma | Female | <65 | I/II | Unknown | Unknown | SD |
| ZNF561 | SNV | Missense_Mutation | c.1189N>C | p.Glu397Gln | p.E397Q | Q8N587 | protein_coding | tolerated(0.28) | probably_damaging(0.97) | TCGA-BH-A0H5-01 | Breast | breast invasive carcinoma | Female | <65 | I/II | Chemotherapy | cytoxan | CR | |
| ZNF561 | SNV | Missense_Mutation | c.938N>G | p.Tyr313Cys | p.Y313C | Q8N587 | protein_coding | deleterious(0) | possibly_damaging(0.669) | TCGA-D8-A1XK-01 | Breast | breast invasive carcinoma | Female | <65 | I/II | Chemotherapy | doxorubicine+cyclophosphamide | SD | |
| ZNF561 | SNV | Missense_Mutation | novel | c.700N>C | p.Val234Leu | p.V234L | Q8N587 | protein_coding | tolerated(0.22) | benign(0.001) | TCGA-GM-A2DO-01 | Breast | breast invasive carcinoma | Female | <65 | I/II | Hormone Therapy | tamoxiphen | CR |
| ZNF561 | SNV | Missense_Mutation | novel | c.583N>G | p.Gln195Glu | p.Q195E | Q8N587 | protein_coding | tolerated(0.11) | benign(0.017) | TCGA-2W-A8YY-01 | Cervix | cervical & endocervical cancer | Female | <65 | I/II | Chemotherapy | cisplatin | CR |
| ZNF561 | SNV | Missense_Mutation | c.1138N>A | p.Leu380Ile | p.L380I | Q8N587 | protein_coding | deleterious(0.01) | possibly_damaging(0.587) | TCGA-FU-A3HZ-01 | Cervix | cervical & endocervical cancer | Female | <65 | I/II | Chemotherapy | cisplatin | CR |
| Page: 1 2 3 4 5 6 |
Top |
Related drugs of malignant transformation related genes |
| Identification of chemicals and drugs interact with genes involved in malignant transfromation |
| (DGIdb 4.0) |
| Entrez ID | Symbol | Category | Interaction Types | Drug Claim Name | Drug Name | PMIDs |
| Page: 1 |

Copyright 2023-Present -The University of Texas Health Science Center at Houston |