
|
|||||
|
 | |
| |
| |
| |
| |
| |
|
Gene: ZNF552 |
Gene summary for ZNF552 |
| Gene information | Species | Human | Gene symbol | ZNF552 | Gene ID | 79818 |
| Gene name | zinc finger protein 552 | |
| Gene Alias | ZNF552 | |
| Cytomap | 19q13.43 | |
| Gene Type | protein-coding | GO ID | GO:0006139 | UniProtAcc | Q9H707 |
Top |
Malignant transformation analysis |
| Identification of the aberrant gene expression in precancerous and cancerous lesions by comparing the gene expression of stem-like cells in diseased tissues with normal stem cells |
| Entrez ID | Symbol | Replicates | Species | Organ | Tissue | Adj P-value | Log2FC | Malignancy |
| 79818 | ZNF552 | GSM4909298 | Human | Breast | IDC | 2.87e-19 | 4.69e-01 | 0.1551 |
| 79818 | ZNF552 | GSM4909301 | Human | Breast | IDC | 6.41e-30 | 7.99e-01 | 0.1577 |
| 79818 | ZNF552 | GSM4909302 | Human | Breast | IDC | 2.43e-25 | 7.01e-01 | 0.1545 |
| 79818 | ZNF552 | GSM4909307 | Human | Breast | IDC | 4.59e-04 | 3.15e-01 | 0.1569 |
| 79818 | ZNF552 | GSM4909308 | Human | Breast | IDC | 1.39e-29 | 6.32e-01 | 0.158 |
| 79818 | ZNF552 | GSM4909311 | Human | Breast | IDC | 1.58e-04 | 8.11e-02 | 0.1534 |
| 79818 | ZNF552 | GSM4909319 | Human | Breast | IDC | 9.44e-18 | 3.98e-01 | 0.1563 |
| 79818 | ZNF552 | GSM4909321 | Human | Breast | IDC | 4.33e-02 | 1.74e-01 | 0.1559 |
| 79818 | ZNF552 | M1 | Human | Breast | IDC | 4.20e-17 | 5.78e-01 | 0.1577 |
| 79818 | ZNF552 | M5 | Human | Breast | IDC | 1.06e-05 | 6.54e-01 | 0.1598 |
| 79818 | ZNF552 | DCIS2 | Human | Breast | DCIS | 5.09e-13 | -1.95e-02 | 0.0085 |
| 79818 | ZNF552 | LZE5T | Human | Esophagus | ESCC | 1.57e-03 | 3.46e-01 | 0.0514 |
| 79818 | ZNF552 | LZE21D1 | Human | Esophagus | HGIN | 3.53e-05 | 3.46e-01 | 0.0632 |
| 79818 | ZNF552 | LZE24T | Human | Esophagus | ESCC | 7.06e-21 | 4.28e-01 | 0.0596 |
| 79818 | ZNF552 | P1T-E | Human | Esophagus | ESCC | 7.43e-09 | 3.48e-01 | 0.0875 |
| 79818 | ZNF552 | P5T-E | Human | Esophagus | ESCC | 4.40e-05 | 5.67e-02 | 0.1327 |
| 79818 | ZNF552 | P8T-E | Human | Esophagus | ESCC | 1.08e-09 | 1.41e-01 | 0.0889 |
| 79818 | ZNF552 | P10T-E | Human | Esophagus | ESCC | 5.15e-12 | 2.23e-01 | 0.116 |
| 79818 | ZNF552 | P11T-E | Human | Esophagus | ESCC | 2.10e-10 | 2.92e-01 | 0.1426 |
| 79818 | ZNF552 | P12T-E | Human | Esophagus | ESCC | 8.89e-07 | 9.82e-02 | 0.1122 |
| Page: 1 2 3 |
| Tissue | Expression Dynamics | Abbreviation |
| Breast | 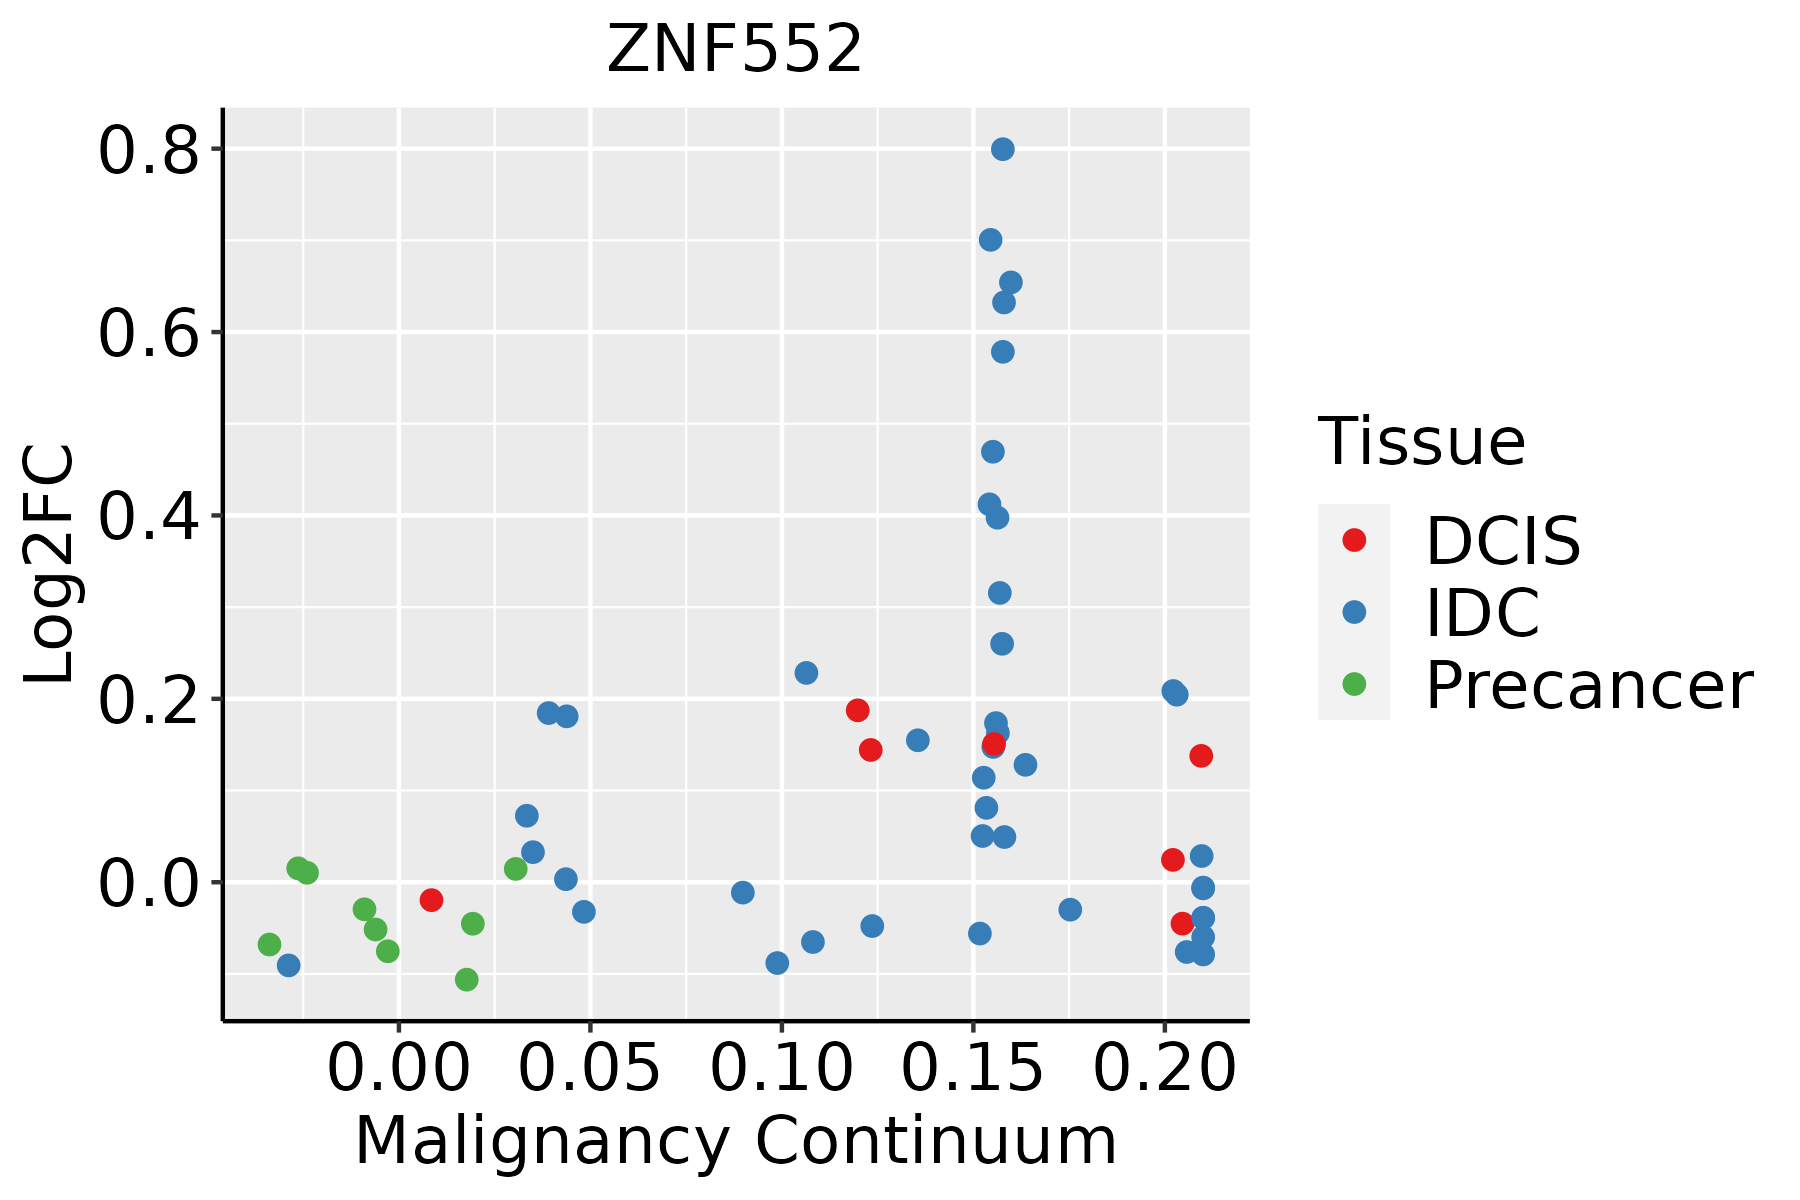 | IDC: Invasive ductal carcinoma |
| DCIS: Ductal carcinoma in situ | ||
| Precancer(BRCA1-mut): Precancerous lesion from BRCA1 mutation carriers | ||
| Esophagus | 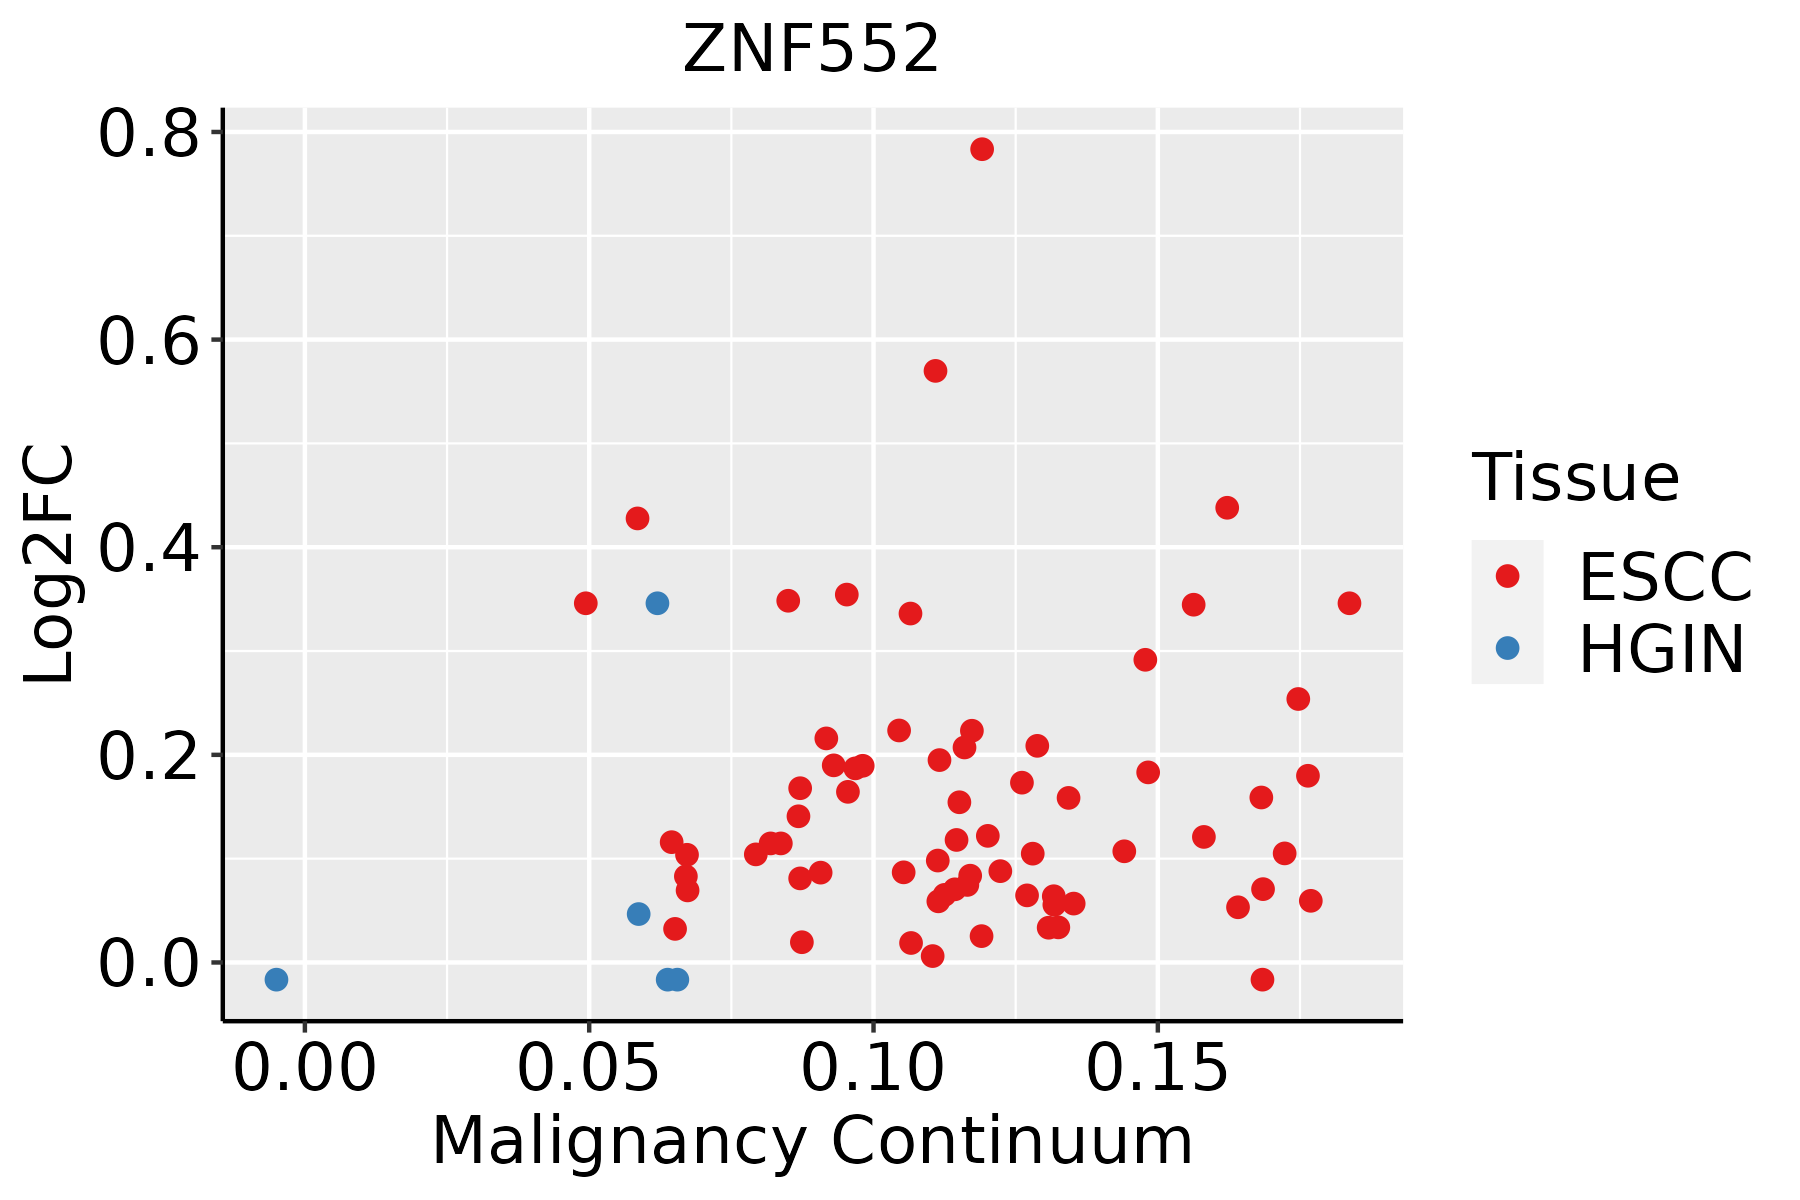 | ESCC: Esophageal squamous cell carcinoma |
| HGIN: High-grade intraepithelial neoplasias | ||
| LGIN: Low-grade intraepithelial neoplasias | ||
| Lung |  | AAH: Atypical adenomatous hyperplasia |
| AIS: Adenocarcinoma in situ | ||
| IAC: Invasive lung adenocarcinoma | ||
| MIA: Minimally invasive adenocarcinoma |
| ∗log2FC in expression of this searched gene in stem-like cells from each diseased tissue sample relative to stem-like cells in normal samples in each tissue plotted against the malignancy continuum. Samples are colored based on if they are from different disease stage. |
Top |
Malignant transformation related pathway analysis |
| Find out the enriched GO biological processes and KEGG pathways involved in transition from healthy to precancer to cancer |
| Tissue | Disease Stage | Enriched GO biological Processes |
| Colorectum | AD |  |
| Colorectum | SER |  |
| Colorectum | MSS |  |
| Colorectum | MSI-H |  |
| Colorectum | FAP |  |
| ∗Top 15 enriched GO BP terms are showed in the bar plot of each disease state in each tissue. Each row represents a significant GO biological process which is colored according to the -log10(p.adjust). |
| Page: 1 2 3 4 5 6 7 8 9 |
| GO ID | Tissue | Disease Stage | Description | Gene Ratio | Bg Ratio | pvalue | p.adjust | Count |
| Page: 1 |
| Pathway ID | Tissue | Disease Stage | Description | Gene Ratio | Bg Ratio | pvalue | p.adjust | qvalue | Count |
| Page: 1 |
Top |
Cell-cell communication analysis |
| Identification of potential cell-cell interactions between two cell types and their ligand-receptor pairs for different disease states |
| Ligand | Receptor | LRpair | Pathway | Tissue | Disease Stage |
| Page: 1 |
Top |
Single-cell gene regulatory network inference analysis |
| Find out the significant the regulons (TFs) and the target genes of each regulon across cell types for different disease states |
| TF | Cell Type | Tissue | Disease Stage | Target Gene | RSS | Regulon Activity |
| ZNF552 | LYMEND | Colorectum | AD | MAP7,RPP14,NAPB, etc. | 0.00e+00 |  |
| ZNF552 | PCV | Colorectum | CRC | MAP7,RPP14,NAPB, etc. | 2.22e-16 |  |
| ZNF552 | ADIPO | Colorectum | Healthy | MAP7,RPP14,NAPB, etc. | 1.53e-02 |  |
| ZNF552 | ICAF | Stomach | CAG | BCAS2,ERI1,EAF2, etc. | 4.29e-02 |  |
| ZNF552 | SMC | Stomach | WIM | BCAS2,ERI1,EAF2, etc. | 9.74e-02 |  |
| ∗The dot plots of a searched regulon are shown for all cell subpopulations in each disease state of each tissue based on the regulon specific score inferred using pySCENIC and by calculating the average expression. |
| Page: 1 |
Top |
Somatic mutation of malignant transformation related genes |
| Annotation of somatic variants for genes involved in malignant transformation |
| Hugo Symbol | Variant Class | Variant Classification | dbSNP RS | HGVSc | HGVSp | HGVSp Short | SWISSPROT | BIOTYPE | SIFT | PolyPhen | Tumor Sample Barcode | Tissue | Histology | Sex | Age | Stage | Therapy Types | Drugs | Outcome |
| ZNF552 | SNV | Missense_Mutation | novel | c.791N>C | p.Arg264Thr | p.R264T | Q9H707 | protein_coding | deleterious(0.01) | benign(0.405) | TCGA-3C-AALI-01 | Breast | breast invasive carcinoma | Female | <65 | I/II | Unspecific | Poly E | Complete Response |
| ZNF552 | SNV | Missense_Mutation | rs774026257 | c.454G>A | p.Glu152Lys | p.E152K | Q9H707 | protein_coding | tolerated(0.17) | benign(0) | TCGA-B6-A0IK-01 | Breast | breast invasive carcinoma | Female | <65 | III/IV | Unknown | Unknown | PD |
| ZNF552 | SNV | Missense_Mutation | rs576029108 | c.470N>T | p.Ala157Val | p.A157V | Q9H707 | protein_coding | tolerated(1) | benign(0) | TCGA-BH-A0C0-01 | Breast | breast invasive carcinoma | Female | <65 | I/II | Chemotherapy | carboplatin | SD |
| ZNF552 | SNV | Missense_Mutation | c.921N>A | p.His307Gln | p.H307Q | Q9H707 | protein_coding | tolerated(1) | benign(0.003) | TCGA-E9-A244-01 | Breast | breast invasive carcinoma | Female | <65 | I/II | Chemotherapy | cyclophosphamide | SD | |
| ZNF552 | SNV | Missense_Mutation | rs771493465 | c.1019N>A | p.Arg340His | p.R340H | Q9H707 | protein_coding | tolerated(0.07) | benign(0.001) | TCGA-LL-A441-01 | Breast | breast invasive carcinoma | Female | <65 | I/II | Chemotherapy | taxotere | CR |
| ZNF552 | insertion | Frame_Shift_Ins | novel | c.692_693insTTCTCCAATATTTAAT | p.Glu231AspfsTer19 | p.E231Dfs*19 | Q9H707 | protein_coding | TCGA-A8-A06T-01 | Breast | breast invasive carcinoma | Female | >=65 | III/IV | Hormone Therapy | anastrozole | SD | ||
| ZNF552 | SNV | Missense_Mutation | novel | c.989N>A | p.Gly330Glu | p.G330E | Q9H707 | protein_coding | deleterious(0.03) | probably_damaging(0.986) | TCGA-2W-A8YY-01 | Cervix | cervical & endocervical cancer | Female | <65 | I/II | Chemotherapy | cisplatin | CR |
| ZNF552 | SNV | Missense_Mutation | novel | c.1122N>G | p.His374Gln | p.H374Q | Q9H707 | protein_coding | deleterious(0) | probably_damaging(1) | TCGA-DS-A1OB-01 | Cervix | cervical & endocervical cancer | Female | <65 | I/II | Chemotherapy | carboplatin | PD |
| ZNF552 | SNV | Missense_Mutation | novel | c.58G>T | p.Ala20Ser | p.A20S | Q9H707 | protein_coding | deleterious(0.01) | probably_damaging(0.984) | TCGA-EA-A3HS-01 | Cervix | cervical & endocervical cancer | Female | <65 | I/II | Unknown | Unknown | SD |
| ZNF552 | SNV | Missense_Mutation | c.1144N>C | p.Cys382Arg | p.C382R | Q9H707 | protein_coding | deleterious(0) | probably_damaging(1) | TCGA-AA-3715-01 | Colorectum | colon adenocarcinoma | Male | >=65 | I/II | Unknown | Unknown | PD |
| Page: 1 2 3 4 |
Top |
Related drugs of malignant transformation related genes |
| Identification of chemicals and drugs interact with genes involved in malignant transfromation |
| (DGIdb 4.0) |
| Entrez ID | Symbol | Category | Interaction Types | Drug Claim Name | Drug Name | PMIDs |
| Page: 1 |

Copyright 2023-Present -The University of Texas Health Science Center at Houston |