
|
|||||
|
 | |
| |
| |
| |
| |
| |
|
Gene: ZNF532 |
Gene summary for ZNF532 |
| Gene information | Species | Human | Gene symbol | ZNF532 | Gene ID | 55205 |
| Gene name | zinc finger protein 532 | |
| Gene Alias | ZNF532 | |
| Cytomap | 18q21.32 | |
| Gene Type | protein-coding | GO ID | GO:0005575 | UniProtAcc | A0A024R283 |
Top |
Malignant transformation analysis |
| Identification of the aberrant gene expression in precancerous and cancerous lesions by comparing the gene expression of stem-like cells in diseased tissues with normal stem cells |
| Entrez ID | Symbol | Replicates | Species | Organ | Tissue | Adj P-value | Log2FC | Malignancy |
| 55205 | ZNF532 | CCI_1 | Human | Cervix | CC | 2.23e-04 | 5.26e-01 | 0.528 |
| 55205 | ZNF532 | CCI_2 | Human | Cervix | CC | 1.40e-05 | 5.92e-01 | 0.5249 |
| 55205 | ZNF532 | CCI_3 | Human | Cervix | CC | 1.06e-18 | 1.10e+00 | 0.516 |
| 55205 | ZNF532 | 048752_1579-all-cells | Human | Prostate | BPH | 1.04e-08 | 3.66e-01 | 0.1008 |
| 55205 | ZNF532 | 052095_1628-all-cells | Human | Prostate | BPH | 5.75e-11 | 3.55e-01 | 0.1032 |
| 55205 | ZNF532 | 052097_1595-all-cells | Human | Prostate | BPH | 1.63e-09 | 2.99e-01 | 0.0972 |
| 55205 | ZNF532 | 052099_1652-all-cells | Human | Prostate | BPH | 3.84e-13 | 3.83e-01 | 0.1038 |
| 55205 | ZNF532 | Dong_P1 | Human | Prostate | Tumor | 3.56e-11 | 9.77e-02 | 0.035 |
| 55205 | ZNF532 | Dong_P3 | Human | Prostate | Tumor | 4.10e-15 | 2.55e-01 | 0.0278 |
| 55205 | ZNF532 | Dong_P4 | Human | Prostate | Tumor | 3.37e-02 | 1.19e-01 | 0.0292 |
| 55205 | ZNF532 | GSM5353216_PA_PB1A_Pool_1_3_S50_L002 | Human | Prostate | Tumor | 8.20e-03 | 6.45e-01 | 0.159 |
| 55205 | ZNF532 | GSM5353221_PA_PB2A_Pool_1_3_S25_L001 | Human | Prostate | Tumor | 1.58e-08 | 5.78e-01 | 0.1633 |
| 55205 | ZNF532 | GSM5353222_PA_PB2B_Pool_1_3_S52_L002 | Human | Prostate | Tumor | 8.96e-09 | 5.35e-01 | 0.1608 |
| 55205 | ZNF532 | GSM5353223_PA_PB2B_Pool_2_S26_L001 | Human | Prostate | Tumor | 5.65e-10 | 6.66e-01 | 0.1604 |
| 55205 | ZNF532 | GSM5353224_PA_PR5186_Pool_1_2_3_S27_L001 | Human | Prostate | Tumor | 1.25e-08 | 5.79e-01 | 0.1621 |
| 55205 | ZNF532 | GSM5353225_PA_PR5196-1_Pool_1_2_3_S53_L002 | Human | Prostate | Tumor | 1.27e-04 | 6.32e-01 | 0.1619 |
| 55205 | ZNF532 | GSM5353226_PA_PR5196-2_Pool_1_2_3_S54_L002 | Human | Prostate | Tumor | 2.18e-02 | 5.61e-01 | 0.159 |
| 55205 | ZNF532 | GSM5353248_PA_PR5269_4_S28_L002 | Human | Prostate | Tumor | 1.47e-03 | 6.35e-01 | 0.1541 |
| 55205 | ZNF532 | P10_cSCC | Human | Skin | cSCC | 4.80e-13 | 5.43e-01 | 0.1017 |
| 55205 | ZNF532 | male-WTA | Human | Thyroid | PTC | 3.76e-33 | 2.72e-01 | 0.1037 |
| Page: 1 2 |
| Tissue | Expression Dynamics | Abbreviation |
| Cervix |  | CC: Cervix cancer |
| HSIL_HPV: HPV-infected high-grade squamous intraepithelial lesions | ||
| N_HPV: HPV-infected normal cervix | ||
| Prostate | 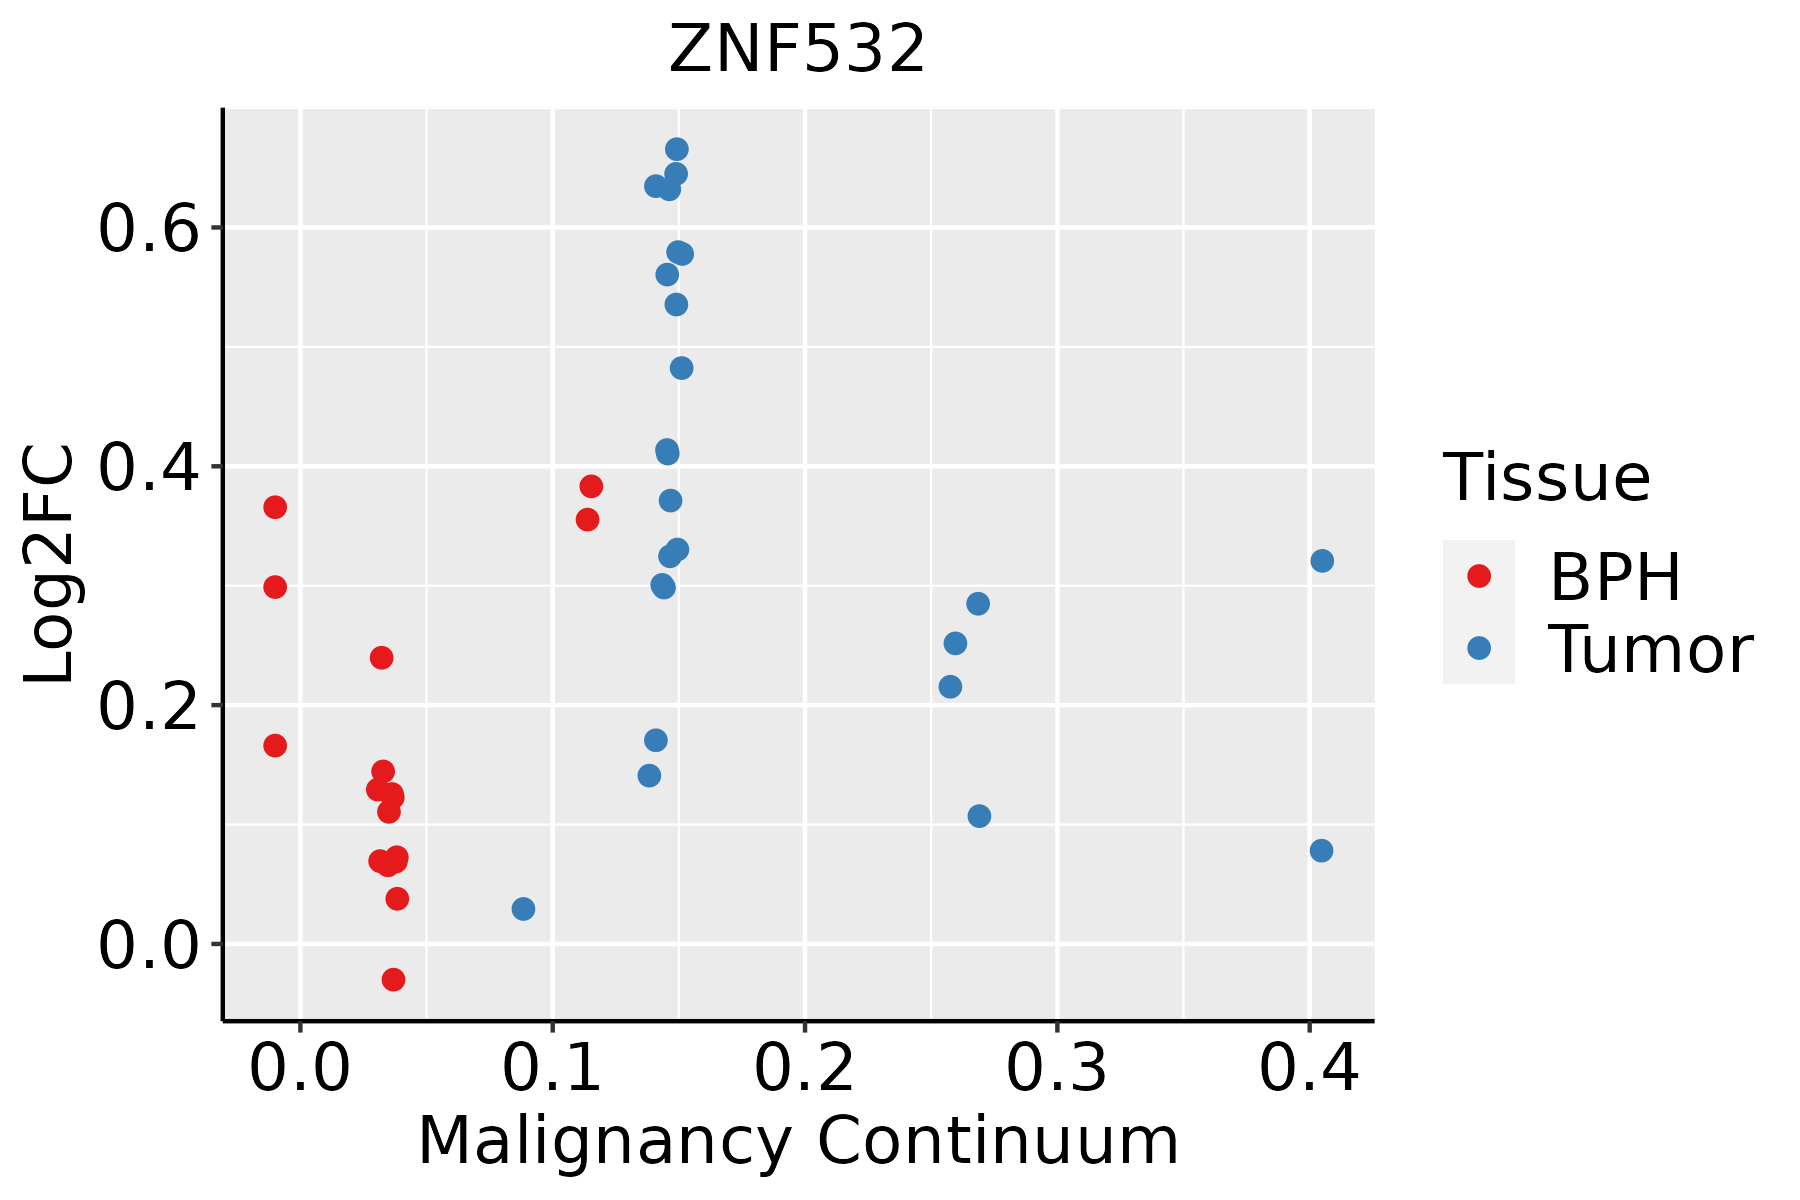 | BPH: Benign Prostatic Hyperplasia |
| Skin | 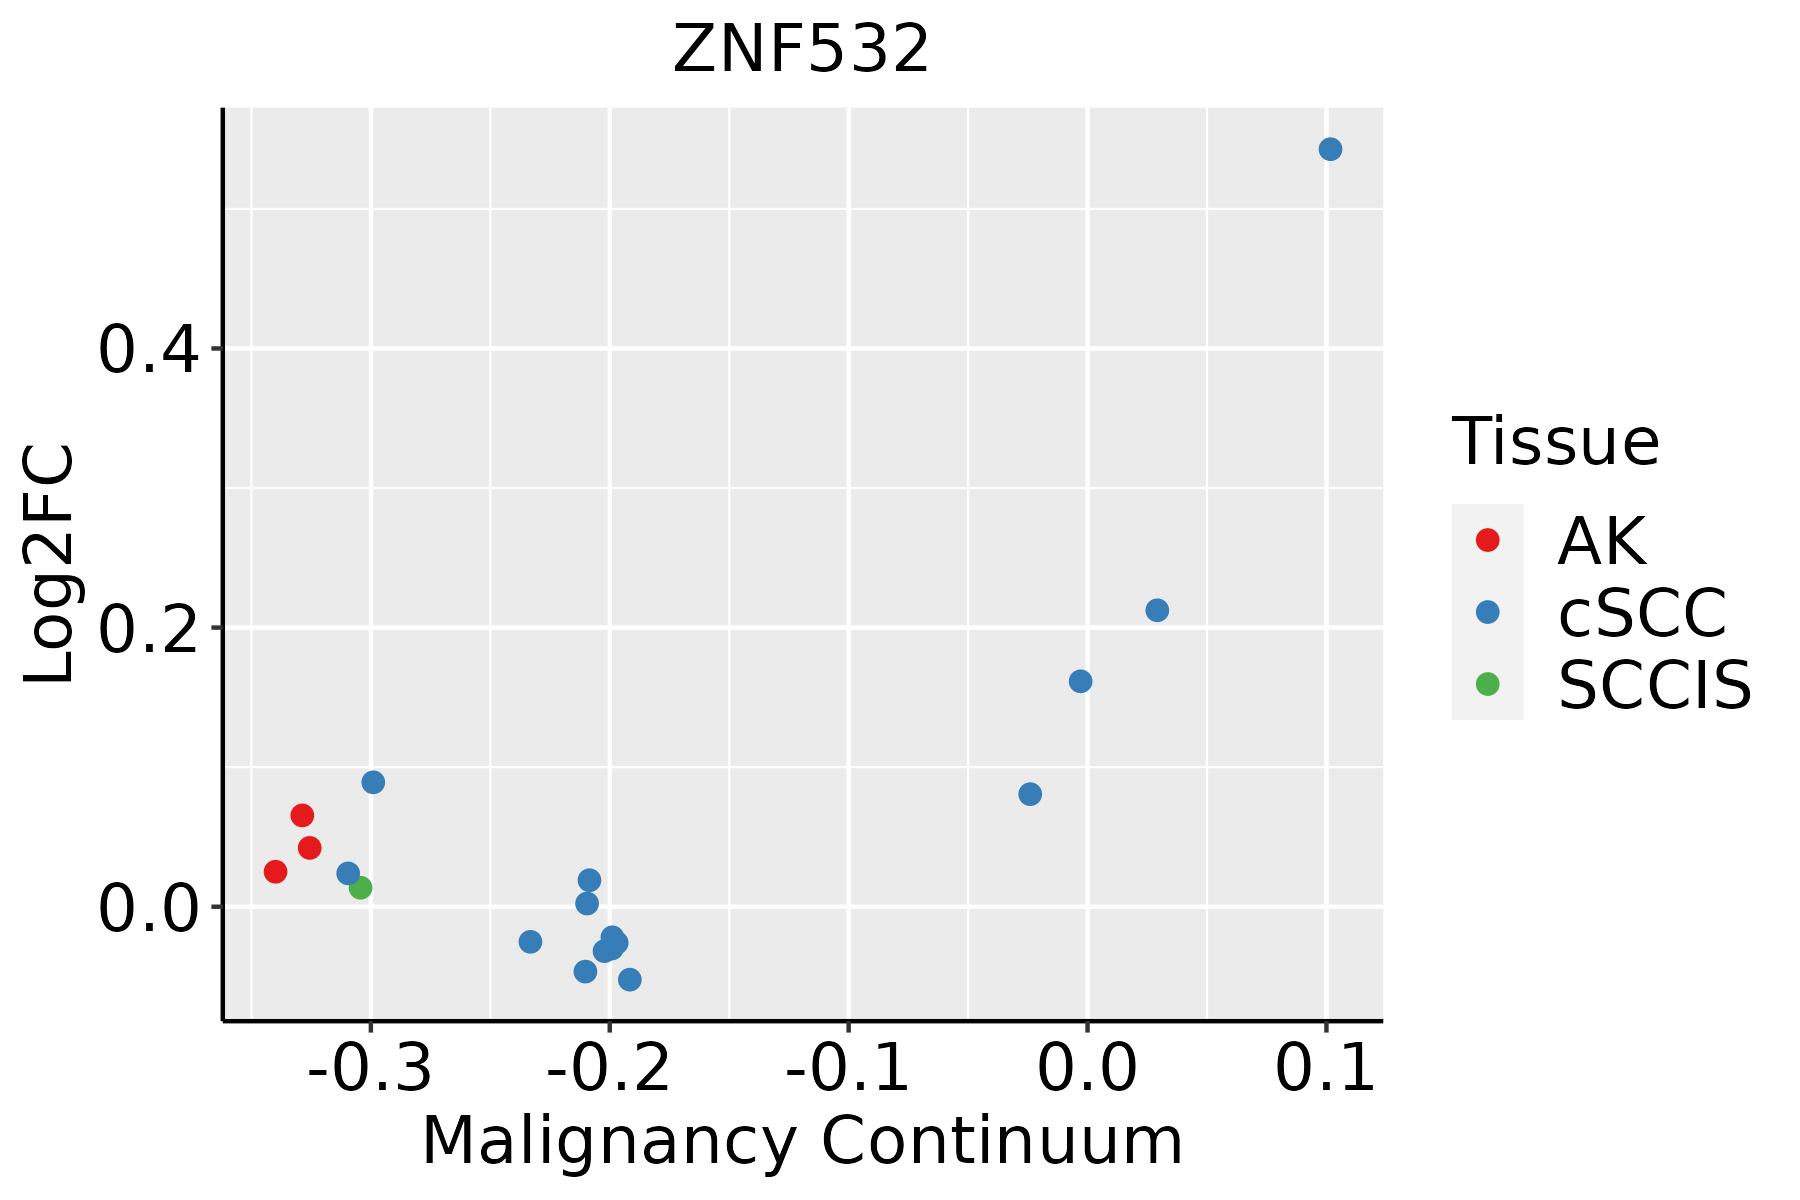 | AK: Actinic keratosis |
| cSCC: Cutaneous squamous cell carcinoma | ||
| SCCIS:squamous cell carcinoma in situ | ||
| Thyroid |  | ATC: Anaplastic thyroid cancer |
| HT: Hashimoto's thyroiditis | ||
| PTC: Papillary thyroid cancer |
| ∗log2FC in expression of this searched gene in stem-like cells from each diseased tissue sample relative to stem-like cells in normal samples in each tissue plotted against the malignancy continuum. Samples are colored based on if they are from different disease stage. |
Top |
Malignant transformation related pathway analysis |
| Find out the enriched GO biological processes and KEGG pathways involved in transition from healthy to precancer to cancer |
| Tissue | Disease Stage | Enriched GO biological Processes |
| Colorectum | AD |  |
| Colorectum | SER |  |
| Colorectum | MSS |  |
| Colorectum | MSI-H |  |
| Colorectum | FAP |  |
| ∗Top 15 enriched GO BP terms are showed in the bar plot of each disease state in each tissue. Each row represents a significant GO biological process which is colored according to the -log10(p.adjust). |
| Page: 1 2 3 4 5 6 7 8 9 |
| GO ID | Tissue | Disease Stage | Description | Gene Ratio | Bg Ratio | pvalue | p.adjust | Count |
| Page: 1 |
| Pathway ID | Tissue | Disease Stage | Description | Gene Ratio | Bg Ratio | pvalue | p.adjust | qvalue | Count |
| Page: 1 |
Top |
Cell-cell communication analysis |
| Identification of potential cell-cell interactions between two cell types and their ligand-receptor pairs for different disease states |
| Ligand | Receptor | LRpair | Pathway | Tissue | Disease Stage |
| Page: 1 |
Top |
Single-cell gene regulatory network inference analysis |
| Find out the significant the regulons (TFs) and the target genes of each regulon across cell types for different disease states |
| TF | Cell Type | Tissue | Disease Stage | Target Gene | RSS | Regulon Activity |
| ∗The dot plots of a searched regulon are shown for all cell subpopulations in each disease state of each tissue based on the regulon specific score inferred using pySCENIC and by calculating the average expression. |
| Page: 1 |
Top |
Somatic mutation of malignant transformation related genes |
| Annotation of somatic variants for genes involved in malignant transformation |
| Hugo Symbol | Variant Class | Variant Classification | dbSNP RS | HGVSc | HGVSp | HGVSp Short | SWISSPROT | BIOTYPE | SIFT | PolyPhen | Tumor Sample Barcode | Tissue | Histology | Sex | Age | Stage | Therapy Types | Drugs | Outcome |
| ZNF532 | SNV | Missense_Mutation | rs373691715 | c.1243N>A | p.Val415Ile | p.V415I | Q9HCE3 | protein_coding | tolerated(0.31) | benign(0.001) | TCGA-AN-A046-01 | Breast | breast invasive carcinoma | Female | >=65 | I/II | Unknown | Unknown | SD |
| ZNF532 | SNV | Missense_Mutation | rs373691715 | c.1243N>A | p.Val415Ile | p.V415I | Q9HCE3 | protein_coding | tolerated(0.31) | benign(0.001) | TCGA-AO-A03O-01 | Breast | breast invasive carcinoma | Female | >=65 | I/II | Chemotherapy | doxorubicin | SD |
| ZNF532 | SNV | Missense_Mutation | rs764368512 | c.2569C>G | p.Leu857Val | p.L857V | Q9HCE3 | protein_coding | tolerated(0.08) | benign(0.05) | TCGA-AR-A2LE-01 | Breast | breast invasive carcinoma | Female | >=65 | I/II | Hormone Therapy | tamoxiphen | PD |
| ZNF532 | SNV | Missense_Mutation | novel | c.2480N>A | p.Thr827Asn | p.T827N | Q9HCE3 | protein_coding | deleterious(0.03) | benign(0) | TCGA-AR-A2LH-01 | Breast | breast invasive carcinoma | Female | <65 | III/IV | Chemotherapy | adriamycin | PD |
| ZNF532 | SNV | Missense_Mutation | c.1564N>T | p.Val522Leu | p.V522L | Q9HCE3 | protein_coding | deleterious(0.04) | probably_damaging(0.984) | TCGA-D8-A1J9-01 | Breast | breast invasive carcinoma | Female | <65 | I/II | Unknown | Unknown | SD | |
| ZNF532 | SNV | Missense_Mutation | c.541N>C | p.Gly181Arg | p.G181R | Q9HCE3 | protein_coding | tolerated(0.06) | benign(0.015) | TCGA-E2-A1IU-01 | Breast | breast invasive carcinoma | Female | <65 | I/II | Hormone Therapy | arimidex | SD | |
| ZNF532 | SNV | Missense_Mutation | c.2336N>T | p.Thr779Met | p.T779M | Q9HCE3 | protein_coding | tolerated(0.06) | possibly_damaging(0.614) | TCGA-E9-A3X8-01 | Breast | breast invasive carcinoma | Female | <65 | I/II | Chemotherapy | cyclophosphane | CR | |
| ZNF532 | insertion | Nonsense_Mutation | novel | c.3379_3380insATTATTTCCCCATGAACTCGCTGTAA | p.Glu1127AspfsTer9 | p.E1127Dfs*9 | Q9HCE3 | protein_coding | TCGA-AO-A0JB-01 | Breast | breast invasive carcinoma | Female | <65 | III/IV | Chemotherapy | cyclophosphamide | SD | ||
| ZNF532 | insertion | In_Frame_Ins | novel | c.547_548insTCCCAGGGTTCATAAGAATGTCAGACAGTCGCACTGCCGACC | p.Asn183delinsIleProGlyPheIleArgMetSerAspSerArgThrAlaAspHis | p.N183delinsIPGFIRMSDSRTADH | Q9HCE3 | protein_coding | TCGA-BH-A0AY-01 | Breast | breast invasive carcinoma | Female | <65 | I/II | Chemotherapy | SD | |||
| ZNF532 | SNV | Missense_Mutation | novel | c.3811N>C | p.Lys1271Gln | p.K1271Q | Q9HCE3 | protein_coding | deleterious(0.02) | probably_damaging(0.947) | TCGA-2W-A8YY-01 | Cervix | cervical & endocervical cancer | Female | <65 | I/II | Chemotherapy | cisplatin | CR |
| Page: 1 2 3 4 5 6 7 8 9 10 11 12 13 14 |
Top |
Related drugs of malignant transformation related genes |
| Identification of chemicals and drugs interact with genes involved in malignant transfromation |
| (DGIdb 4.0) |
| Entrez ID | Symbol | Category | Interaction Types | Drug Claim Name | Drug Name | PMIDs |
| Page: 1 |

Copyright 2023-Present -The University of Texas Health Science Center at Houston |