
|
|||||
|
 | |
| |
| |
| |
| |
| |
|
Gene: ZNF528 |
Gene summary for ZNF528 |
| Gene information | Species | Human | Gene symbol | ZNF528 | Gene ID | 84436 |
| Gene name | zinc finger protein 528 | |
| Gene Alias | ZNF528 | |
| Cytomap | 19q13.41 | |
| Gene Type | protein-coding | GO ID | GO:0006139 | UniProtAcc | Q3MIS6 |
Top |
Malignant transformation analysis |
| Identification of the aberrant gene expression in precancerous and cancerous lesions by comparing the gene expression of stem-like cells in diseased tissues with normal stem cells |
| Entrez ID | Symbol | Replicates | Species | Organ | Tissue | Adj P-value | Log2FC | Malignancy |
| 84436 | ZNF528 | male-WTA | Human | Thyroid | PTC | 1.28e-08 | 1.22e-01 | 0.1037 |
| 84436 | ZNF528 | PTC03 | Human | Thyroid | PTC | 1.35e-04 | 1.75e-01 | 0.1784 |
| 84436 | ZNF528 | PTC04 | Human | Thyroid | PTC | 1.13e-11 | 1.57e-01 | 0.1927 |
| 84436 | ZNF528 | PTC05 | Human | Thyroid | PTC | 6.73e-21 | 5.44e-01 | 0.2065 |
| 84436 | ZNF528 | PTC06 | Human | Thyroid | PTC | 2.67e-27 | 4.81e-01 | 0.2057 |
| 84436 | ZNF528 | PTC07 | Human | Thyroid | PTC | 5.07e-25 | 4.29e-01 | 0.2044 |
| 84436 | ZNF528 | ATC09 | Human | Thyroid | ATC | 6.18e-03 | 1.35e-01 | 0.2871 |
| 84436 | ZNF528 | ATC12 | Human | Thyroid | ATC | 4.25e-14 | 2.26e-01 | 0.34 |
| 84436 | ZNF528 | ATC13 | Human | Thyroid | ATC | 2.76e-08 | 1.42e-01 | 0.34 |
| 84436 | ZNF528 | ATC1 | Human | Thyroid | ATC | 8.56e-03 | 1.48e-01 | 0.2878 |
| 84436 | ZNF528 | ATC4 | Human | Thyroid | ATC | 2.04e-17 | 3.11e-01 | 0.34 |
| 84436 | ZNF528 | ATC5 | Human | Thyroid | ATC | 5.88e-09 | 1.55e-01 | 0.34 |
| Page: 1 |
| Tissue | Expression Dynamics | Abbreviation |
| Thyroid | 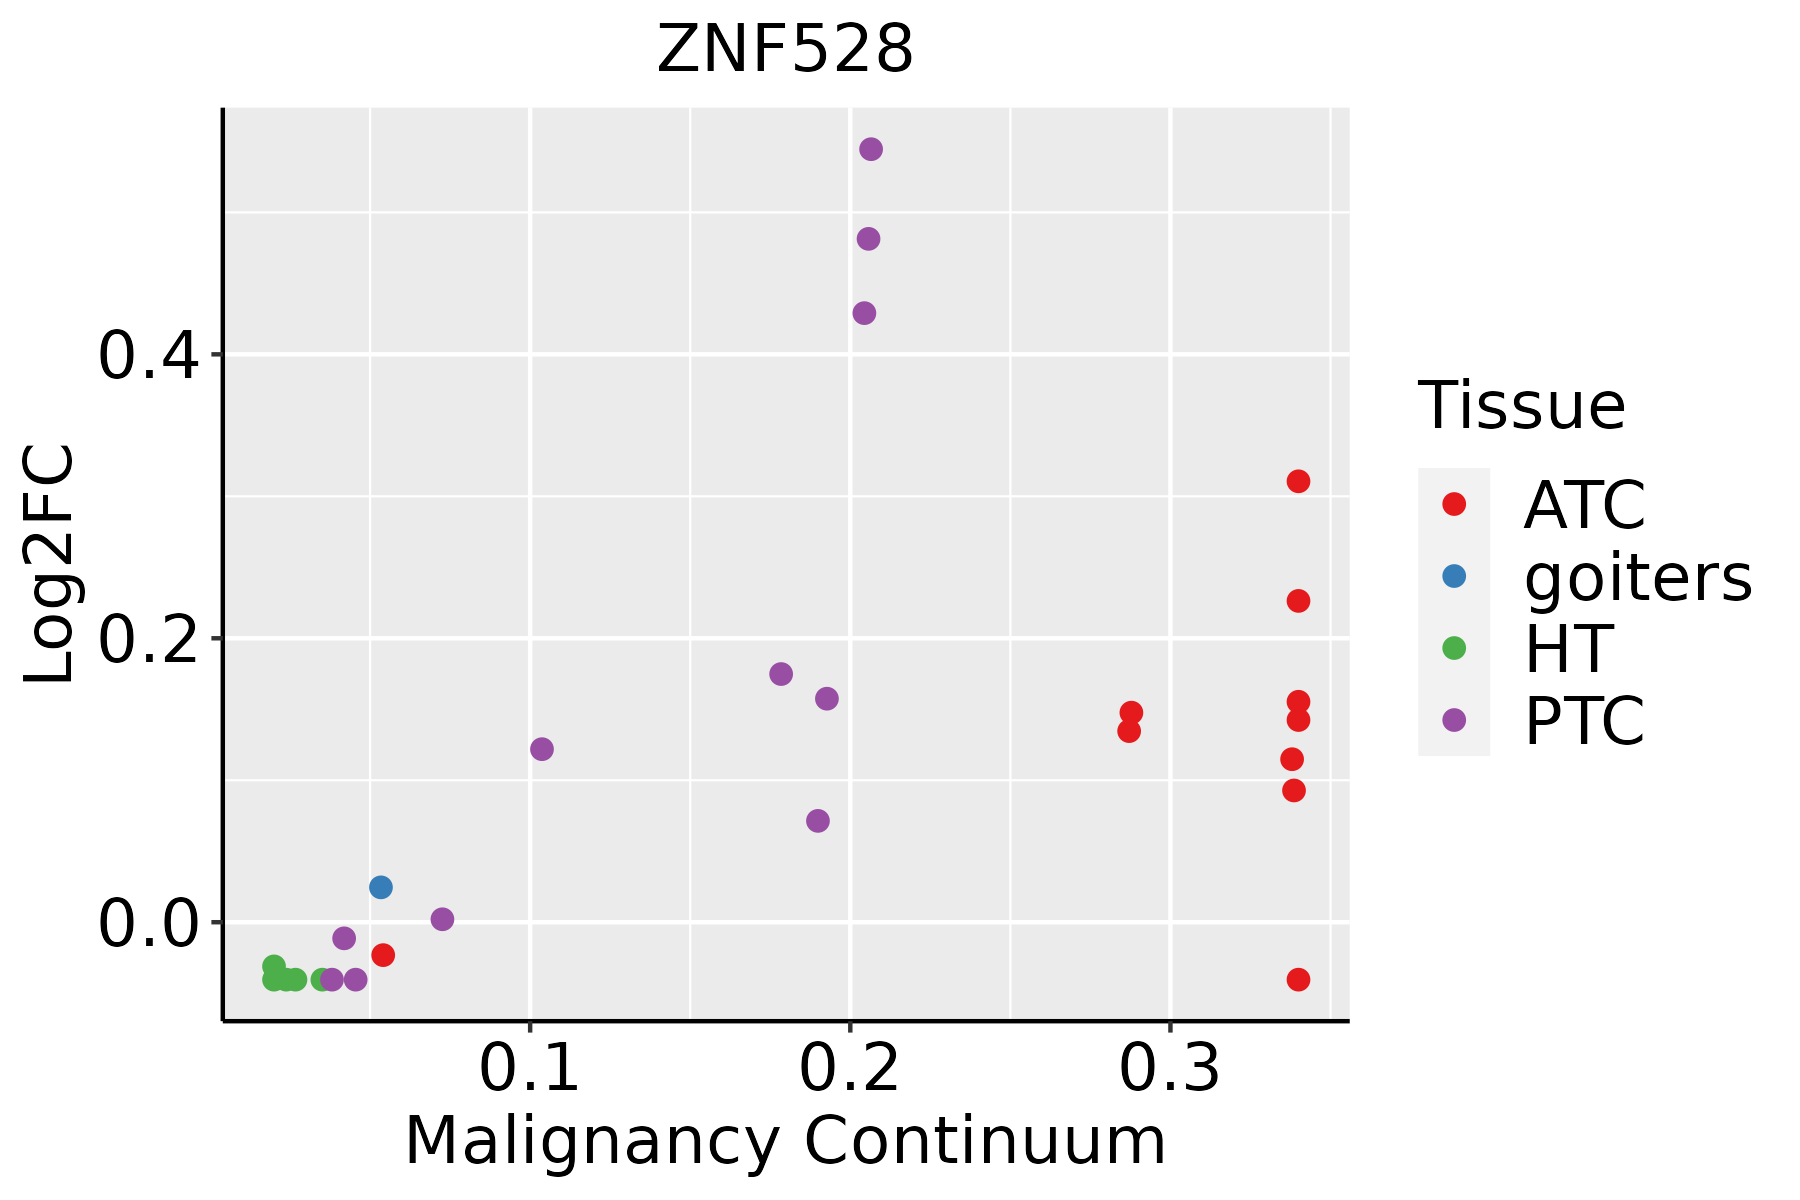 | ATC: Anaplastic thyroid cancer |
| HT: Hashimoto's thyroiditis | ||
| PTC: Papillary thyroid cancer |
| ∗log2FC in expression of this searched gene in stem-like cells from each diseased tissue sample relative to stem-like cells in normal samples in each tissue plotted against the malignancy continuum. Samples are colored based on if they are from different disease stage. |
Top |
Malignant transformation related pathway analysis |
| Find out the enriched GO biological processes and KEGG pathways involved in transition from healthy to precancer to cancer |
| Tissue | Disease Stage | Enriched GO biological Processes |
| Colorectum | AD |  |
| Colorectum | SER |  |
| Colorectum | MSS |  |
| Colorectum | MSI-H |  |
| Colorectum | FAP |  |
| ∗Top 15 enriched GO BP terms are showed in the bar plot of each disease state in each tissue. Each row represents a significant GO biological process which is colored according to the -log10(p.adjust). |
| Page: 1 2 3 4 5 6 7 8 9 |
| GO ID | Tissue | Disease Stage | Description | Gene Ratio | Bg Ratio | pvalue | p.adjust | Count |
| Page: 1 |
| Pathway ID | Tissue | Disease Stage | Description | Gene Ratio | Bg Ratio | pvalue | p.adjust | qvalue | Count |
| Page: 1 |
Top |
Cell-cell communication analysis |
| Identification of potential cell-cell interactions between two cell types and their ligand-receptor pairs for different disease states |
| Ligand | Receptor | LRpair | Pathway | Tissue | Disease Stage |
| Page: 1 |
Top |
Single-cell gene regulatory network inference analysis |
| Find out the significant the regulons (TFs) and the target genes of each regulon across cell types for different disease states |
| TF | Cell Type | Tissue | Disease Stage | Target Gene | RSS | Regulon Activity |
| ZNF528 | MSC | Breast | Healthy | ZNF282,IFI44L,TFF3, etc. | 5.94e-02 |  |
| ZNF528 | CD8TCM | Liver | Cirrhotic | SIGLEC14,SMCR5,CHD6, etc. | 5.69e-03 |  |
| ZNF528 | TH17 | Liver | Cirrhotic | SIGLEC14,SMCR5,CHD6, etc. | 0.00e+00 | |
| ZNF528 | CD8TEXINT | Liver | Cirrhotic | SIGLEC14,SMCR5,CHD6, etc. | 3.68e-04 | |
| ZNF528 | MAIT | Liver | HCC | SIGLEC14,SMCR5,CHD6, etc. | 7.00e-03 |  |
| ZNF528 | CD8TEREX | Liver | Healthy | SIGLEC14,SMCR5,CHD6, etc. | 1.02e-02 |  |
| ZNF528 | CILIA | Lung | IAC | RYR1,PIK3CD,SLC22A23, etc. | 3.49e-02 |  |
| ZNF528 | DUCT2 | Pancreas | ADJ | TMC8,ZNF286A,FTH1, etc. | 1.54e-02 |  |
| ZNF528 | PERI | Thyroid | ADJ | GTF3C2,TG,PDE9A, etc. | 2.43e-01 |  |
| ∗The dot plots of a searched regulon are shown for all cell subpopulations in each disease state of each tissue based on the regulon specific score inferred using pySCENIC and by calculating the average expression. |
| Page: 1 |
Top |
Somatic mutation of malignant transformation related genes |
| Annotation of somatic variants for genes involved in malignant transformation |
| Hugo Symbol | Variant Class | Variant Classification | dbSNP RS | HGVSc | HGVSp | HGVSp Short | SWISSPROT | BIOTYPE | SIFT | PolyPhen | Tumor Sample Barcode | Tissue | Histology | Sex | Age | Stage | Therapy Types | Drugs | Outcome |
| ZNF528 | SNV | Missense_Mutation | c.916T>G | p.Phe306Val | p.F306V | Q3MIS6 | protein_coding | deleterious(0) | probably_damaging(0.999) | TCGA-A1-A0SO-01 | Breast | breast invasive carcinoma | Female | >=65 | I/II | Chemotherapy | SD | ||
| ZNF528 | SNV | Missense_Mutation | c.273N>C | p.Glu91Asp | p.E91D | Q3MIS6 | protein_coding | tolerated(0.57) | benign(0.138) | TCGA-A2-A0T0-01 | Breast | breast invasive carcinoma | Female | <65 | I/II | Chemotherapy | taxotere | SD | |
| ZNF528 | SNV | Missense_Mutation | c.698N>T | p.Arg233Ile | p.R233I | Q3MIS6 | protein_coding | tolerated(0.09) | possibly_damaging(0.661) | TCGA-AN-A046-01 | Breast | breast invasive carcinoma | Female | >=65 | I/II | Unknown | Unknown | SD | |
| ZNF528 | SNV | Missense_Mutation | c.504N>A | p.Asp168Glu | p.D168E | Q3MIS6 | protein_coding | tolerated(0.39) | benign(0.294) | TCGA-AN-A0AK-01 | Breast | breast invasive carcinoma | Female | >=65 | I/II | Unknown | Unknown | SD | |
| ZNF528 | SNV | Missense_Mutation | c.1018N>G | p.Leu340Val | p.L340V | Q3MIS6 | protein_coding | deleterious(0) | probably_damaging(0.94) | TCGA-C8-A1HM-01 | Breast | breast invasive carcinoma | Female | >=65 | I/II | Chemotherapy | doxorubicin | CR | |
| ZNF528 | SNV | Missense_Mutation | rs751026840 | c.1178N>G | p.Lys393Arg | p.K393R | Q3MIS6 | protein_coding | tolerated(0.47) | benign(0.044) | TCGA-D8-A1XK-01 | Breast | breast invasive carcinoma | Female | <65 | I/II | Chemotherapy | doxorubicine+cyclophosphamide | SD |
| ZNF528 | SNV | Missense_Mutation | c.1396G>A | p.Glu466Lys | p.E466K | Q3MIS6 | protein_coding | tolerated(1) | benign(0.007) | TCGA-E2-A10C-01 | Breast | breast invasive carcinoma | Female | <65 | I/II | Chemotherapy | cytoxan | SD | |
| ZNF528 | SNV | Missense_Mutation | rs762923260 | c.424A>T | p.Asn142Tyr | p.N142Y | Q3MIS6 | protein_coding | tolerated(0.6) | benign(0.017) | TCGA-S3-AA10-01 | Breast | breast invasive carcinoma | Female | >=65 | I/II | Chemotherapy | cytoxan | CR |
| ZNF528 | SNV | Missense_Mutation | novel | c.1594N>G | p.Gln532Glu | p.Q532E | Q3MIS6 | protein_coding | tolerated(0.26) | benign(0.015) | TCGA-VS-A959-01 | Cervix | cervical & endocervical cancer | Female | >=65 | I/II | Unknown | Unknown | SD |
| ZNF528 | SNV | Missense_Mutation | c.88A>G | p.Arg30Gly | p.R30G | Q3MIS6 | protein_coding | deleterious(0) | probably_damaging(0.918) | TCGA-AA-3811-01 | Colorectum | colon adenocarcinoma | Female | >=65 | III/IV | Unknown | Unknown | PD |
| Page: 1 2 3 4 5 6 7 8 9 10 |
Top |
Related drugs of malignant transformation related genes |
| Identification of chemicals and drugs interact with genes involved in malignant transfromation |
| (DGIdb 4.0) |
| Entrez ID | Symbol | Category | Interaction Types | Drug Claim Name | Drug Name | PMIDs |
| Page: 1 |

Copyright 2023-Present -The University of Texas Health Science Center at Houston |