
|
|||||
|
 | |
| |
| |
| |
| |
| |
|
Gene: ZNF518A |
Gene summary for ZNF518A |
| Gene information | Species | Human | Gene symbol | ZNF518A | Gene ID | 9849 |
| Gene name | zinc finger protein 518A | |
| Gene Alias | ZNF518 | |
| Cytomap | 10q24.1 | |
| Gene Type | protein-coding | GO ID | GO:0006139 | UniProtAcc | Q6AHZ1 |
Top |
Malignant transformation analysis |
| Identification of the aberrant gene expression in precancerous and cancerous lesions by comparing the gene expression of stem-like cells in diseased tissues with normal stem cells |
| Entrez ID | Symbol | Replicates | Species | Organ | Tissue | Adj P-value | Log2FC | Malignancy |
| 9849 | ZNF518A | HTA11_3410_2000001011 | Human | Colorectum | AD | 4.11e-11 | -4.38e-01 | 0.0155 |
| 9849 | ZNF518A | HTA11_696_2000001011 | Human | Colorectum | AD | 7.02e-03 | -2.74e-01 | -0.1464 |
| 9849 | ZNF518A | HTA11_7862_2000001011 | Human | Colorectum | AD | 3.25e-02 | -4.76e-01 | -0.0179 |
| 9849 | ZNF518A | HTA11_866_3004761011 | Human | Colorectum | AD | 2.78e-03 | -3.07e-01 | 0.096 |
| 9849 | ZNF518A | HTA11_8622_2000001021 | Human | Colorectum | SER | 8.68e-04 | -4.64e-01 | 0.0528 |
| 9849 | ZNF518A | HTA11_10711_2000001011 | Human | Colorectum | AD | 4.55e-03 | -4.20e-01 | 0.0338 |
| 9849 | ZNF518A | HTA11_7696_3000711011 | Human | Colorectum | AD | 9.54e-07 | -3.68e-01 | 0.0674 |
| 9849 | ZNF518A | HTA11_99999965104_69814 | Human | Colorectum | MSS | 7.50e-04 | 5.94e-01 | 0.281 |
| 9849 | ZNF518A | HTA11_99999971662_82457 | Human | Colorectum | MSS | 2.63e-03 | -2.73e-01 | 0.3859 |
| 9849 | ZNF518A | HTA11_99999973899_84307 | Human | Colorectum | MSS | 1.87e-06 | -5.94e-01 | 0.2585 |
| 9849 | ZNF518A | HTA11_99999974143_84620 | Human | Colorectum | MSS | 8.28e-14 | -4.70e-01 | 0.3005 |
| 9849 | ZNF518A | A001-C-207 | Human | Colorectum | FAP | 9.49e-03 | -1.05e-01 | 0.1278 |
| 9849 | ZNF518A | A015-C-203 | Human | Colorectum | FAP | 1.54e-33 | -2.13e-01 | -0.1294 |
| 9849 | ZNF518A | A015-C-204 | Human | Colorectum | FAP | 6.92e-04 | 3.49e-02 | -0.0228 |
| 9849 | ZNF518A | A014-C-040 | Human | Colorectum | FAP | 6.81e-05 | -6.20e-02 | -0.1184 |
| 9849 | ZNF518A | A002-C-201 | Human | Colorectum | FAP | 9.12e-13 | -2.04e-01 | 0.0324 |
| 9849 | ZNF518A | A002-C-203 | Human | Colorectum | FAP | 5.51e-03 | 7.30e-02 | 0.2786 |
| 9849 | ZNF518A | A001-C-119 | Human | Colorectum | FAP | 7.41e-12 | -4.31e-01 | -0.1557 |
| 9849 | ZNF518A | A001-C-108 | Human | Colorectum | FAP | 2.77e-19 | 6.34e-02 | -0.0272 |
| 9849 | ZNF518A | A002-C-205 | Human | Colorectum | FAP | 5.03e-24 | -4.09e-01 | -0.1236 |
| Page: 1 2 3 4 5 6 |
| Tissue | Expression Dynamics | Abbreviation |
| Colorectum (GSE201348) |  | FAP: Familial adenomatous polyposis |
| CRC: Colorectal cancer | ||
| Colorectum (HTA11) | 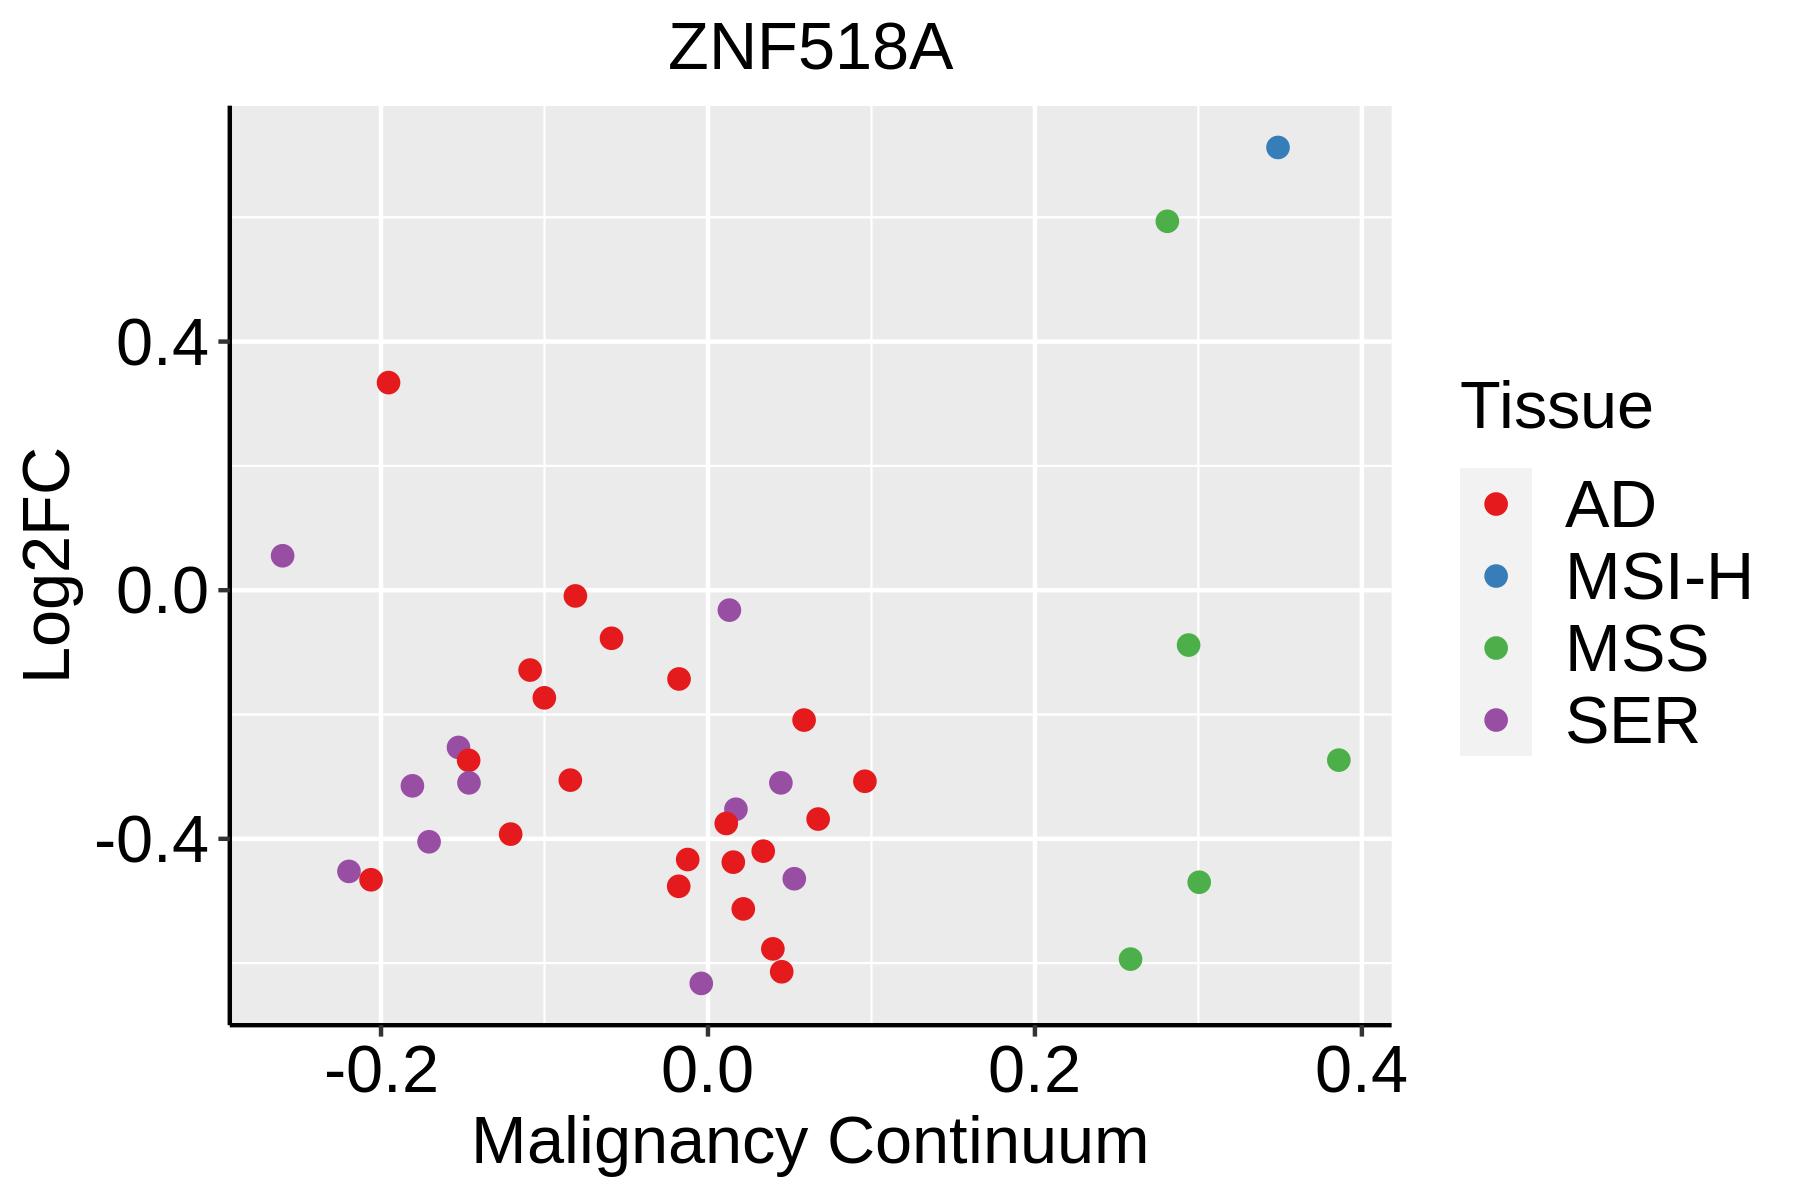 | AD: Adenomas |
| SER: Sessile serrated lesions | ||
| MSI-H: Microsatellite-high colorectal cancer | ||
| MSS: Microsatellite stable colorectal cancer | ||
| Esophagus | 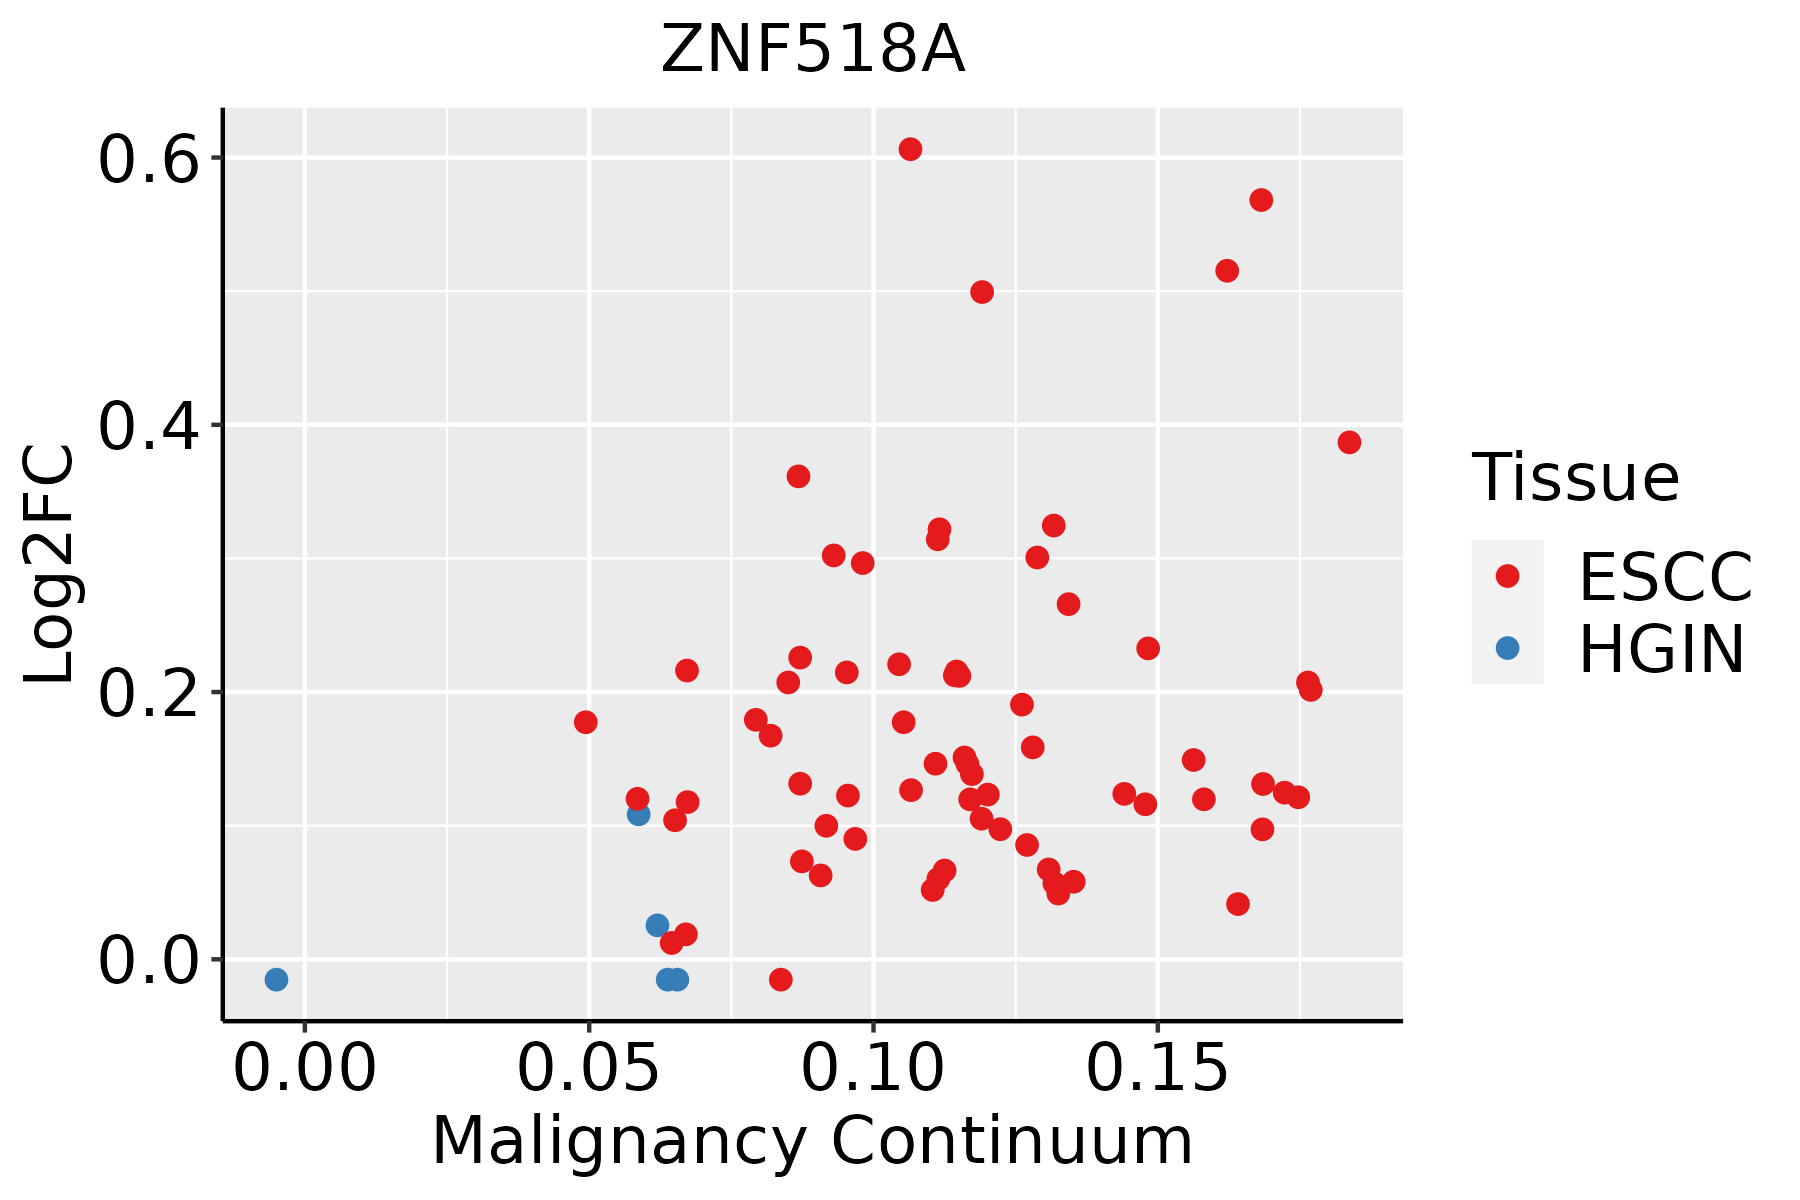 | ESCC: Esophageal squamous cell carcinoma |
| HGIN: High-grade intraepithelial neoplasias | ||
| LGIN: Low-grade intraepithelial neoplasias | ||
| Liver | 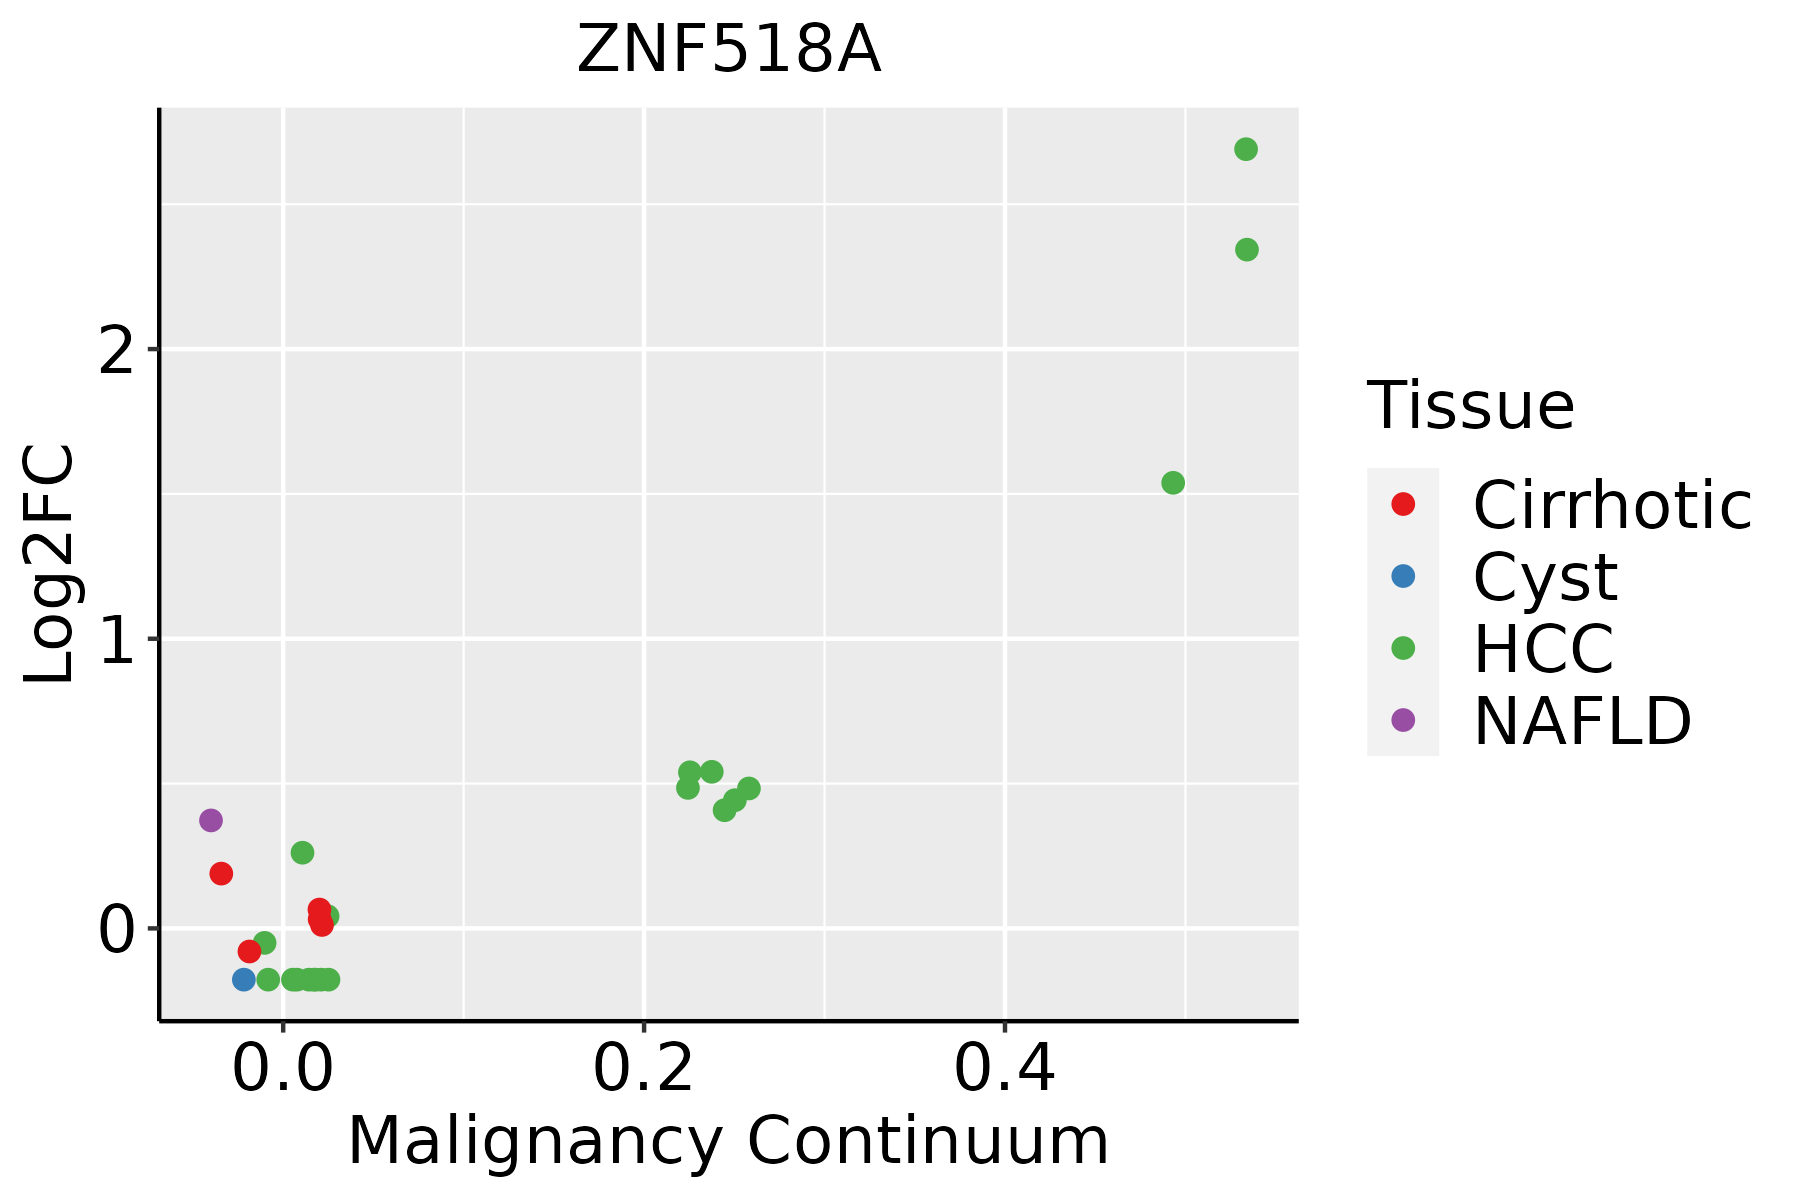 | HCC: Hepatocellular carcinoma |
| NAFLD: Non-alcoholic fatty liver disease | ||
| Thyroid | 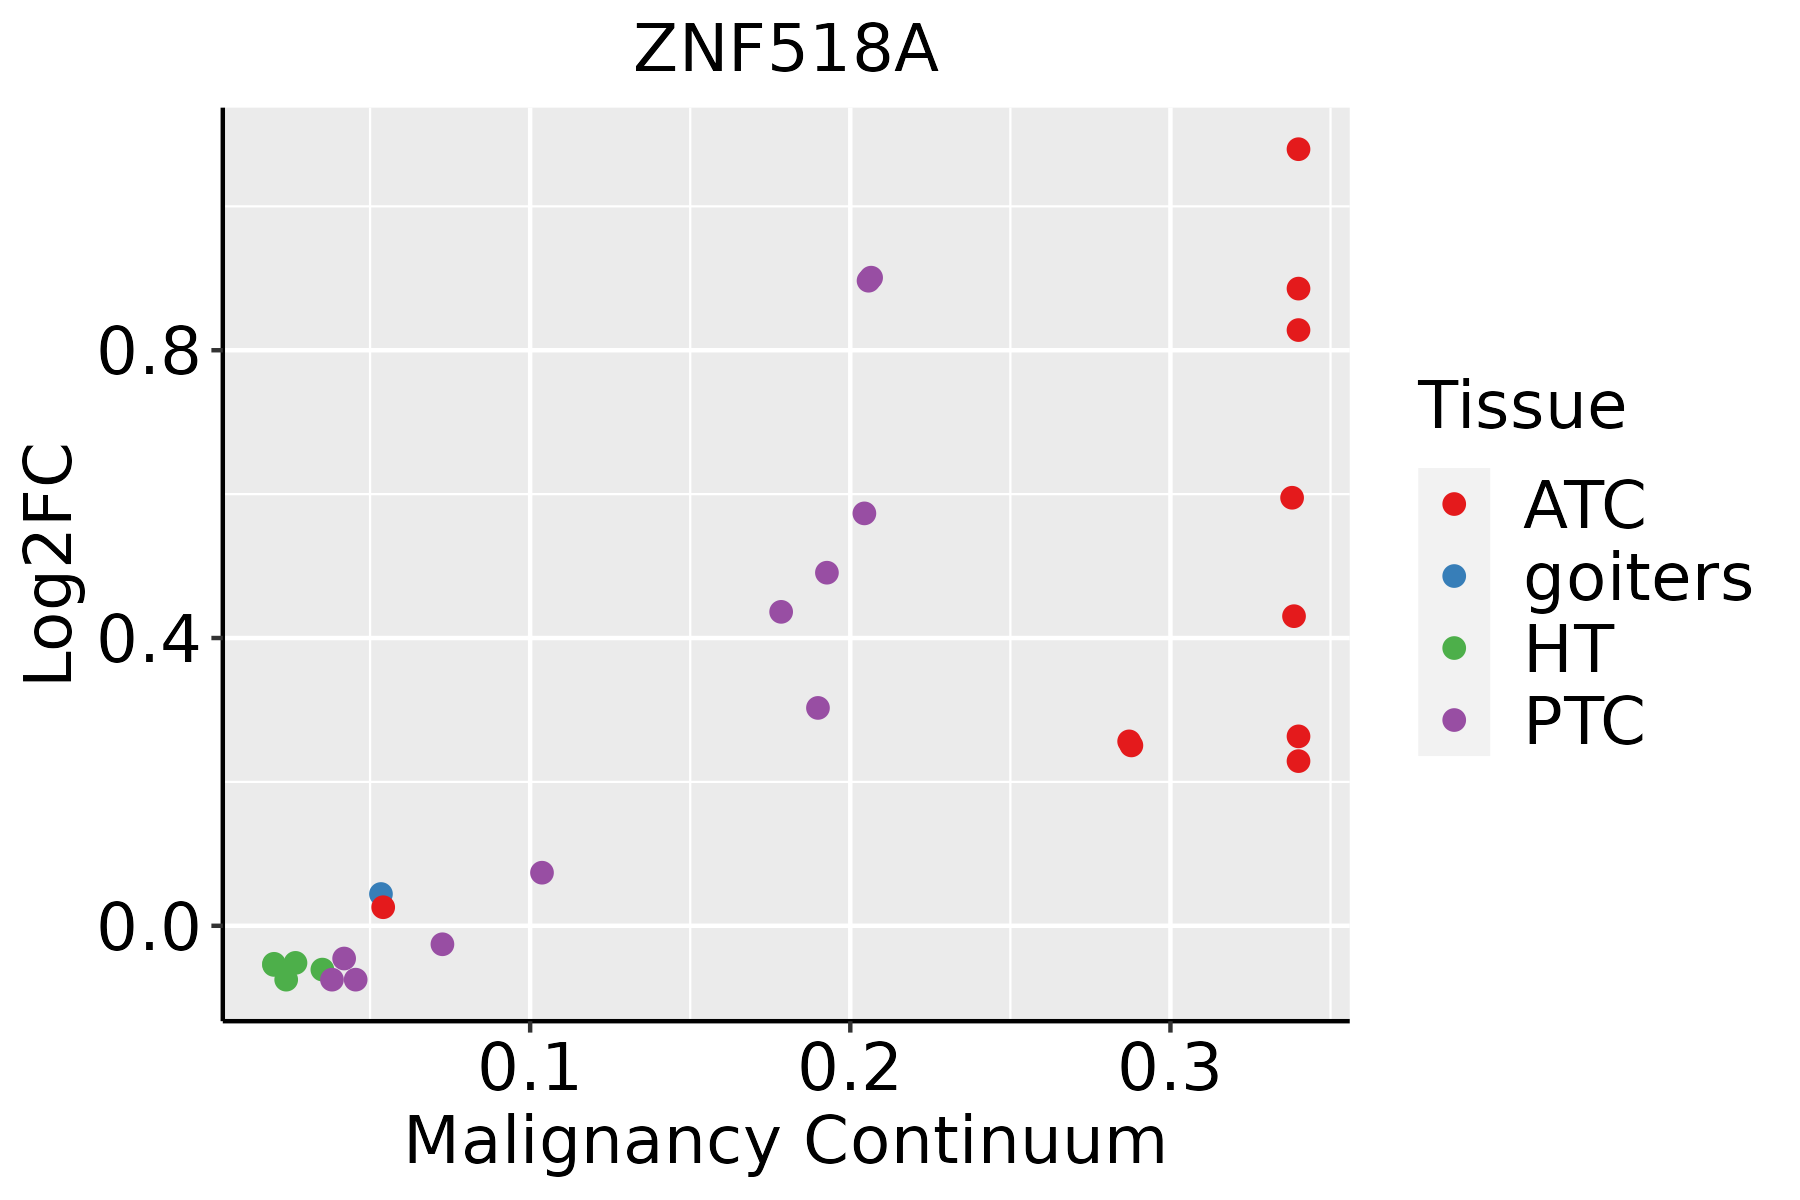 | ATC: Anaplastic thyroid cancer |
| HT: Hashimoto's thyroiditis | ||
| PTC: Papillary thyroid cancer |
| ∗log2FC in expression of this searched gene in stem-like cells from each diseased tissue sample relative to stem-like cells in normal samples in each tissue plotted against the malignancy continuum. Samples are colored based on if they are from different disease stage. |
Top |
Malignant transformation related pathway analysis |
| Find out the enriched GO biological processes and KEGG pathways involved in transition from healthy to precancer to cancer |
| Tissue | Disease Stage | Enriched GO biological Processes |
| Colorectum | AD |  |
| Colorectum | SER |  |
| Colorectum | MSS |  |
| Colorectum | MSI-H |  |
| Colorectum | FAP |  |
| ∗Top 15 enriched GO BP terms are showed in the bar plot of each disease state in each tissue. Each row represents a significant GO biological process which is colored according to the -log10(p.adjust). |
| Page: 1 2 3 4 5 6 7 8 9 |
| GO ID | Tissue | Disease Stage | Description | Gene Ratio | Bg Ratio | pvalue | p.adjust | Count |
| GO:0006325 | Colorectum | AD | chromatin organization | 119/3918 | 409/18723 | 4.85e-05 | 8.33e-04 | 119 |
| GO:00063251 | Colorectum | SER | chromatin organization | 89/2897 | 409/18723 | 4.15e-04 | 6.17e-03 | 89 |
| GO:00063252 | Colorectum | MSS | chromatin organization | 107/3467 | 409/18723 | 7.22e-05 | 1.21e-03 | 107 |
| GO:00063253 | Colorectum | FAP | chromatin organization | 84/2622 | 409/18723 | 1.62e-04 | 2.47e-03 | 84 |
| GO:00063254 | Colorectum | CRC | chromatin organization | 74/2078 | 409/18723 | 1.48e-05 | 4.61e-04 | 74 |
| GO:000632517 | Esophagus | ESCC | chromatin organization | 240/8552 | 409/18723 | 6.52e-08 | 1.14e-06 | 240 |
| GO:00063255 | Liver | NAFLD | chromatin organization | 64/1882 | 409/18723 | 2.31e-04 | 3.89e-03 | 64 |
| GO:000632511 | Liver | HCC | chromatin organization | 206/7958 | 409/18723 | 7.23e-04 | 4.41e-03 | 206 |
| GO:000632520 | Thyroid | PTC | chromatin organization | 183/5968 | 409/18723 | 2.55e-08 | 5.70e-07 | 183 |
| GO:0006325110 | Thyroid | ATC | chromatin organization | 189/6293 | 409/18723 | 6.40e-08 | 1.13e-06 | 189 |
| Page: 1 |
| Pathway ID | Tissue | Disease Stage | Description | Gene Ratio | Bg Ratio | pvalue | p.adjust | qvalue | Count |
| Page: 1 |
Top |
Cell-cell communication analysis |
| Identification of potential cell-cell interactions between two cell types and their ligand-receptor pairs for different disease states |
| Ligand | Receptor | LRpair | Pathway | Tissue | Disease Stage |
| Page: 1 |
Top |
Single-cell gene regulatory network inference analysis |
| Find out the significant the regulons (TFs) and the target genes of each regulon across cell types for different disease states |
| TF | Cell Type | Tissue | Disease Stage | Target Gene | RSS | Regulon Activity |
| ∗The dot plots of a searched regulon are shown for all cell subpopulations in each disease state of each tissue based on the regulon specific score inferred using pySCENIC and by calculating the average expression. |
| Page: 1 |
Top |
Somatic mutation of malignant transformation related genes |
| Annotation of somatic variants for genes involved in malignant transformation |
| Hugo Symbol | Variant Class | Variant Classification | dbSNP RS | HGVSc | HGVSp | HGVSp Short | SWISSPROT | BIOTYPE | SIFT | PolyPhen | Tumor Sample Barcode | Tissue | Histology | Sex | Age | Stage | Therapy Types | Drugs | Outcome |
| ZNF518A | SNV | Missense_Mutation | novel | c.2080N>A | p.Asp694Asn | p.D694N | Q6AHZ1 | protein_coding | tolerated(0.21) | benign(0.142) | TCGA-A1-A0SI-01 | Breast | breast invasive carcinoma | Female | <65 | I/II | Unknown | Unknown | SD |
| ZNF518A | SNV | Missense_Mutation | novel | c.1036C>G | p.Gln346Glu | p.Q346E | Q6AHZ1 | protein_coding | tolerated(0.13) | benign(0.007) | TCGA-BH-A0HK-01 | Breast | breast invasive carcinoma | Female | >=65 | I/II | Hormone Therapy | arimidex | SD |
| ZNF518A | SNV | Missense_Mutation | novel | c.861N>C | p.Glu287Asp | p.E287D | Q6AHZ1 | protein_coding | tolerated(1) | benign(0.037) | TCGA-D8-A1XQ-01 | Breast | breast invasive carcinoma | Female | >=65 | I/II | Unknown | Unknown | SD |
| ZNF518A | SNV | Missense_Mutation | novel | c.1347N>A | p.Met449Ile | p.M449I | Q6AHZ1 | protein_coding | tolerated(0.08) | benign(0.048) | TCGA-EW-A1OZ-01 | Breast | breast invasive carcinoma | Female | <65 | I/II | Targeted Molecular therapy | trastuzumab | SD |
| ZNF518A | insertion | Frame_Shift_Ins | novel | c.2649_2650insTTTGGCACATTACTTAAGACTCAGCAATATTCTTTGTGGTGTTCCTTCAGGTTTC | p.Ser892GlnfsTer16 | p.S892Qfs*16 | Q6AHZ1 | protein_coding | TCGA-A8-A08S-01 | Breast | breast invasive carcinoma | Female | >=65 | I/II | Hormone Therapy | anastrozole | SD | ||
| ZNF518A | deletion | Frame_Shift_Del | novel | c.1660_1667delTCAGCAAC | p.Ser554IlefsTer15 | p.S554Ifs*15 | Q6AHZ1 | protein_coding | TCGA-D8-A1XM-01 | Breast | breast invasive carcinoma | Female | <65 | I/II | Unknown | Unknown | SD | ||
| ZNF518A | deletion | Frame_Shift_Del | novel | c.1841delA | p.Asp614ValfsTer32 | p.D614Vfs*32 | Q6AHZ1 | protein_coding | TCGA-D8-A27V-01 | Breast | breast invasive carcinoma | Female | <65 | I/II | Hormone Therapy | tamoxiphen | SD | ||
| ZNF518A | SNV | Missense_Mutation | rs377406617 | c.374G>A | p.Arg125Gln | p.R125Q | Q6AHZ1 | protein_coding | tolerated(0.55) | benign(0.003) | TCGA-2W-A8YY-01 | Cervix | cervical & endocervical cancer | Female | <65 | I/II | Chemotherapy | cisplatin | CR |
| ZNF518A | SNV | Missense_Mutation | rs587636864 | c.1679T>C | p.Val560Ala | p.V560A | Q6AHZ1 | protein_coding | tolerated(0.6) | benign(0.001) | TCGA-2W-A8YY-01 | Cervix | cervical & endocervical cancer | Female | <65 | I/II | Chemotherapy | cisplatin | CR |
| ZNF518A | SNV | Missense_Mutation | novel | c.2173G>A | p.Gly725Arg | p.G725R | Q6AHZ1 | protein_coding | tolerated(0.53) | benign(0.235) | TCGA-2W-A8YY-01 | Cervix | cervical & endocervical cancer | Female | <65 | I/II | Chemotherapy | cisplatin | CR |
| Page: 1 2 3 4 5 6 7 8 9 10 11 12 13 14 15 |
Top |
Related drugs of malignant transformation related genes |
| Identification of chemicals and drugs interact with genes involved in malignant transfromation |
| (DGIdb 4.0) |
| Entrez ID | Symbol | Category | Interaction Types | Drug Claim Name | Drug Name | PMIDs |
| Page: 1 |

Copyright 2023-Present -The University of Texas Health Science Center at Houston |