
|
|||||
|
 | |
| |
| |
| |
| |
| |
|
Gene: ZNF516 |
Gene summary for ZNF516 |
| Gene information | Species | Human | Gene symbol | ZNF516 | Gene ID | 9658 |
| Gene name | zinc finger protein 516 | |
| Gene Alias | HsT287 | |
| Cytomap | 18q23 | |
| Gene Type | protein-coding | GO ID | GO:0001659 | UniProtAcc | Q2YDX2 |
Top |
Malignant transformation analysis |
| Identification of the aberrant gene expression in precancerous and cancerous lesions by comparing the gene expression of stem-like cells in diseased tissues with normal stem cells |
| Entrez ID | Symbol | Replicates | Species | Organ | Tissue | Adj P-value | Log2FC | Malignancy |
| 9658 | ZNF516 | CCI_3 | Human | Cervix | CC | 2.30e-09 | 6.11e-01 | 0.516 |
| 9658 | ZNF516 | HTA11_3410_2000001011 | Human | Colorectum | AD | 4.68e-12 | -4.54e-01 | 0.0155 |
| 9658 | ZNF516 | HTA11_2487_2000001011 | Human | Colorectum | SER | 1.70e-04 | -3.68e-01 | -0.1808 |
| 9658 | ZNF516 | HTA11_1938_2000001011 | Human | Colorectum | AD | 8.14e-03 | -3.06e-01 | -0.0811 |
| 9658 | ZNF516 | HTA11_347_2000001011 | Human | Colorectum | AD | 6.31e-05 | -1.87e-01 | -0.1954 |
| 9658 | ZNF516 | HTA11_3361_2000001011 | Human | Colorectum | AD | 4.18e-04 | -4.41e-01 | -0.1207 |
| 9658 | ZNF516 | HTA11_696_2000001011 | Human | Colorectum | AD | 2.94e-09 | -3.77e-01 | -0.1464 |
| 9658 | ZNF516 | HTA11_866_2000001011 | Human | Colorectum | AD | 6.37e-08 | -3.68e-01 | -0.1001 |
| 9658 | ZNF516 | HTA11_1391_2000001011 | Human | Colorectum | AD | 9.77e-07 | -2.84e-01 | -0.059 |
| 9658 | ZNF516 | HTA11_866_3004761011 | Human | Colorectum | AD | 8.08e-09 | -4.15e-01 | 0.096 |
| 9658 | ZNF516 | HTA11_7696_3000711011 | Human | Colorectum | AD | 1.99e-09 | -4.08e-01 | 0.0674 |
| 9658 | ZNF516 | HTA11_99999970781_79442 | Human | Colorectum | MSS | 1.27e-08 | -3.41e-01 | 0.294 |
| 9658 | ZNF516 | HTA11_99999971662_82457 | Human | Colorectum | MSS | 1.84e-08 | -3.88e-01 | 0.3859 |
| 9658 | ZNF516 | HTA11_99999974143_84620 | Human | Colorectum | MSS | 8.85e-12 | -4.33e-01 | 0.3005 |
| 9658 | ZNF516 | A015-C-203 | Human | Colorectum | FAP | 5.68e-17 | -2.78e-01 | -0.1294 |
| 9658 | ZNF516 | A002-C-201 | Human | Colorectum | FAP | 7.83e-08 | -3.22e-01 | 0.0324 |
| 9658 | ZNF516 | A002-C-203 | Human | Colorectum | FAP | 7.64e-04 | -1.86e-01 | 0.2786 |
| 9658 | ZNF516 | A001-C-119 | Human | Colorectum | FAP | 1.07e-04 | -3.52e-01 | -0.1557 |
| 9658 | ZNF516 | A001-C-108 | Human | Colorectum | FAP | 5.00e-15 | -3.36e-01 | -0.0272 |
| 9658 | ZNF516 | A002-C-205 | Human | Colorectum | FAP | 3.70e-13 | -3.85e-01 | -0.1236 |
| Page: 1 2 3 4 |
| Tissue | Expression Dynamics | Abbreviation |
| Cervix | 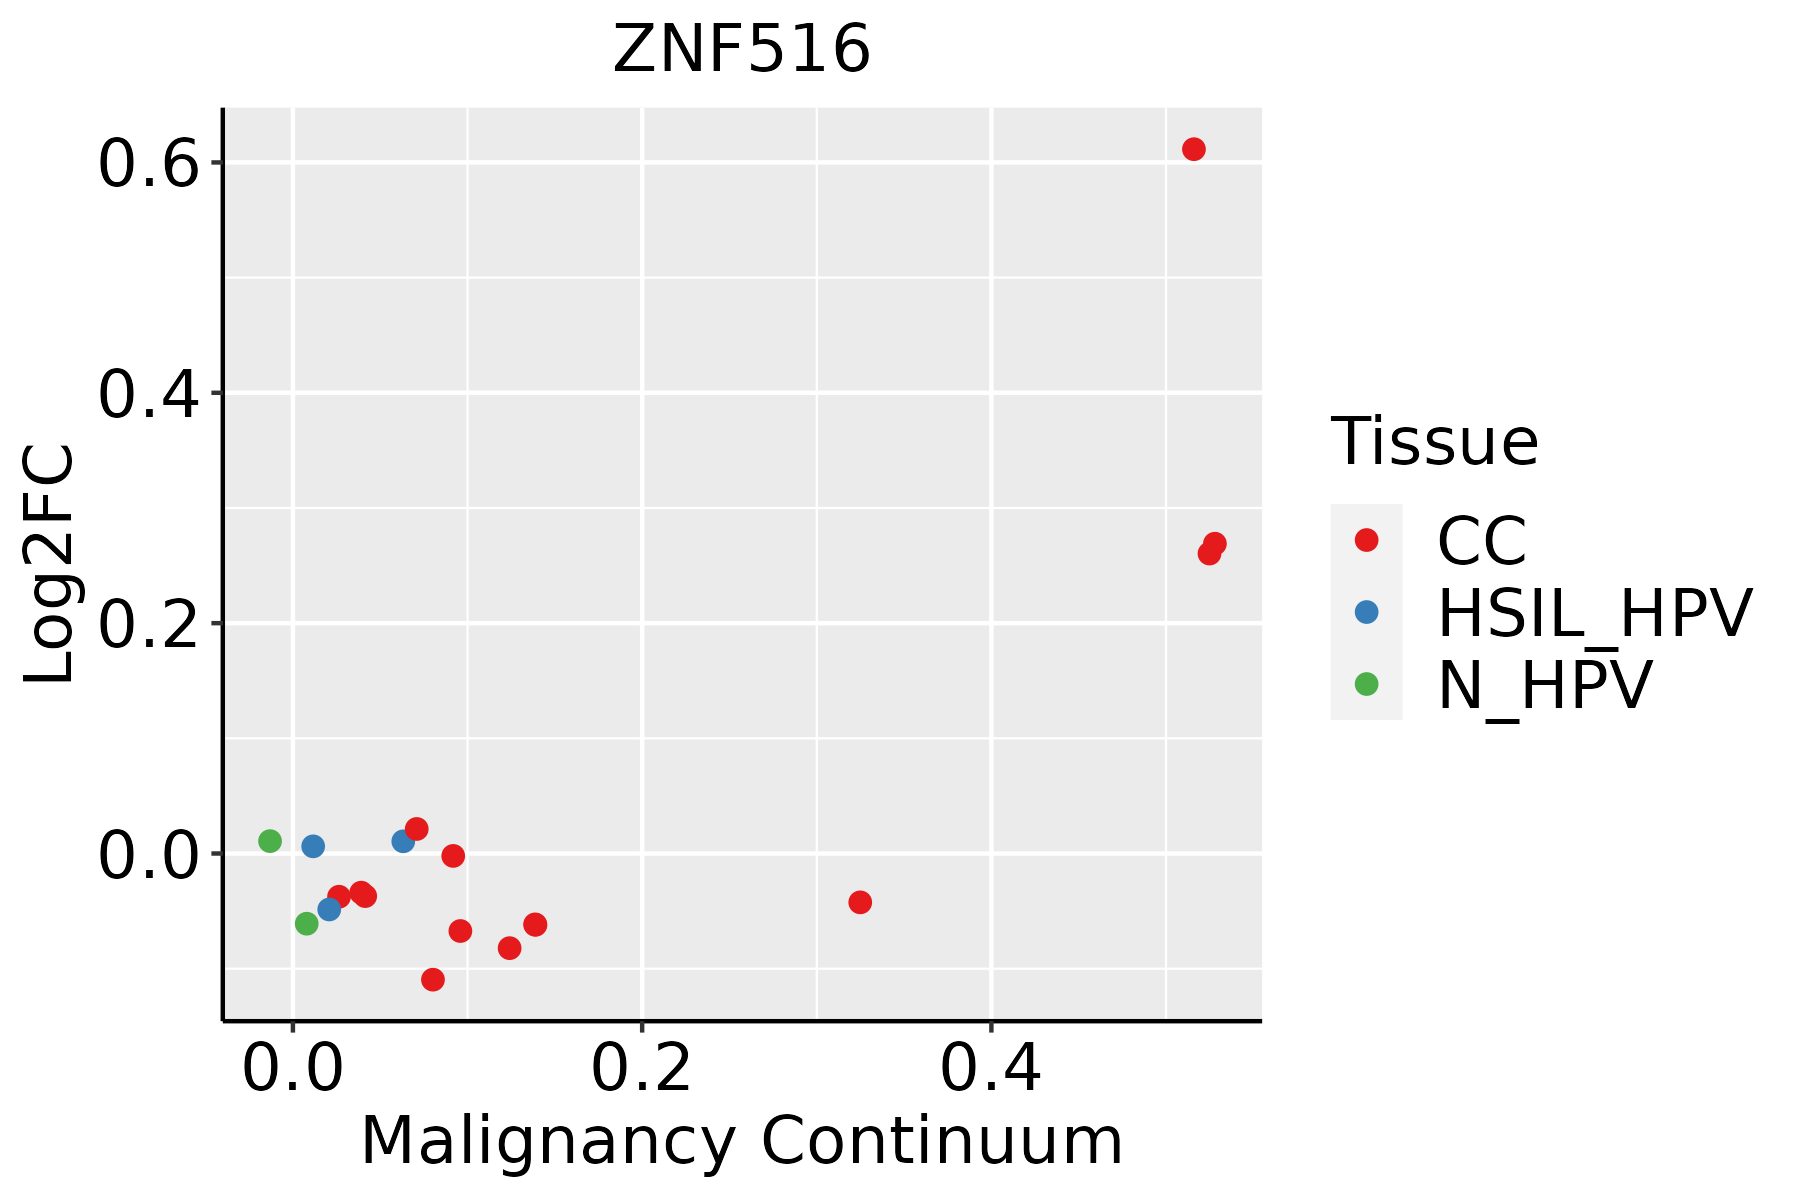 | CC: Cervix cancer |
| HSIL_HPV: HPV-infected high-grade squamous intraepithelial lesions | ||
| N_HPV: HPV-infected normal cervix | ||
| Colorectum (GSE201348) |  | FAP: Familial adenomatous polyposis |
| CRC: Colorectal cancer | ||
| Colorectum (HTA11) | 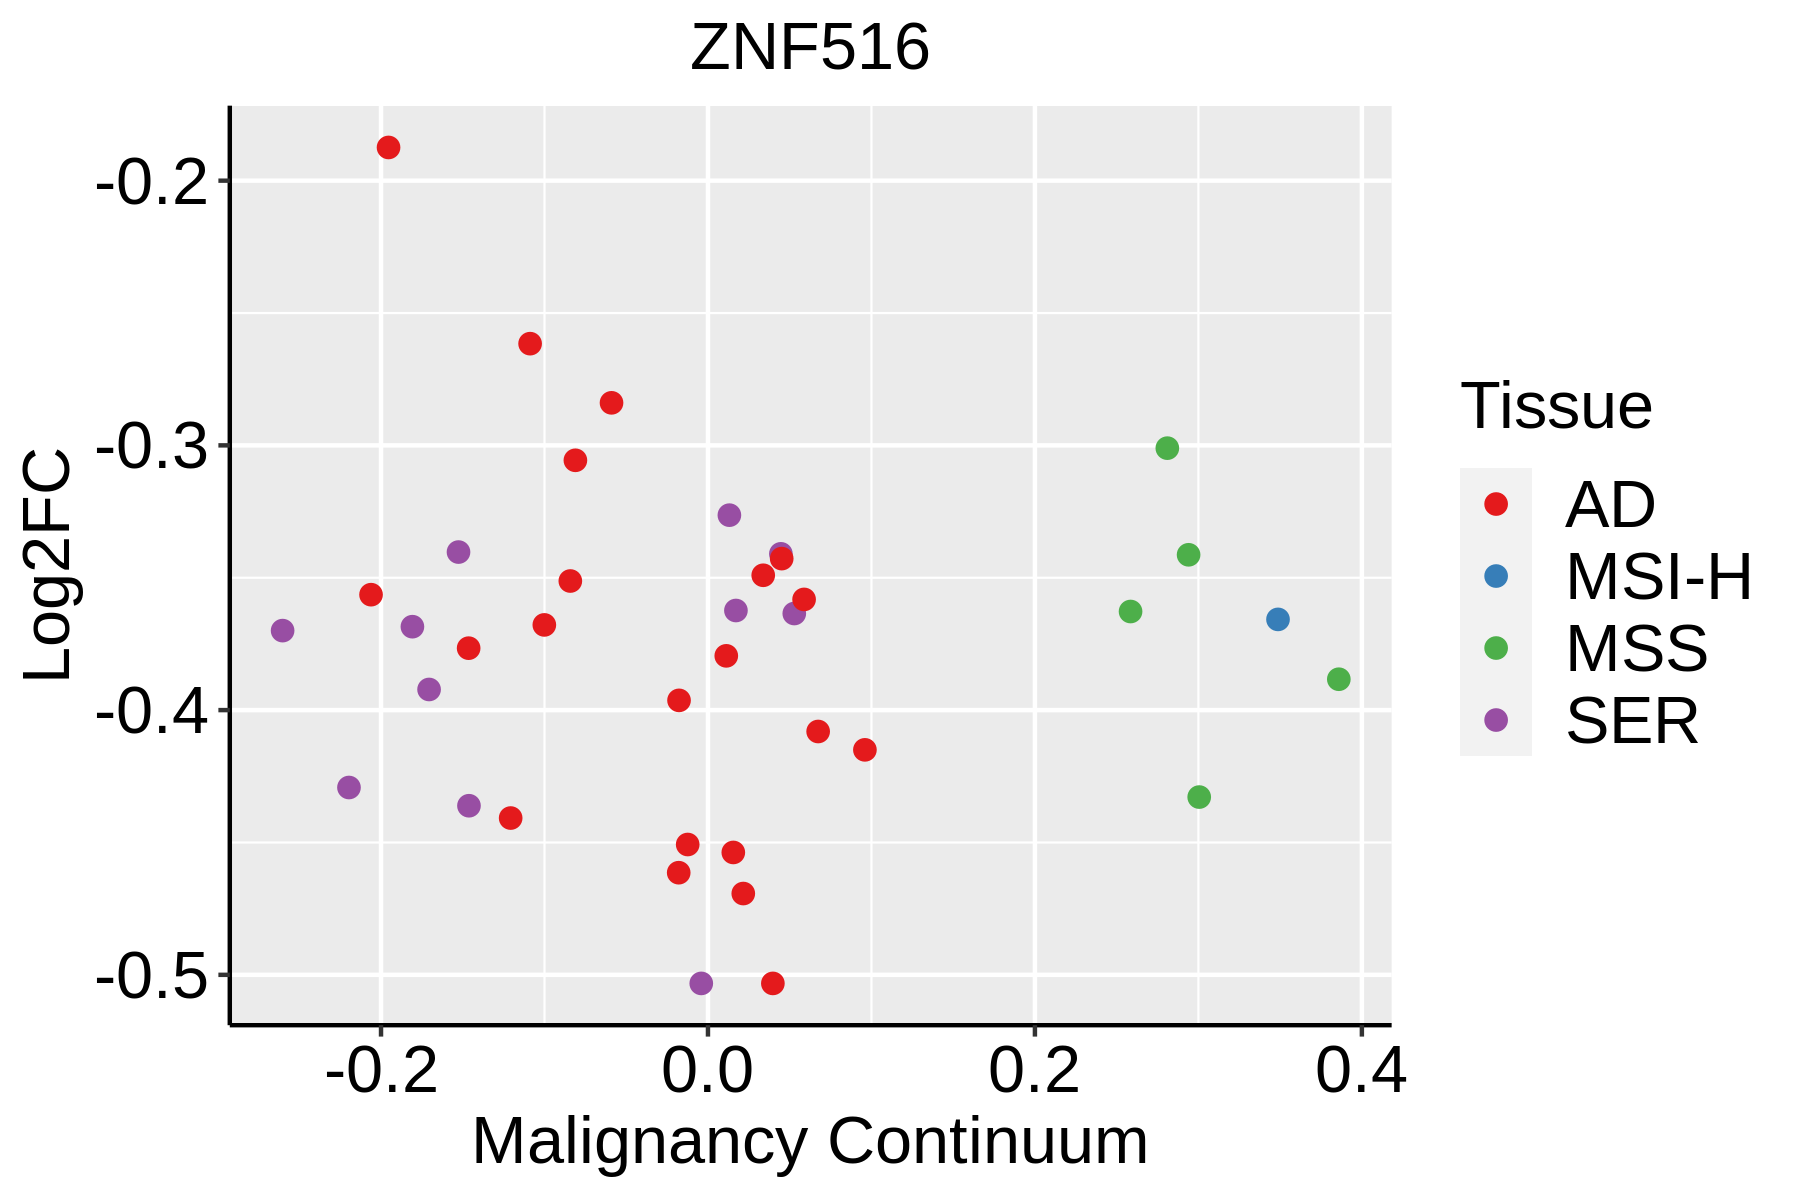 | AD: Adenomas |
| SER: Sessile serrated lesions | ||
| MSI-H: Microsatellite-high colorectal cancer | ||
| MSS: Microsatellite stable colorectal cancer | ||
| Endometrium | 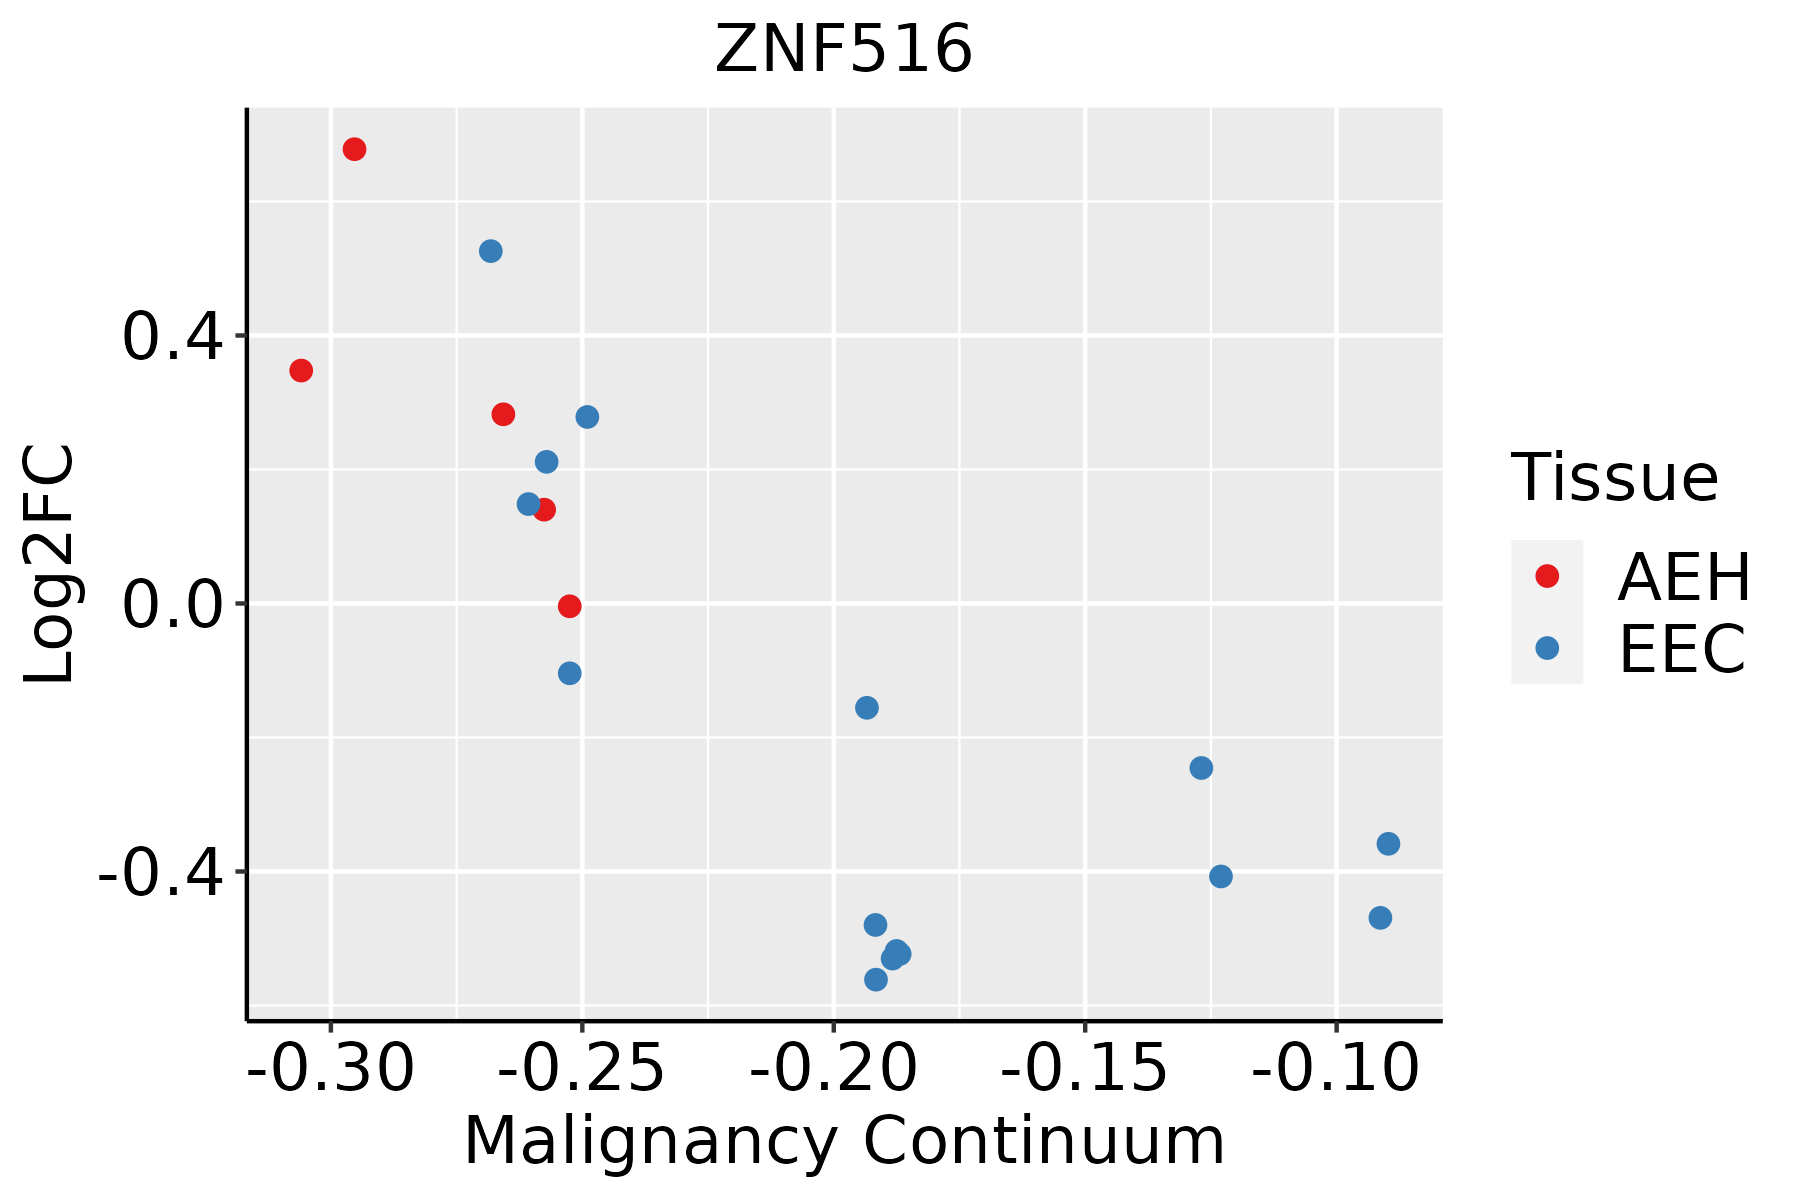 | AEH: Atypical endometrial hyperplasia |
| EEC: Endometrioid Cancer | ||
| Liver | 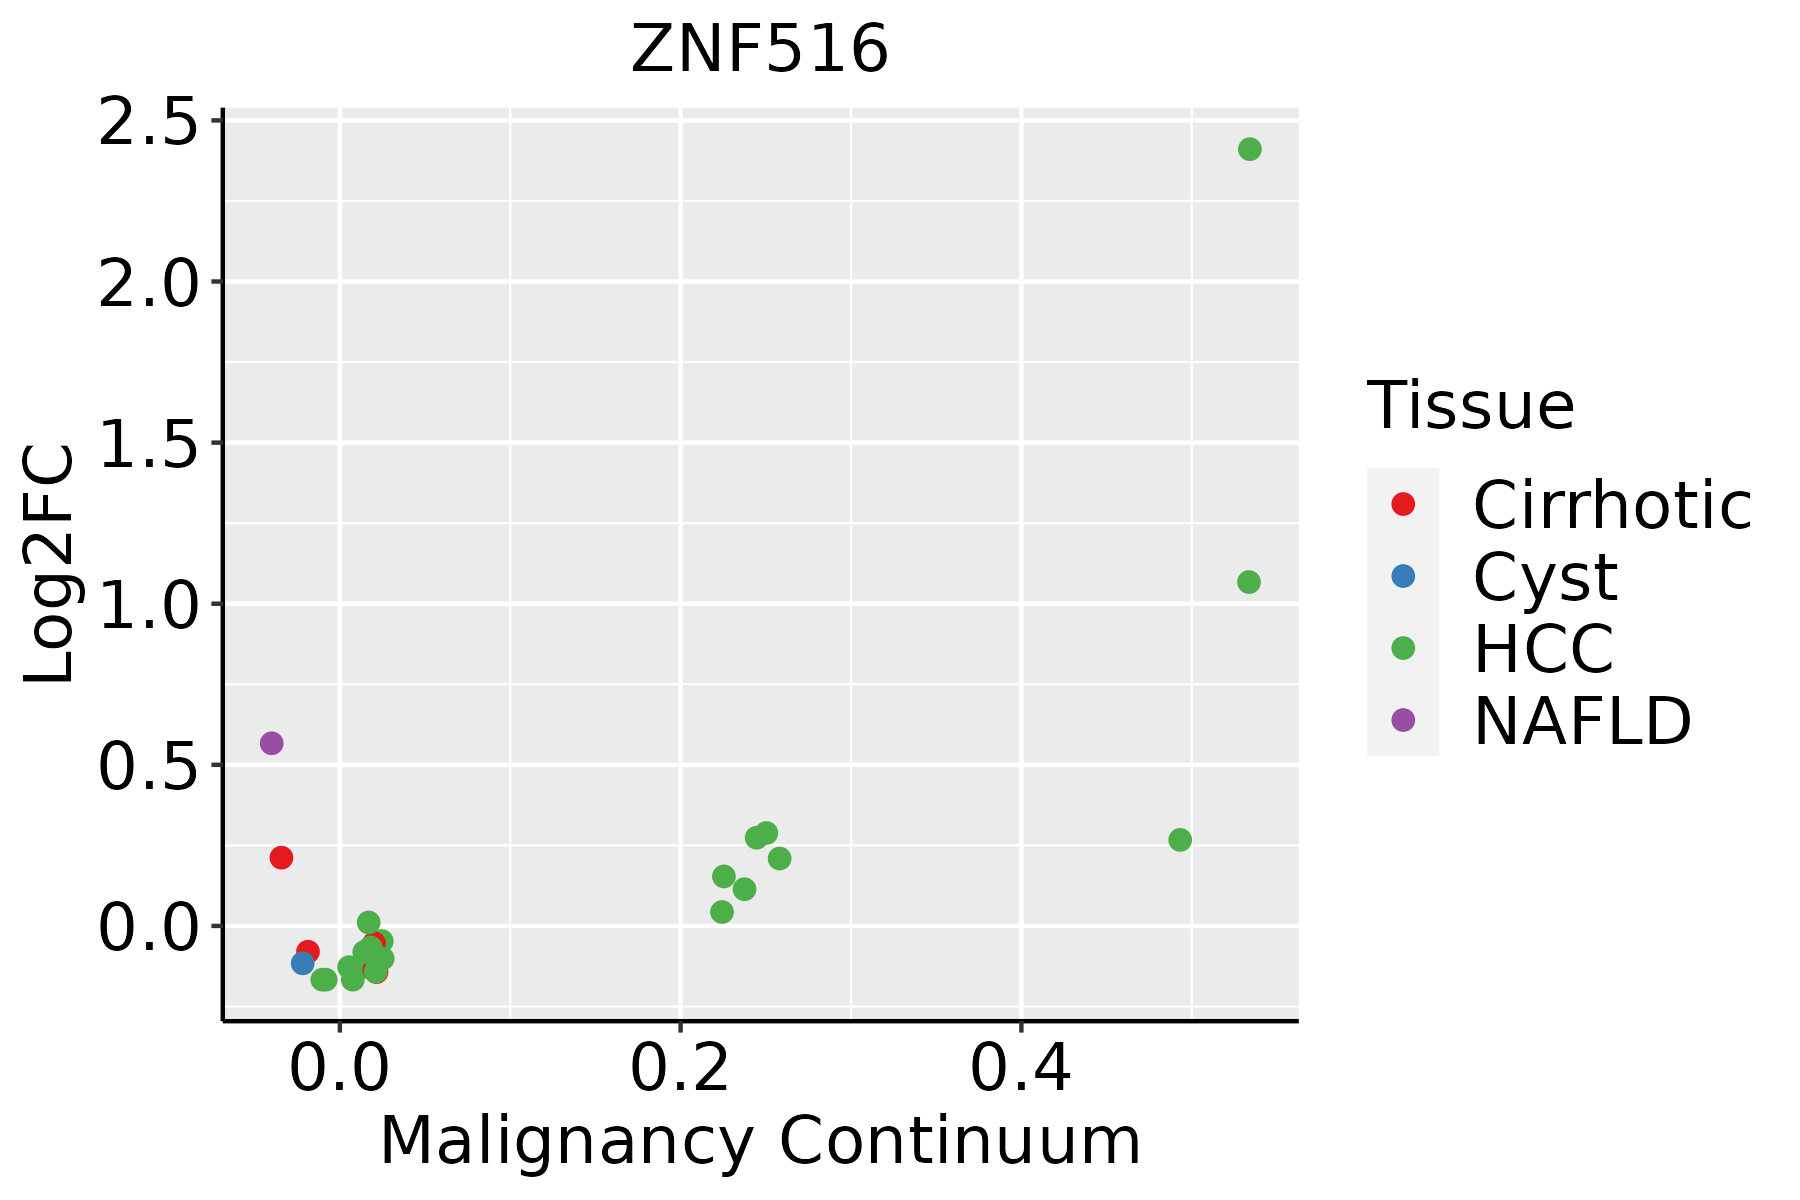 | HCC: Hepatocellular carcinoma |
| NAFLD: Non-alcoholic fatty liver disease |
| ∗log2FC in expression of this searched gene in stem-like cells from each diseased tissue sample relative to stem-like cells in normal samples in each tissue plotted against the malignancy continuum. Samples are colored based on if they are from different disease stage. |
Top |
Malignant transformation related pathway analysis |
| Find out the enriched GO biological processes and KEGG pathways involved in transition from healthy to precancer to cancer |
| Tissue | Disease Stage | Enriched GO biological Processes |
| Colorectum | AD |  |
| Colorectum | SER |  |
| Colorectum | MSS |  |
| Colorectum | MSI-H |  |
| Colorectum | FAP |  |
| ∗Top 15 enriched GO BP terms are showed in the bar plot of each disease state in each tissue. Each row represents a significant GO biological process which is colored according to the -log10(p.adjust). |
| Page: 1 2 3 4 5 6 7 8 9 |
| GO ID | Tissue | Disease Stage | Description | Gene Ratio | Bg Ratio | pvalue | p.adjust | Count |
| GO:00454445 | Cervix | CC | fat cell differentiation | 53/2311 | 229/18723 | 3.72e-06 | 9.75e-05 | 53 |
| GO:00092668 | Cervix | CC | response to temperature stimulus | 37/2311 | 178/18723 | 9.45e-04 | 7.95e-03 | 37 |
| GO:00094098 | Cervix | CC | response to cold | 13/2311 | 49/18723 | 5.34e-03 | 3.10e-02 | 13 |
| GO:0050873 | Cervix | CC | brown fat cell differentiation | 13/2311 | 50/18723 | 6.42e-03 | 3.58e-02 | 13 |
| GO:0009409 | Colorectum | AD | response to cold | 22/3918 | 49/18723 | 1.40e-04 | 1.98e-03 | 22 |
| GO:0120162 | Colorectum | AD | positive regulation of cold-induced thermogenesis | 32/3918 | 97/18723 | 3.74e-03 | 2.63e-02 | 32 |
| GO:0106106 | Colorectum | AD | cold-induced thermogenesis | 43/3918 | 144/18723 | 7.05e-03 | 4.31e-02 | 43 |
| GO:0120161 | Colorectum | AD | regulation of cold-induced thermogenesis | 43/3918 | 144/18723 | 7.05e-03 | 4.31e-02 | 43 |
| GO:1990845 | Colorectum | AD | adaptive thermogenesis | 46/3918 | 157/18723 | 7.97e-03 | 4.73e-02 | 46 |
| GO:00094091 | Colorectum | SER | response to cold | 16/2897 | 49/18723 | 2.11e-03 | 2.06e-02 | 16 |
| GO:0045444 | Colorectum | SER | fat cell differentiation | 51/2897 | 229/18723 | 3.96e-03 | 3.26e-02 | 51 |
| GO:00094092 | Colorectum | MSS | response to cold | 19/3467 | 49/18723 | 7.20e-04 | 7.70e-03 | 19 |
| GO:0001659 | Colorectum | FAP | temperature homeostasis | 38/2622 | 174/18723 | 3.16e-03 | 2.36e-02 | 38 |
| GO:01061061 | Colorectum | FAP | cold-induced thermogenesis | 32/2622 | 144/18723 | 4.85e-03 | 3.25e-02 | 32 |
| GO:01201611 | Colorectum | FAP | regulation of cold-induced thermogenesis | 32/2622 | 144/18723 | 4.85e-03 | 3.25e-02 | 32 |
| GO:19908451 | Colorectum | FAP | adaptive thermogenesis | 34/2622 | 157/18723 | 5.77e-03 | 3.69e-02 | 34 |
| GO:00094093 | Colorectum | FAP | response to cold | 14/2622 | 49/18723 | 5.95e-03 | 3.75e-02 | 14 |
| GO:01201621 | Colorectum | FAP | positive regulation of cold-induced thermogenesis | 23/2622 | 97/18723 | 6.95e-03 | 4.26e-02 | 23 |
| GO:0061448 | Endometrium | AEH | connective tissue development | 44/2100 | 252/18723 | 1.92e-03 | 1.51e-02 | 44 |
| GO:00092669 | Endometrium | AEH | response to temperature stimulus | 33/2100 | 178/18723 | 2.53e-03 | 1.87e-02 | 33 |
| Page: 1 2 |
| Pathway ID | Tissue | Disease Stage | Description | Gene Ratio | Bg Ratio | pvalue | p.adjust | qvalue | Count |
| hsa04714 | Colorectum | AD | Thermogenesis | 120/2092 | 232/8465 | 2.76e-19 | 1.16e-17 | 7.37e-18 | 120 |
| hsa047141 | Colorectum | AD | Thermogenesis | 120/2092 | 232/8465 | 2.76e-19 | 1.16e-17 | 7.37e-18 | 120 |
| hsa047142 | Colorectum | SER | Thermogenesis | 106/1580 | 232/8465 | 1.15e-21 | 6.34e-20 | 4.61e-20 | 106 |
| hsa047143 | Colorectum | SER | Thermogenesis | 106/1580 | 232/8465 | 1.15e-21 | 6.34e-20 | 4.61e-20 | 106 |
| hsa047144 | Colorectum | MSS | Thermogenesis | 113/1875 | 232/8465 | 1.52e-19 | 4.62e-18 | 2.83e-18 | 113 |
| hsa047145 | Colorectum | MSS | Thermogenesis | 113/1875 | 232/8465 | 1.52e-19 | 4.62e-18 | 2.83e-18 | 113 |
| hsa047148 | Colorectum | FAP | Thermogenesis | 70/1404 | 232/8465 | 1.38e-07 | 3.08e-06 | 1.87e-06 | 70 |
| hsa047149 | Colorectum | FAP | Thermogenesis | 70/1404 | 232/8465 | 1.38e-07 | 3.08e-06 | 1.87e-06 | 70 |
| hsa0471426 | Endometrium | AEH | Thermogenesis | 85/1197 | 232/8465 | 3.44e-18 | 9.33e-17 | 6.83e-17 | 85 |
| hsa04714111 | Endometrium | AEH | Thermogenesis | 85/1197 | 232/8465 | 3.44e-18 | 9.33e-17 | 6.83e-17 | 85 |
| hsa0471427 | Endometrium | EEC | Thermogenesis | 85/1237 | 232/8465 | 2.79e-17 | 7.05e-16 | 5.26e-16 | 85 |
| hsa0471436 | Endometrium | EEC | Thermogenesis | 85/1237 | 232/8465 | 2.79e-17 | 7.05e-16 | 5.26e-16 | 85 |
| hsa0471422 | Liver | HCC | Thermogenesis | 170/4020 | 232/8465 | 5.36e-16 | 2.25e-14 | 1.25e-14 | 170 |
| hsa0471432 | Liver | HCC | Thermogenesis | 170/4020 | 232/8465 | 5.36e-16 | 2.25e-14 | 1.25e-14 | 170 |
| Page: 1 |
Top |
Cell-cell communication analysis |
| Identification of potential cell-cell interactions between two cell types and their ligand-receptor pairs for different disease states |
| Ligand | Receptor | LRpair | Pathway | Tissue | Disease Stage |
| Page: 1 |
Top |
Single-cell gene regulatory network inference analysis |
| Find out the significant the regulons (TFs) and the target genes of each regulon across cell types for different disease states |
| TF | Cell Type | Tissue | Disease Stage | Target Gene | RSS | Regulon Activity |
| ZNF516 | BMEM | Liver | HCC | MTMR11,FXYD6,CCSER1, etc. | 5.84e-02 |  |
| ∗The dot plots of a searched regulon are shown for all cell subpopulations in each disease state of each tissue based on the regulon specific score inferred using pySCENIC and by calculating the average expression. |
| Page: 1 |
Top |
Somatic mutation of malignant transformation related genes |
| Annotation of somatic variants for genes involved in malignant transformation |
| Hugo Symbol | Variant Class | Variant Classification | dbSNP RS | HGVSc | HGVSp | HGVSp Short | SWISSPROT | BIOTYPE | SIFT | PolyPhen | Tumor Sample Barcode | Tissue | Histology | Sex | Age | Stage | Therapy Types | Drugs | Outcome |
| ZNF516 | SNV | Missense_Mutation | novel | c.743T>G | p.Phe248Cys | p.F248C | Q92618 | protein_coding | deleterious(0) | probably_damaging(0.999) | TCGA-AN-A0FX-01 | Breast | breast invasive carcinoma | Female | <65 | I/II | Unknown | Unknown | SD |
| ZNF516 | SNV | Missense_Mutation | novel | c.742T>G | p.Phe248Val | p.F248V | Q92618 | protein_coding | deleterious(0) | probably_damaging(0.998) | TCGA-AN-A0FX-01 | Breast | breast invasive carcinoma | Female | <65 | I/II | Unknown | Unknown | SD |
| ZNF516 | SNV | Missense_Mutation | c.2414N>T | p.Ser805Ile | p.S805I | Q92618 | protein_coding | deleterious(0) | benign(0.289) | TCGA-BH-A0E0-01 | Breast | breast invasive carcinoma | Female | <65 | III/IV | Chemotherapy | docetaxel | SD | |
| ZNF516 | SNV | Missense_Mutation | rs367746354 | c.1130N>T | p.Ser377Leu | p.S377L | Q92618 | protein_coding | tolerated(0.29) | benign(0) | TCGA-EW-A6SA-01 | Breast | breast invasive carcinoma | Male | <65 | I/II | Unknown | Unknown | SD |
| ZNF516 | SNV | Missense_Mutation | c.343G>A | p.Ala115Thr | p.A115T | Q92618 | protein_coding | tolerated(1) | benign(0.005) | TCGA-UL-AAZ6-01 | Breast | breast invasive carcinoma | Female | >=65 | I/II | Chemotherapy | herceptin | SD | |
| ZNF516 | deletion | Frame_Shift_Del | novel | c.2323delN | p.Leu775CysfsTer200 | p.L775Cfs*200 | Q92618 | protein_coding | TCGA-EW-A2FV-01 | Breast | breast invasive carcinoma | Female | <65 | III/IV | Chemotherapy | docetaxel | SD | ||
| ZNF516 | SNV | Missense_Mutation | rs754048310 | c.2641N>A | p.Gly881Ser | p.G881S | Q92618 | protein_coding | tolerated(0.17) | benign(0.019) | TCGA-2W-A8YY-01 | Cervix | cervical & endocervical cancer | Female | <65 | I/II | Chemotherapy | cisplatin | CR |
| ZNF516 | SNV | Missense_Mutation | rs538603150 | c.1939N>A | p.Ala647Thr | p.A647T | Q92618 | protein_coding | tolerated(0.53) | benign(0.007) | TCGA-2W-A8YY-01 | Cervix | cervical & endocervical cancer | Female | <65 | I/II | Chemotherapy | cisplatin | CR |
| ZNF516 | SNV | Missense_Mutation | c.711N>C | p.Glu237Asp | p.E237D | Q92618 | protein_coding | deleterious(0.03) | possibly_damaging(0.698) | TCGA-DG-A2KK-01 | Cervix | cervical & endocervical cancer | Female | <65 | III/IV | Chemotherapy | cisplatin | SD | |
| ZNF516 | SNV | Missense_Mutation | rs754048310 | c.2641G>A | p.Gly881Ser | p.G881S | Q92618 | protein_coding | tolerated(0.17) | benign(0.019) | TCGA-VS-A8EG-01 | Cervix | cervical & endocervical cancer | Female | <65 | I/II | Unknown | Unknown | SD |
| Page: 1 2 3 4 5 6 7 8 9 10 11 12 13 |
Top |
Related drugs of malignant transformation related genes |
| Identification of chemicals and drugs interact with genes involved in malignant transfromation |
| (DGIdb 4.0) |
| Entrez ID | Symbol | Category | Interaction Types | Drug Claim Name | Drug Name | PMIDs |
| Page: 1 |

Copyright 2023-Present -The University of Texas Health Science Center at Houston |