
|
|||||
|
 | |
| |
| |
| |
| |
| |
|
Gene: ZNF493 |
Gene summary for ZNF493 |
| Gene information | Species | Human | Gene symbol | ZNF493 | Gene ID | 284443 |
| Gene name | zinc finger protein 493 | |
| Gene Alias | ZNF493 | |
| Cytomap | 19p12 | |
| Gene Type | protein-coding | GO ID | GO:0006139 | UniProtAcc | Q6ZR52 |
Top |
Malignant transformation analysis |
| Identification of the aberrant gene expression in precancerous and cancerous lesions by comparing the gene expression of stem-like cells in diseased tissues with normal stem cells |
| Entrez ID | Symbol | Replicates | Species | Organ | Tissue | Adj P-value | Log2FC | Malignancy |
| 284443 | ZNF493 | male-WTA | Human | Thyroid | PTC | 2.09e-16 | -4.44e-02 | 0.1037 |
| 284443 | ZNF493 | PTC01 | Human | Thyroid | PTC | 2.71e-11 | 7.36e-02 | 0.1899 |
| 284443 | ZNF493 | PTC03 | Human | Thyroid | PTC | 2.88e-04 | 1.92e-01 | 0.1784 |
| 284443 | ZNF493 | PTC04 | Human | Thyroid | PTC | 9.90e-15 | 2.55e-01 | 0.1927 |
| 284443 | ZNF493 | PTC05 | Human | Thyroid | PTC | 4.72e-17 | 7.37e-01 | 0.2065 |
| 284443 | ZNF493 | PTC06 | Human | Thyroid | PTC | 1.29e-14 | 4.79e-01 | 0.2057 |
| 284443 | ZNF493 | PTC07 | Human | Thyroid | PTC | 4.63e-23 | 2.40e-01 | 0.2044 |
| 284443 | ZNF493 | ATC11 | Human | Thyroid | ATC | 1.68e-02 | 9.62e-02 | 0.3386 |
| 284443 | ZNF493 | ATC12 | Human | Thyroid | ATC | 3.35e-10 | -4.37e-02 | 0.34 |
| 284443 | ZNF493 | ATC13 | Human | Thyroid | ATC | 6.30e-19 | 3.42e-01 | 0.34 |
| 284443 | ZNF493 | ATC3 | Human | Thyroid | ATC | 2.39e-04 | 9.79e-02 | 0.338 |
| 284443 | ZNF493 | ATC4 | Human | Thyroid | ATC | 5.96e-06 | -1.85e-02 | 0.34 |
| 284443 | ZNF493 | ATC5 | Human | Thyroid | ATC | 3.59e-22 | 3.84e-01 | 0.34 |
| Page: 1 |
| Tissue | Expression Dynamics | Abbreviation |
| Thyroid | 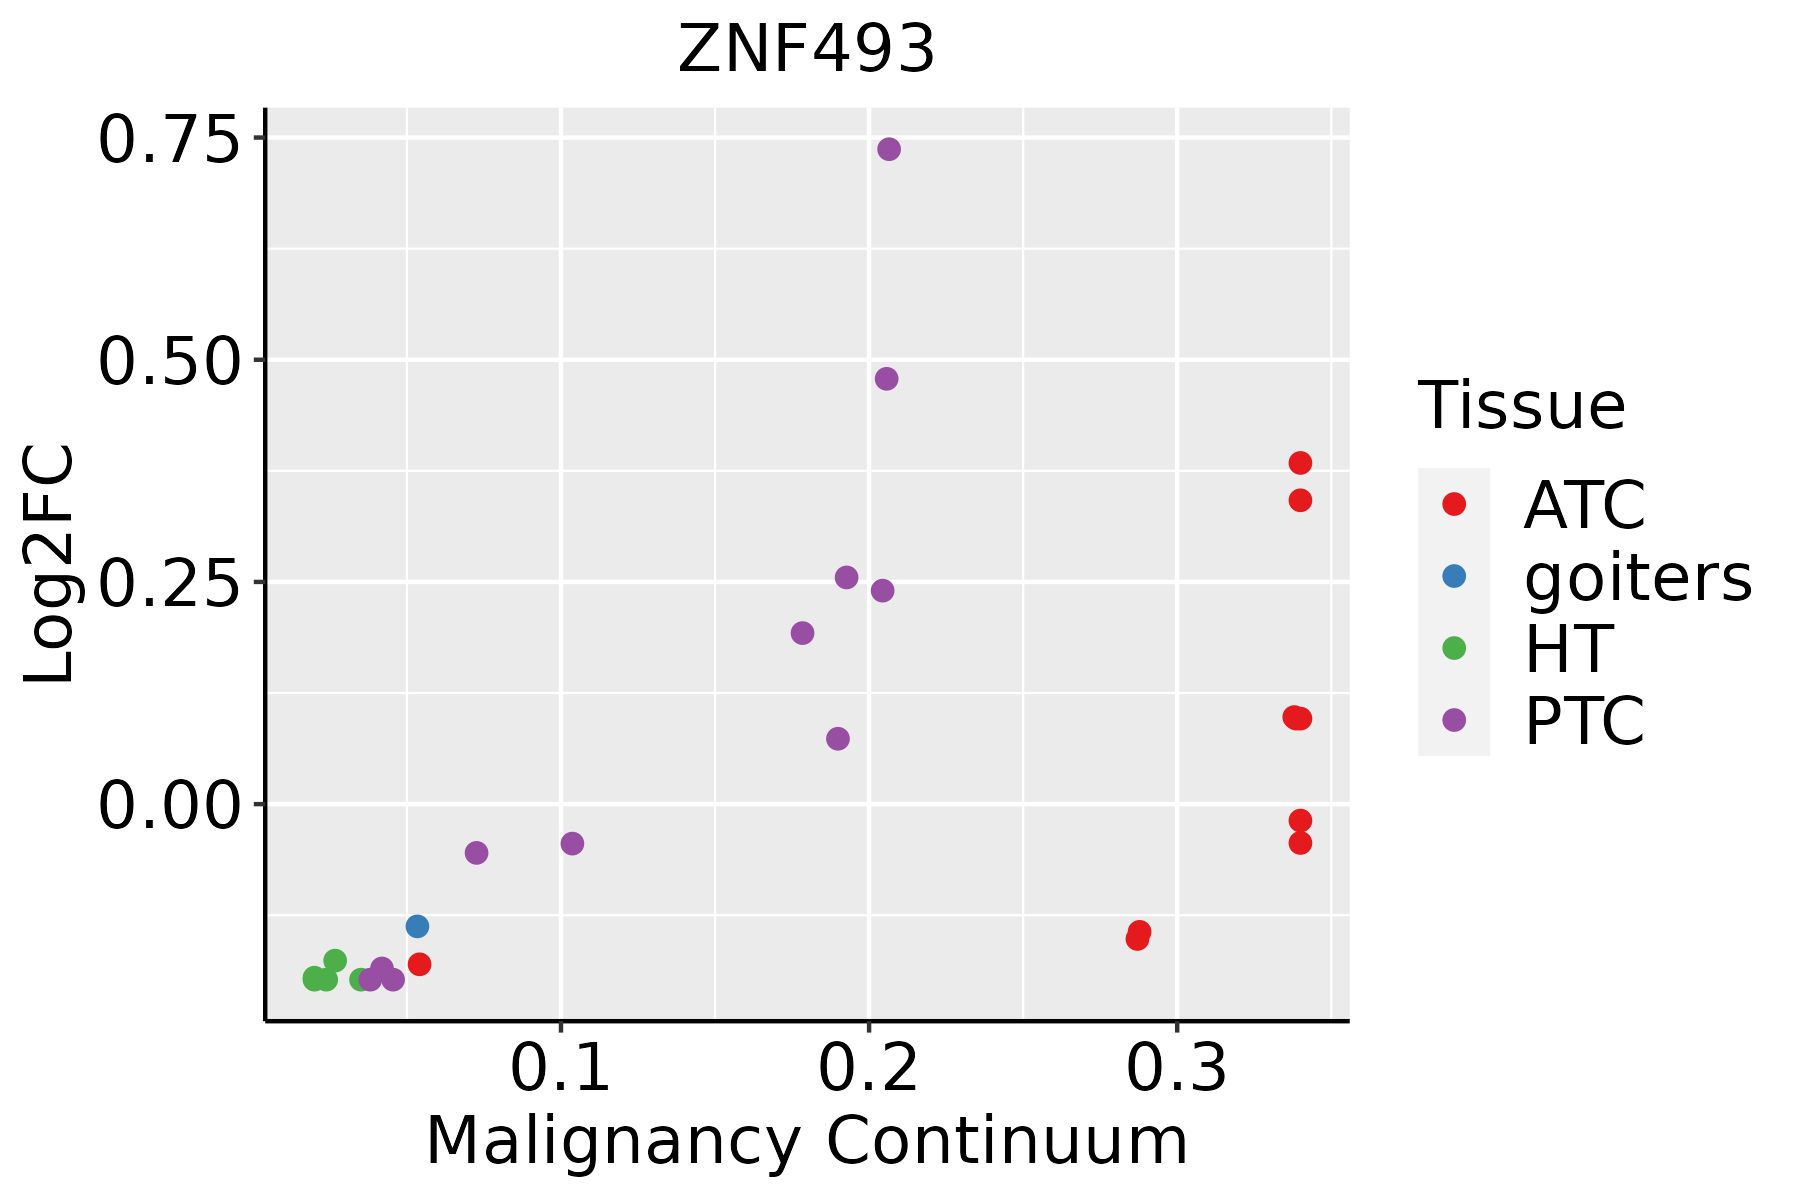 | ATC: Anaplastic thyroid cancer |
| HT: Hashimoto's thyroiditis | ||
| PTC: Papillary thyroid cancer |
| ∗log2FC in expression of this searched gene in stem-like cells from each diseased tissue sample relative to stem-like cells in normal samples in each tissue plotted against the malignancy continuum. Samples are colored based on if they are from different disease stage. |
Top |
Malignant transformation related pathway analysis |
| Find out the enriched GO biological processes and KEGG pathways involved in transition from healthy to precancer to cancer |
| Tissue | Disease Stage | Enriched GO biological Processes |
| Colorectum | AD |  |
| Colorectum | SER |  |
| Colorectum | MSS |  |
| Colorectum | MSI-H |  |
| Colorectum | FAP |  |
| ∗Top 15 enriched GO BP terms are showed in the bar plot of each disease state in each tissue. Each row represents a significant GO biological process which is colored according to the -log10(p.adjust). |
| Page: 1 2 3 4 5 6 7 8 9 |
| GO ID | Tissue | Disease Stage | Description | Gene Ratio | Bg Ratio | pvalue | p.adjust | Count |
| Page: 1 |
| Pathway ID | Tissue | Disease Stage | Description | Gene Ratio | Bg Ratio | pvalue | p.adjust | qvalue | Count |
| Page: 1 |
Top |
Cell-cell communication analysis |
| Identification of potential cell-cell interactions between two cell types and their ligand-receptor pairs for different disease states |
| Ligand | Receptor | LRpair | Pathway | Tissue | Disease Stage |
| Page: 1 |
Top |
Single-cell gene regulatory network inference analysis |
| Find out the significant the regulons (TFs) and the target genes of each regulon across cell types for different disease states |
| TF | Cell Type | Tissue | Disease Stage | Target Gene | RSS | Regulon Activity |
| ZNF493 | MYOFIB | Colorectum | FAP | SDC4,EXOC6,RNF34, etc. | 2.50e-01 |  |
| ZNF493 | FIB | Oral cavity | EOLP | RP11-597D13.9,GMDS-AS1,PDGFC, etc. | 9.29e-03 |  |
| ZNF493 | ECC | Skin | AK | CTD-2017D11.1,CLSTN3,MAPK8IP2, etc. | 7.33e-02 |  |
| ∗The dot plots of a searched regulon are shown for all cell subpopulations in each disease state of each tissue based on the regulon specific score inferred using pySCENIC and by calculating the average expression. |
| Page: 1 |
Top |
Somatic mutation of malignant transformation related genes |
| Annotation of somatic variants for genes involved in malignant transformation |
| Hugo Symbol | Variant Class | Variant Classification | dbSNP RS | HGVSc | HGVSp | HGVSp Short | SWISSPROT | BIOTYPE | SIFT | PolyPhen | Tumor Sample Barcode | Tissue | Histology | Sex | Age | Stage | Therapy Types | Drugs | Outcome |
| ZNF493 | SNV | Missense_Mutation | novel | c.1288N>A | p.Glu430Lys | p.E430K | Q6ZR52 | protein_coding | deleterious(0.05) | probably_damaging(0.966) | TCGA-E9-A1R4-01 | Breast | breast invasive carcinoma | Female | >=65 | I/II | Chemotherapy | 5-fluorouracil | SD |
| ZNF493 | insertion | Nonsense_Mutation | novel | c.859_860insTTTATATGTAATGAAA | p.His287LeufsTer4 | p.H287Lfs*4 | Q6ZR52 | protein_coding | TCGA-AO-A128-01 | Breast | breast invasive carcinoma | Female | <65 | I/II | Chemotherapy | doxorubicin | SD | ||
| ZNF493 | insertion | In_Frame_Ins | novel | c.578_579insATTCTCTCA | p.Met193delinsIlePheSerGln | p.M193delinsIFSQ | Q6ZR52 | protein_coding | TCGA-AR-A0TU-01 | Breast | breast invasive carcinoma | Female | <65 | I/II | Unspecific | Doxorubicin | SD | ||
| ZNF493 | insertion | Frame_Shift_Ins | novel | c.579_580insTATCA | p.Leu194TyrfsTer94 | p.L194Yfs*94 | Q6ZR52 | protein_coding | TCGA-AR-A0TU-01 | Breast | breast invasive carcinoma | Female | <65 | I/II | Unspecific | Doxorubicin | SD | ||
| ZNF493 | SNV | Missense_Mutation | novel | c.184G>A | p.Val62Ile | p.V62I | Q6ZR52 | protein_coding | tolerated(1) | benign(0) | TCGA-C5-A2LZ-01 | Cervix | cervical & endocervical cancer | Female | >=65 | III/IV | Unknown | Unknown | PD |
| ZNF493 | SNV | Missense_Mutation | novel | c.1708C>G | p.His570Asp | p.H570D | Q6ZR52 | protein_coding | deleterious(0.02) | benign(0.023) | TCGA-DS-A1OA-01 | Cervix | cervical & endocervical cancer | Female | >=65 | I/II | Chemotherapy | carboplatin | PD |
| ZNF493 | SNV | Missense_Mutation | novel | c.1710C>G | p.His570Gln | p.H570Q | Q6ZR52 | protein_coding | deleterious(0.01) | benign(0.001) | TCGA-DS-A1OA-01 | Cervix | cervical & endocervical cancer | Female | >=65 | I/II | Chemotherapy | carboplatin | PD |
| ZNF493 | SNV | Missense_Mutation | c.1918N>T | p.Arg640Trp | p.R640W | Q6ZR52 | protein_coding | tolerated(0.27) | benign(0) | TCGA-EX-A1H5-01 | Cervix | cervical & endocervical cancer | Female | <65 | I/II | Unknown | Unknown | SD | |
| ZNF493 | SNV | Missense_Mutation | c.710N>T | p.Ser237Phe | p.S237F | Q6ZR52 | protein_coding | deleterious(0.03) | possibly_damaging(0.885) | TCGA-UC-A7PF-01 | Cervix | cervical & endocervical cancer | Female | <65 | I/II | Unknown | Unknown | SD | |
| ZNF493 | SNV | Missense_Mutation | novel | c.1612N>T | p.Ile538Phe | p.I538F | Q6ZR52 | protein_coding | deleterious(0.01) | probably_damaging(0.964) | TCGA-VS-A953-01 | Cervix | cervical & endocervical cancer | Female | <65 | I/II | Unknown | Unknown | PD |
| Page: 1 2 3 4 5 6 7 8 9 10 11 12 13 |
Top |
Related drugs of malignant transformation related genes |
| Identification of chemicals and drugs interact with genes involved in malignant transfromation |
| (DGIdb 4.0) |
| Entrez ID | Symbol | Category | Interaction Types | Drug Claim Name | Drug Name | PMIDs |
| Page: 1 |

Copyright 2023-Present -The University of Texas Health Science Center at Houston |