
|
|||||
|
 | |
| |
| |
| |
| |
| |
|
Gene: ZNF480 |
Gene summary for ZNF480 |
| Gene information | Species | Human | Gene symbol | ZNF480 | Gene ID | 147657 |
| Gene name | zinc finger protein 480 | |
| Gene Alias | ZNF480 | |
| Cytomap | 19q13.41 | |
| Gene Type | protein-coding | GO ID | GO:0006139 | UniProtAcc | B7Z8E1 |
Top |
Malignant transformation analysis |
| Identification of the aberrant gene expression in precancerous and cancerous lesions by comparing the gene expression of stem-like cells in diseased tissues with normal stem cells |
| Entrez ID | Symbol | Replicates | Species | Organ | Tissue | Adj P-value | Log2FC | Malignancy |
| 147657 | ZNF480 | HCC1_Meng | Human | Liver | HCC | 1.63e-38 | 7.43e-02 | 0.0246 |
| 147657 | ZNF480 | HCC2_Meng | Human | Liver | HCC | 1.84e-03 | -2.82e-02 | 0.0107 |
| 147657 | ZNF480 | HCC1 | Human | Liver | HCC | 6.07e-05 | 3.89e+00 | 0.5336 |
| 147657 | ZNF480 | HCC2 | Human | Liver | HCC | 2.58e-22 | 4.24e+00 | 0.5341 |
| 147657 | ZNF480 | S015 | Human | Liver | HCC | 7.96e-03 | 1.58e-01 | 0.2375 |
| 147657 | ZNF480 | S027 | Human | Liver | HCC | 1.56e-05 | 4.28e-01 | 0.2446 |
| 147657 | ZNF480 | S028 | Human | Liver | HCC | 5.64e-13 | 3.93e-01 | 0.2503 |
| 147657 | ZNF480 | S029 | Human | Liver | HCC | 9.12e-13 | 5.05e-01 | 0.2581 |
| 147657 | ZNF480 | P1_cSCC | Human | Skin | cSCC | 1.09e-07 | 4.15e-01 | 0.0292 |
| 147657 | ZNF480 | P2_cSCC | Human | Skin | cSCC | 6.53e-03 | 2.19e-01 | -0.024 |
| 147657 | ZNF480 | P4_cSCC | Human | Skin | cSCC | 2.10e-02 | 1.22e-01 | -0.00290000000000005 |
| 147657 | ZNF480 | P10_cSCC | Human | Skin | cSCC | 2.27e-03 | 2.41e-01 | 0.1017 |
| Page: 1 |
| Tissue | Expression Dynamics | Abbreviation |
| Liver | 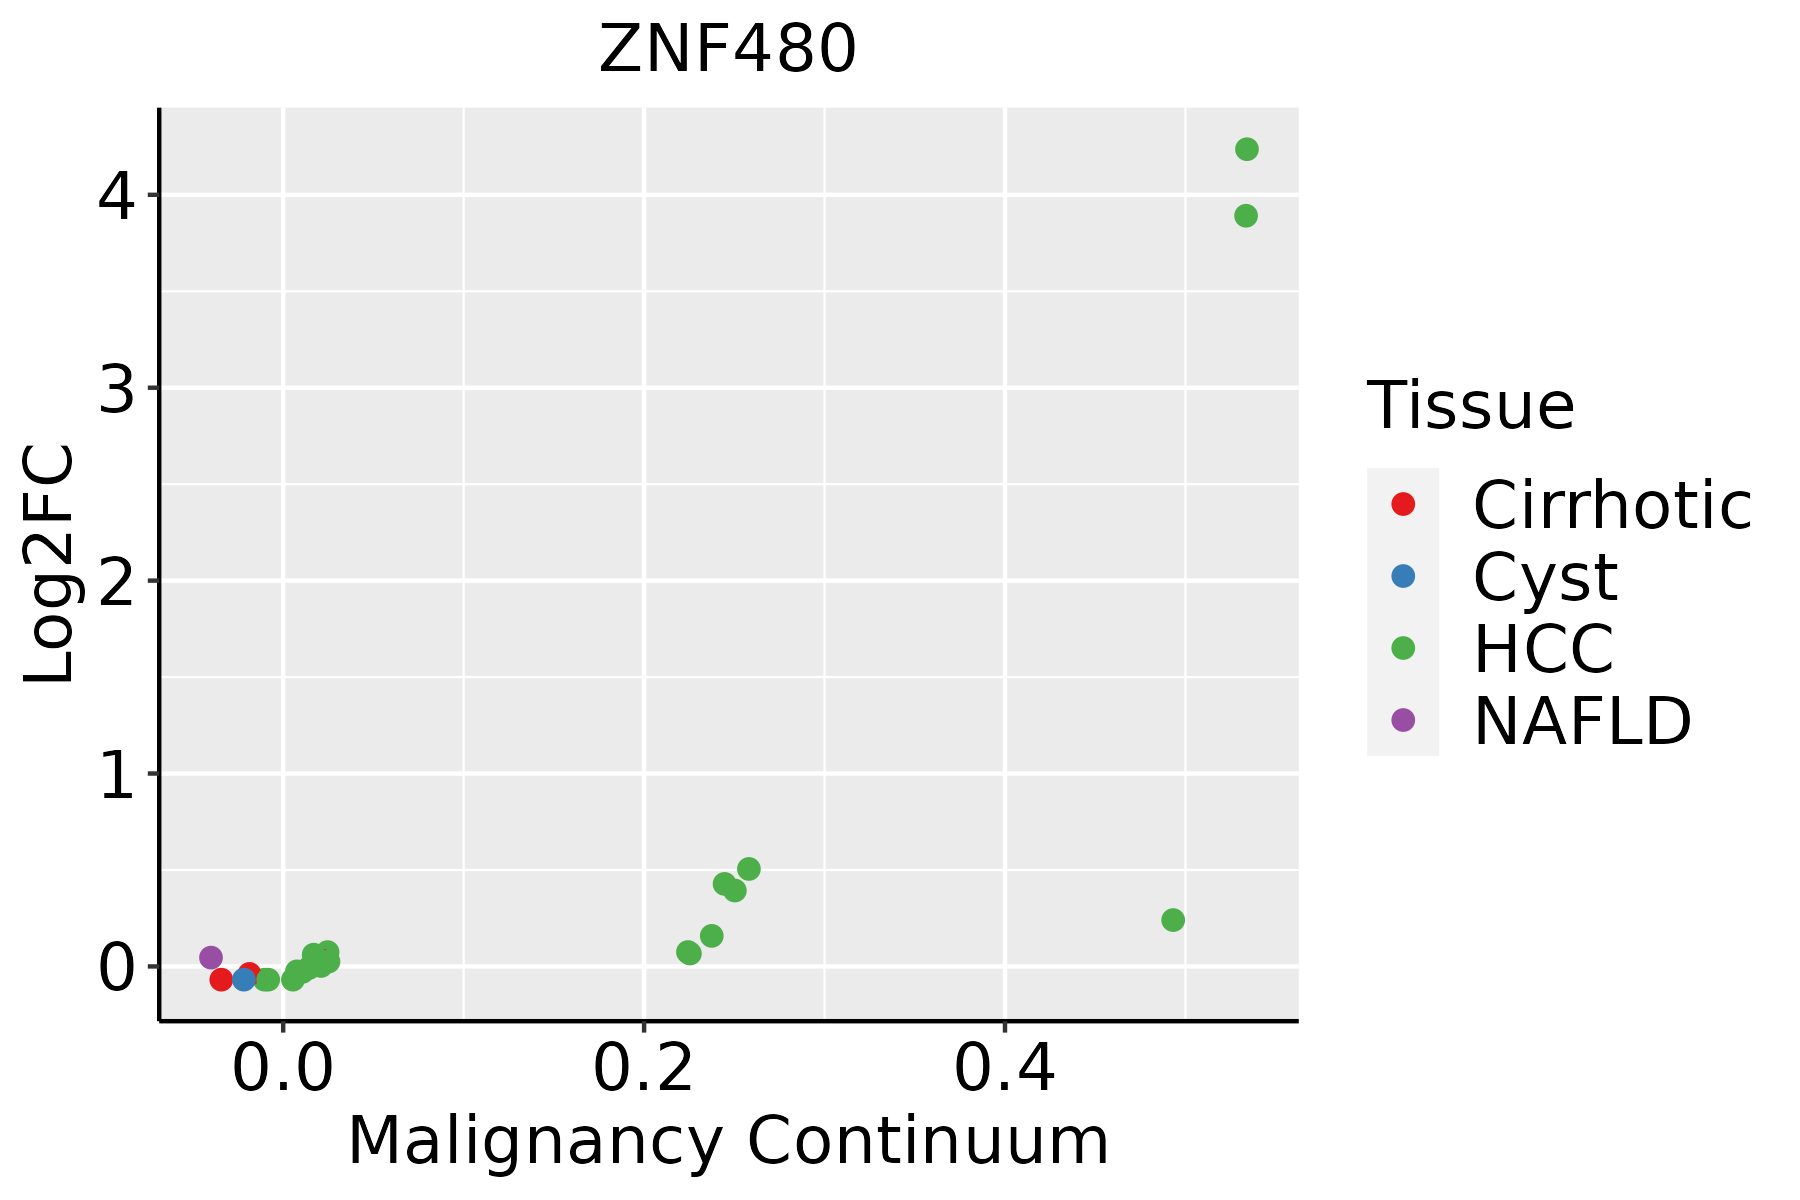 | HCC: Hepatocellular carcinoma |
| NAFLD: Non-alcoholic fatty liver disease | ||
| Skin |  | AK: Actinic keratosis |
| cSCC: Cutaneous squamous cell carcinoma | ||
| SCCIS:squamous cell carcinoma in situ |
| ∗log2FC in expression of this searched gene in stem-like cells from each diseased tissue sample relative to stem-like cells in normal samples in each tissue plotted against the malignancy continuum. Samples are colored based on if they are from different disease stage. |
Top |
Malignant transformation related pathway analysis |
| Find out the enriched GO biological processes and KEGG pathways involved in transition from healthy to precancer to cancer |
| Tissue | Disease Stage | Enriched GO biological Processes |
| Colorectum | AD |  |
| Colorectum | SER |  |
| Colorectum | MSS |  |
| Colorectum | MSI-H |  |
| Colorectum | FAP |  |
| ∗Top 15 enriched GO BP terms are showed in the bar plot of each disease state in each tissue. Each row represents a significant GO biological process which is colored according to the -log10(p.adjust). |
| Page: 1 2 3 4 5 6 7 8 9 |
| GO ID | Tissue | Disease Stage | Description | Gene Ratio | Bg Ratio | pvalue | p.adjust | Count |
| Page: 1 |
| Pathway ID | Tissue | Disease Stage | Description | Gene Ratio | Bg Ratio | pvalue | p.adjust | qvalue | Count |
| Page: 1 |
Top |
Cell-cell communication analysis |
| Identification of potential cell-cell interactions between two cell types and their ligand-receptor pairs for different disease states |
| Ligand | Receptor | LRpair | Pathway | Tissue | Disease Stage |
| Page: 1 |
Top |
Single-cell gene regulatory network inference analysis |
| Find out the significant the regulons (TFs) and the target genes of each regulon across cell types for different disease states |
| TF | Cell Type | Tissue | Disease Stage | Target Gene | RSS | Regulon Activity |
| ZNF480 | M1MAC | Endometrium | ADJ | C20orf24,FBLN1,COL18A1, etc. | 8.00e-02 |  |
| ZNF480 | M1MAC | Endometrium | AEH | C20orf24,FBLN1,COL18A1, etc. | 5.71e-02 |  |
| ZNF480 | LC | Lung | Healthy | STIP1,FAM162A,PGAM1, etc. | 1.74e-03 |  |
| ZNF480 | INCAF | Stomach | SIM | ZNF780A,GLIS2,NCAPH2, etc. | 4.58e-01 |  |
| ∗The dot plots of a searched regulon are shown for all cell subpopulations in each disease state of each tissue based on the regulon specific score inferred using pySCENIC and by calculating the average expression. |
| Page: 1 |
Top |
Somatic mutation of malignant transformation related genes |
| Annotation of somatic variants for genes involved in malignant transformation |
| Hugo Symbol | Variant Class | Variant Classification | dbSNP RS | HGVSc | HGVSp | HGVSp Short | SWISSPROT | BIOTYPE | SIFT | PolyPhen | Tumor Sample Barcode | Tissue | Histology | Sex | Age | Stage | Therapy Types | Drugs | Outcome |
| ZNF480 | SNV | Missense_Mutation | rs773223002 | c.430N>C | p.Asp144His | p.D144H | Q8WV37 | protein_coding | tolerated(0.17) | possibly_damaging(0.453) | TCGA-A2-A0CW-01 | Breast | breast invasive carcinoma | Female | >=65 | I/II | Hormone Therapy | anastrozole | SD |
| ZNF480 | SNV | Missense_Mutation | c.920N>T | p.Arg307Ile | p.R307I | Q8WV37 | protein_coding | tolerated(0.06) | benign(0.07) | TCGA-AN-A046-01 | Breast | breast invasive carcinoma | Female | >=65 | I/II | Unknown | Unknown | SD | |
| ZNF480 | SNV | Missense_Mutation | c.1256N>T | p.Arg419Ile | p.R419I | Q8WV37 | protein_coding | tolerated(0.05) | benign(0.028) | TCGA-AN-A046-01 | Breast | breast invasive carcinoma | Female | >=65 | I/II | Unknown | Unknown | SD | |
| ZNF480 | SNV | Missense_Mutation | rs201507498 | c.474N>G | p.Ile158Met | p.I158M | Q8WV37 | protein_coding | tolerated(0.07) | possibly_damaging(0.823) | TCGA-D8-A1JA-01 | Breast | breast invasive carcinoma | Female | <65 | III/IV | Chemotherapy | adriamycin | PD |
| ZNF480 | SNV | Missense_Mutation | c.206C>G | p.Ser69Cys | p.S69C | Q8WV37 | protein_coding | tolerated(0.27) | benign(0) | TCGA-IR-A3LH-01 | Cervix | cervical & endocervical cancer | Female | <65 | I/II | Chemotherapy | cisplatin | CR | |
| ZNF480 | SNV | Missense_Mutation | novel | c.1342N>G | p.Ile448Val | p.I448V | Q8WV37 | protein_coding | tolerated(0.06) | benign(0.047) | TCGA-VS-A94Z-01 | Cervix | cervical & endocervical cancer | Female | <65 | I/II | Chemotherapy | cisplatin | CR |
| ZNF480 | SNV | Missense_Mutation | rs765758379 | c.1499N>A | p.Arg500Gln | p.R500Q | Q8WV37 | protein_coding | tolerated(0.5) | benign(0.035) | TCGA-AA-3713-01 | Colorectum | colon adenocarcinoma | Male | >=65 | III/IV | Chemotherapy | 5-fluorouracil | PR |
| ZNF480 | SNV | Missense_Mutation | novel | c.1509A>C | p.Lys503Asn | p.K503N | Q8WV37 | protein_coding | tolerated(0.11) | possibly_damaging(0.721) | TCGA-AA-A00N-01 | Colorectum | colon adenocarcinoma | Male | >=65 | I/II | Unknown | Unknown | PD |
| ZNF480 | SNV | Missense_Mutation | c.1172G>T | p.Arg391Ile | p.R391I | Q8WV37 | protein_coding | tolerated(0.27) | possibly_damaging(0.737) | TCGA-AA-A010-01 | Colorectum | colon adenocarcinoma | Female | <65 | I/II | Chemotherapy | folinic | CR | |
| ZNF480 | SNV | Missense_Mutation | novel | c.896N>C | p.Asn299Thr | p.N299T | Q8WV37 | protein_coding | tolerated(0.44) | benign(0.225) | TCGA-AZ-4315-01 | Colorectum | colon adenocarcinoma | Male | <65 | I/II | Unknown | Unknown | SD |
| Page: 1 2 3 4 5 6 7 8 |
Top |
Related drugs of malignant transformation related genes |
| Identification of chemicals and drugs interact with genes involved in malignant transfromation |
| (DGIdb 4.0) |
| Entrez ID | Symbol | Category | Interaction Types | Drug Claim Name | Drug Name | PMIDs |
| Page: 1 |

Copyright 2023-Present -The University of Texas Health Science Center at Houston |