
|
|||||
|
 | |
| |
| |
| |
| |
| |
|
Gene: ZNF462 |
Gene summary for ZNF462 |
| Gene information | Species | Human | Gene symbol | ZNF462 | Gene ID | 58499 |
| Gene name | zinc finger protein 462 | |
| Gene Alias | WSKA | |
| Cytomap | 9q31.2 | |
| Gene Type | protein-coding | GO ID | GO:0006139 | UniProtAcc | Q63HJ5 |
Top |
Malignant transformation analysis |
| Identification of the aberrant gene expression in precancerous and cancerous lesions by comparing the gene expression of stem-like cells in diseased tissues with normal stem cells |
| Entrez ID | Symbol | Replicates | Species | Organ | Tissue | Adj P-value | Log2FC | Malignancy |
| 58499 | ZNF462 | CA_HPV_1 | Human | Cervix | CC | 1.88e-05 | -1.73e-01 | 0.0264 |
| 58499 | ZNF462 | CCI_3 | Human | Cervix | CC | 3.40e-05 | 6.39e-01 | 0.516 |
| 58499 | ZNF462 | HTA11_3410_2000001011 | Human | Colorectum | AD | 1.41e-14 | -5.21e-01 | 0.0155 |
| 58499 | ZNF462 | HTA11_2487_2000001011 | Human | Colorectum | SER | 2.97e-04 | -4.53e-01 | -0.1808 |
| 58499 | ZNF462 | HTA11_3361_2000001011 | Human | Colorectum | AD | 5.71e-06 | -5.25e-01 | -0.1207 |
| 58499 | ZNF462 | HTA11_696_2000001011 | Human | Colorectum | AD | 4.04e-12 | -4.42e-01 | -0.1464 |
| 58499 | ZNF462 | HTA11_866_2000001011 | Human | Colorectum | AD | 3.23e-11 | -4.39e-01 | -0.1001 |
| 58499 | ZNF462 | HTA11_5212_2000001011 | Human | Colorectum | AD | 1.24e-02 | -5.84e-01 | -0.2061 |
| 58499 | ZNF462 | HTA11_866_3004761011 | Human | Colorectum | AD | 2.13e-06 | -4.04e-01 | 0.096 |
| 58499 | ZNF462 | HTA11_10711_2000001011 | Human | Colorectum | AD | 5.06e-04 | -4.48e-01 | 0.0338 |
| 58499 | ZNF462 | HTA11_7696_3000711011 | Human | Colorectum | AD | 9.12e-06 | -3.47e-01 | 0.0674 |
| 58499 | ZNF462 | HTA11_99999971662_82457 | Human | Colorectum | MSS | 1.16e-10 | -3.66e-01 | 0.3859 |
| 58499 | ZNF462 | HTA11_99999973899_84307 | Human | Colorectum | MSS | 5.58e-03 | -5.04e-01 | 0.2585 |
| 58499 | ZNF462 | HTA11_99999974143_84620 | Human | Colorectum | MSS | 2.62e-22 | -5.30e-01 | 0.3005 |
| 58499 | ZNF462 | F007 | Human | Colorectum | FAP | 2.99e-02 | -2.08e-01 | 0.1176 |
| 58499 | ZNF462 | A001-C-207 | Human | Colorectum | FAP | 1.62e-02 | -1.59e-01 | 0.1278 |
| 58499 | ZNF462 | A015-C-203 | Human | Colorectum | FAP | 2.81e-23 | -2.79e-01 | -0.1294 |
| 58499 | ZNF462 | A015-C-204 | Human | Colorectum | FAP | 3.10e-03 | -9.73e-02 | -0.0228 |
| 58499 | ZNF462 | A014-C-040 | Human | Colorectum | FAP | 2.50e-03 | -2.92e-01 | -0.1184 |
| 58499 | ZNF462 | A002-C-201 | Human | Colorectum | FAP | 1.17e-12 | -3.22e-01 | 0.0324 |
| Page: 1 2 3 4 5 6 |
| Tissue | Expression Dynamics | Abbreviation |
| Cervix | 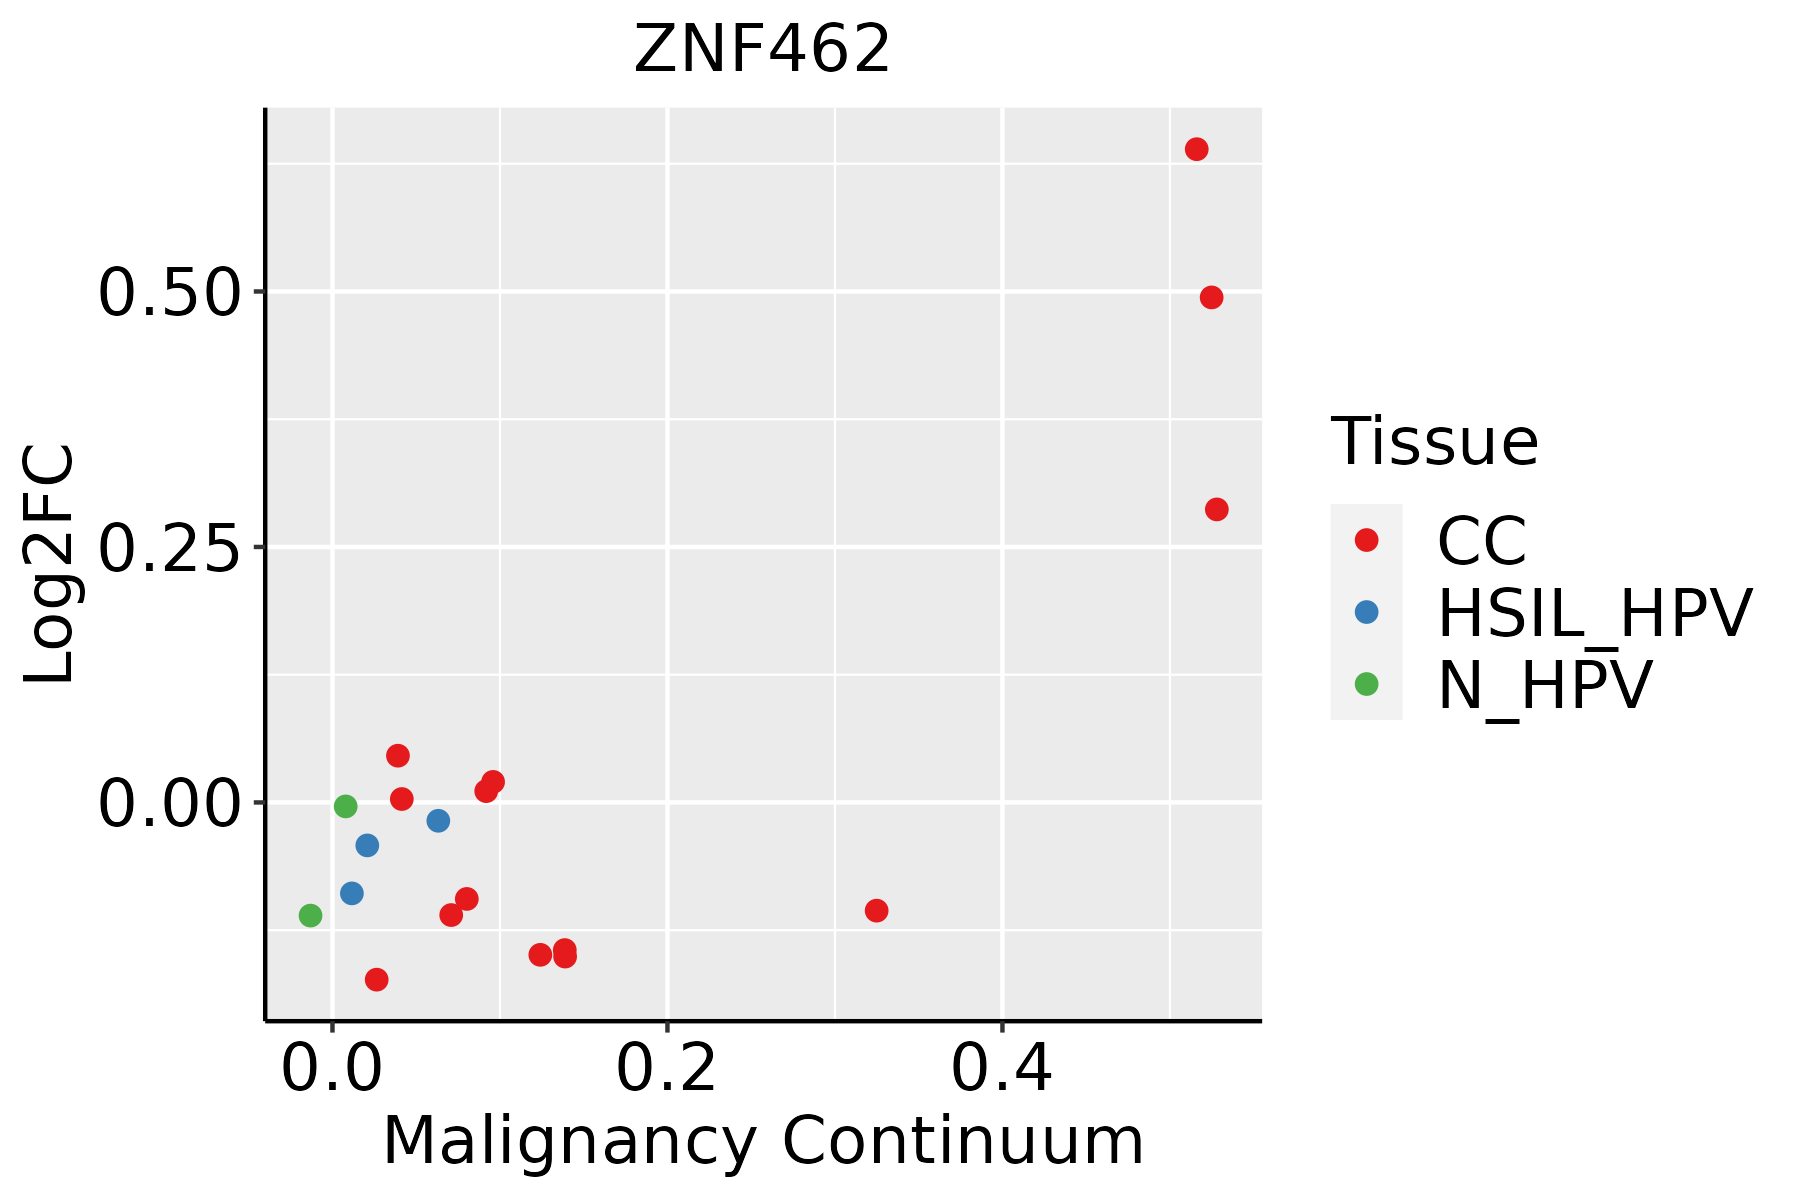 | CC: Cervix cancer |
| HSIL_HPV: HPV-infected high-grade squamous intraepithelial lesions | ||
| N_HPV: HPV-infected normal cervix | ||
| Colorectum (GSE201348) |  | FAP: Familial adenomatous polyposis |
| CRC: Colorectal cancer | ||
| Colorectum (HTA11) |  | AD: Adenomas |
| SER: Sessile serrated lesions | ||
| MSI-H: Microsatellite-high colorectal cancer | ||
| MSS: Microsatellite stable colorectal cancer | ||
| Esophagus |  | ESCC: Esophageal squamous cell carcinoma |
| HGIN: High-grade intraepithelial neoplasias | ||
| LGIN: Low-grade intraepithelial neoplasias | ||
| Thyroid | 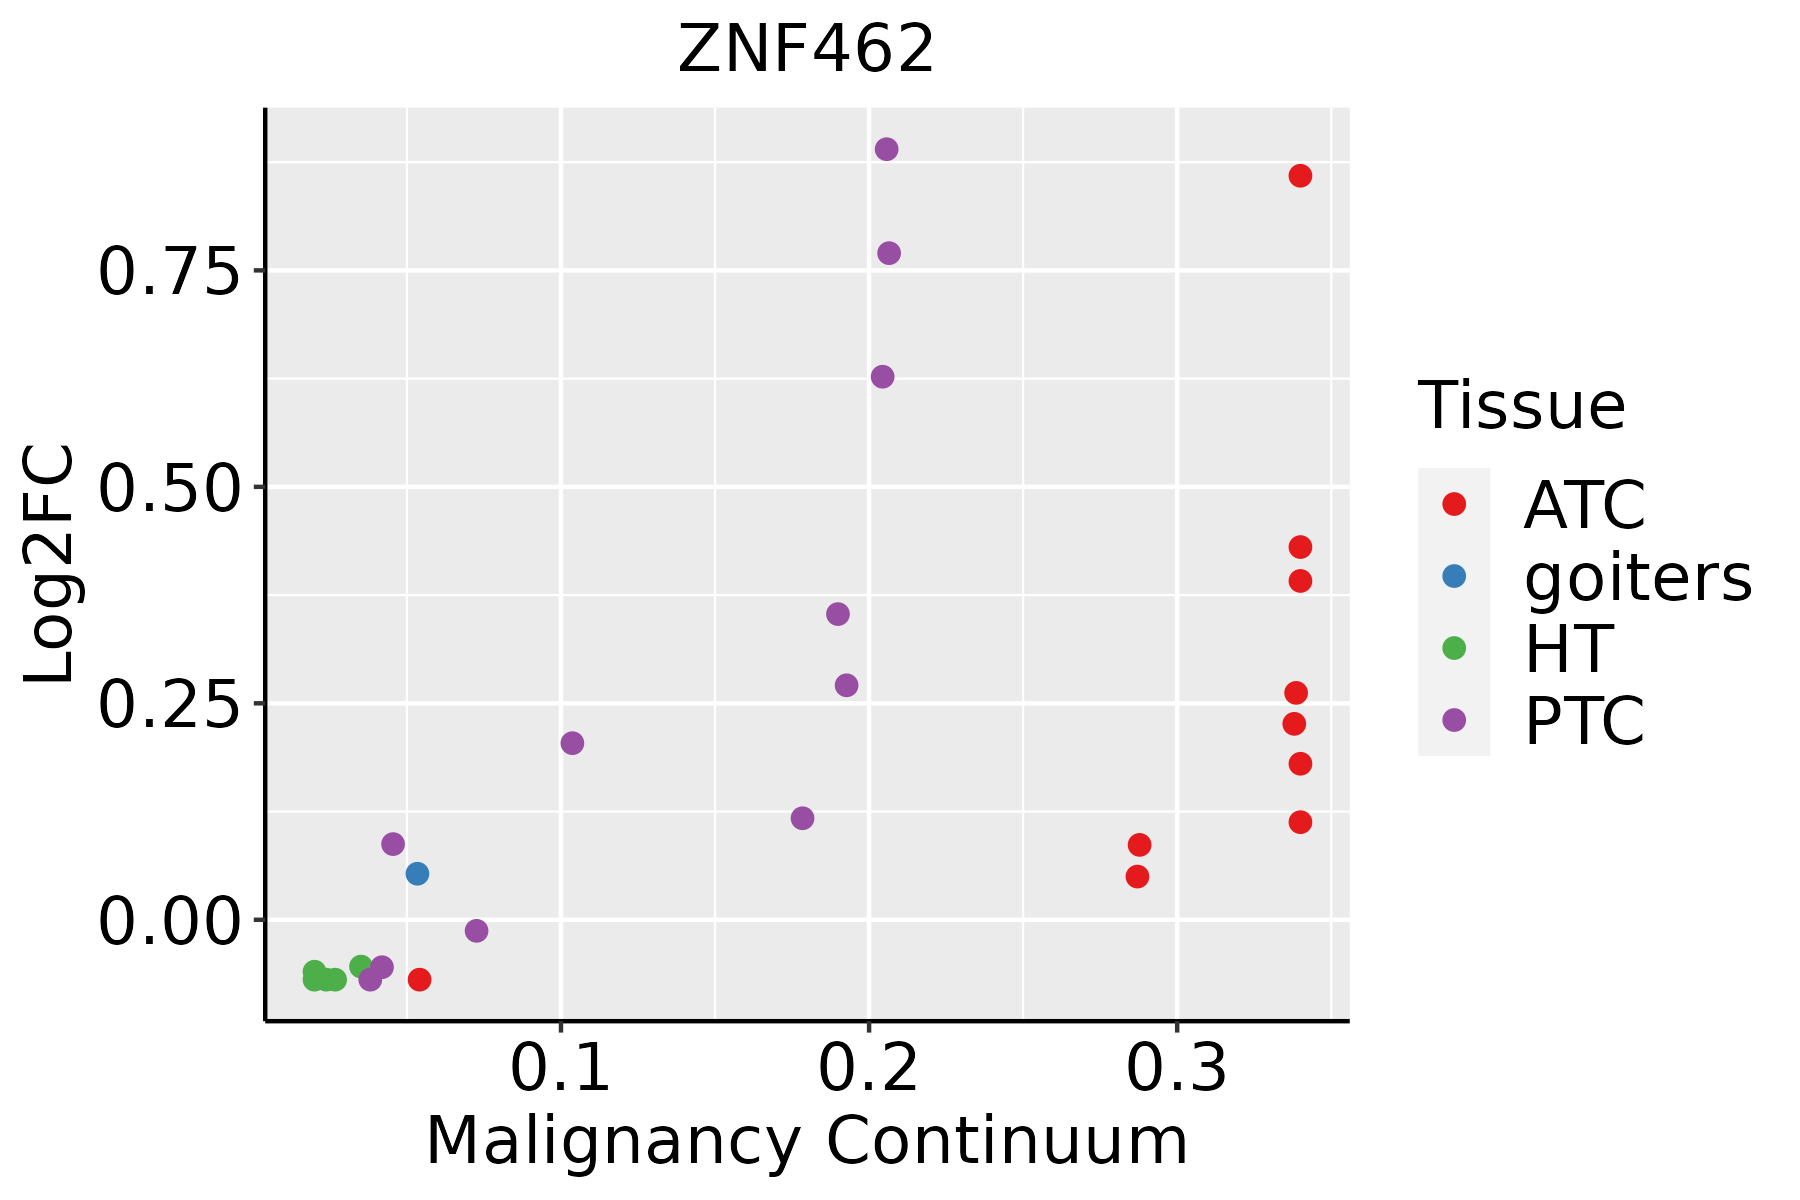 | ATC: Anaplastic thyroid cancer |
| HT: Hashimoto's thyroiditis | ||
| PTC: Papillary thyroid cancer |
| ∗log2FC in expression of this searched gene in stem-like cells from each diseased tissue sample relative to stem-like cells in normal samples in each tissue plotted against the malignancy continuum. Samples are colored based on if they are from different disease stage. |
Top |
Malignant transformation related pathway analysis |
| Find out the enriched GO biological processes and KEGG pathways involved in transition from healthy to precancer to cancer |
| Tissue | Disease Stage | Enriched GO biological Processes |
| Colorectum | AD |  |
| Colorectum | SER |  |
| Colorectum | MSS |  |
| Colorectum | MSI-H |  |
| Colorectum | FAP |  |
| ∗Top 15 enriched GO BP terms are showed in the bar plot of each disease state in each tissue. Each row represents a significant GO biological process which is colored according to the -log10(p.adjust). |
| Page: 1 2 3 4 5 6 7 8 9 |
| GO ID | Tissue | Disease Stage | Description | Gene Ratio | Bg Ratio | pvalue | p.adjust | Count |
| GO:005109810 | Cervix | CC | regulation of binding | 80/2311 | 363/18723 | 1.32e-07 | 6.42e-06 | 80 |
| GO:005110110 | Cervix | CC | regulation of DNA binding | 31/2311 | 118/18723 | 2.91e-05 | 4.81e-04 | 31 |
| GO:00063257 | Cervix | CC | chromatin organization | 78/2311 | 409/18723 | 5.40e-05 | 8.02e-04 | 78 |
| GO:00511009 | Cervix | CC | negative regulation of binding | 34/2311 | 162/18723 | 1.25e-03 | 1.00e-02 | 34 |
| GO:0051098 | Colorectum | AD | regulation of binding | 126/3918 | 363/18723 | 6.01e-10 | 4.88e-08 | 126 |
| GO:0006325 | Colorectum | AD | chromatin organization | 119/3918 | 409/18723 | 4.85e-05 | 8.33e-04 | 119 |
| GO:0051101 | Colorectum | AD | regulation of DNA binding | 42/3918 | 118/18723 | 1.62e-04 | 2.23e-03 | 42 |
| GO:0051100 | Colorectum | AD | negative regulation of binding | 50/3918 | 162/18723 | 1.84e-03 | 1.51e-02 | 50 |
| GO:00510981 | Colorectum | SER | regulation of binding | 97/2897 | 363/18723 | 1.98e-08 | 1.43e-06 | 97 |
| GO:00511011 | Colorectum | SER | regulation of DNA binding | 33/2897 | 118/18723 | 3.70e-04 | 5.71e-03 | 33 |
| GO:00063251 | Colorectum | SER | chromatin organization | 89/2897 | 409/18723 | 4.15e-04 | 6.17e-03 | 89 |
| GO:00511001 | Colorectum | SER | negative regulation of binding | 40/2897 | 162/18723 | 1.46e-03 | 1.59e-02 | 40 |
| GO:00510982 | Colorectum | MSS | regulation of binding | 113/3467 | 363/18723 | 3.55e-09 | 2.41e-07 | 113 |
| GO:00063252 | Colorectum | MSS | chromatin organization | 107/3467 | 409/18723 | 7.22e-05 | 1.21e-03 | 107 |
| GO:00511012 | Colorectum | MSS | regulation of DNA binding | 37/3467 | 118/18723 | 5.29e-04 | 5.99e-03 | 37 |
| GO:00511002 | Colorectum | MSS | negative regulation of binding | 44/3467 | 162/18723 | 4.26e-03 | 3.04e-02 | 44 |
| GO:00510984 | Colorectum | FAP | regulation of binding | 81/2622 | 363/18723 | 1.04e-05 | 2.97e-04 | 81 |
| GO:00063253 | Colorectum | FAP | chromatin organization | 84/2622 | 409/18723 | 1.62e-04 | 2.47e-03 | 84 |
| GO:00510985 | Colorectum | CRC | regulation of binding | 72/2078 | 363/18723 | 6.43e-07 | 4.50e-05 | 72 |
| GO:00063254 | Colorectum | CRC | chromatin organization | 74/2078 | 409/18723 | 1.48e-05 | 4.61e-04 | 74 |
| Page: 1 2 |
| Pathway ID | Tissue | Disease Stage | Description | Gene Ratio | Bg Ratio | pvalue | p.adjust | qvalue | Count |
| Page: 1 |
Top |
Cell-cell communication analysis |
| Identification of potential cell-cell interactions between two cell types and their ligand-receptor pairs for different disease states |
| Ligand | Receptor | LRpair | Pathway | Tissue | Disease Stage |
| Page: 1 |
Top |
Single-cell gene regulatory network inference analysis |
| Find out the significant the regulons (TFs) and the target genes of each regulon across cell types for different disease states |
| TF | Cell Type | Tissue | Disease Stage | Target Gene | RSS | Regulon Activity |
| ∗The dot plots of a searched regulon are shown for all cell subpopulations in each disease state of each tissue based on the regulon specific score inferred using pySCENIC and by calculating the average expression. |
| Page: 1 |
Top |
Somatic mutation of malignant transformation related genes |
| Annotation of somatic variants for genes involved in malignant transformation |
| Hugo Symbol | Variant Class | Variant Classification | dbSNP RS | HGVSc | HGVSp | HGVSp Short | SWISSPROT | BIOTYPE | SIFT | PolyPhen | Tumor Sample Barcode | Tissue | Histology | Sex | Age | Stage | Therapy Types | Drugs | Outcome |
| ZNF462 | SNV | Missense_Mutation | novel | c.3766N>A | p.Glu1256Lys | p.E1256K | Q96JM2 | protein_coding | tolerated(0.09) | possibly_damaging(0.681) | TCGA-5L-AAT1-01 | Breast | breast invasive carcinoma | Female | <65 | III/IV | Hormone Therapy | letrozol | SD |
| ZNF462 | SNV | Missense_Mutation | novel | c.4234N>A | p.Ala1412Thr | p.A1412T | Q96JM2 | protein_coding | tolerated(0.45) | benign(0) | TCGA-A7-A0CE-01 | Breast | breast invasive carcinoma | Female | <65 | I/II | Chemotherapy | adriamycin | SD |
| ZNF462 | SNV | Missense_Mutation | c.7448N>G | p.Asn2483Ser | p.N2483S | Q96JM2 | protein_coding | tolerated_low_confidence(0.79) | benign(0) | TCGA-A7-A0DA-01 | Breast | breast invasive carcinoma | Female | <65 | I/II | Chemotherapy | adriamycin | SD | |
| ZNF462 | SNV | Missense_Mutation | novel | c.398N>T | p.Ala133Val | p.A133V | Q96JM2 | protein_coding | tolerated_low_confidence(0.31) | benign(0.028) | TCGA-A7-A4SE-01 | Breast | breast invasive carcinoma | Female | <65 | I/II | Chemotherapy | adriamycin | CR |
| ZNF462 | SNV | Missense_Mutation | rs762708644 | c.3887N>T | p.Thr1296Met | p.T1296M | Q96JM2 | protein_coding | tolerated(0.56) | benign(0.068) | TCGA-A8-A079-01 | Breast | breast invasive carcinoma | Female | >=65 | III/IV | Chemotherapy | 5-fluorouracil | SD |
| ZNF462 | SNV | Missense_Mutation | novel | c.7152N>A | p.Asp2384Glu | p.D2384E | Q96JM2 | protein_coding | tolerated(1) | benign(0) | TCGA-A8-A09A-01 | Breast | breast invasive carcinoma | Female | <65 | I/II | Hormone Therapy | tamoxiphen | SD |
| ZNF462 | SNV | Missense_Mutation | c.2288N>C | p.Arg763Thr | p.R763T | Q96JM2 | protein_coding | deleterious_low_confidence(0) | benign(0.11) | TCGA-AC-A23H-01 | Breast | breast invasive carcinoma | Female | >=65 | I/II | Unknown | Unknown | PD | |
| ZNF462 | SNV | Missense_Mutation | rs769096911 | c.6830N>A | p.Arg2277Gln | p.R2277Q | Q96JM2 | protein_coding | deleterious(0) | probably_damaging(0.988) | TCGA-AC-A23H-01 | Breast | breast invasive carcinoma | Female | >=65 | I/II | Unknown | Unknown | PD |
| ZNF462 | SNV | Missense_Mutation | rs774505024 | c.3163N>A | p.Glu1055Lys | p.E1055K | Q96JM2 | protein_coding | deleterious(0.01) | possibly_damaging(0.797) | TCGA-AN-A046-01 | Breast | breast invasive carcinoma | Female | >=65 | I/II | Unknown | Unknown | SD |
| ZNF462 | SNV | Missense_Mutation | c.1317N>G | p.Phe439Leu | p.F439L | Q96JM2 | protein_coding | deleterious_low_confidence(0.04) | benign(0.203) | TCGA-AN-A0XW-01 | Breast | breast invasive carcinoma | Female | <65 | III/IV | Unknown | Unknown | SD |
| Page: 1 2 3 4 5 6 7 8 9 10 11 12 13 14 15 16 17 18 19 20 21 22 23 24 25 26 27 28 29 30 |
Top |
Related drugs of malignant transformation related genes |
| Identification of chemicals and drugs interact with genes involved in malignant transfromation |
| (DGIdb 4.0) |
| Entrez ID | Symbol | Category | Interaction Types | Drug Claim Name | Drug Name | PMIDs |
| Page: 1 |

Copyright 2023-Present -The University of Texas Health Science Center at Houston |