
|
|||||
|
 | |
| |
| |
| |
| |
| |
|
Gene: ZNF444 |
Gene summary for ZNF444 |
| Gene information | Species | Human | Gene symbol | ZNF444 | Gene ID | 55311 |
| Gene name | zinc finger protein 444 | |
| Gene Alias | EZF-2 | |
| Cytomap | 19q13.43 | |
| Gene Type | protein-coding | GO ID | GO:0006139 | UniProtAcc | A0A024R4P4 |
Top |
Malignant transformation analysis |
| Identification of the aberrant gene expression in precancerous and cancerous lesions by comparing the gene expression of stem-like cells in diseased tissues with normal stem cells |
| Entrez ID | Symbol | Replicates | Species | Organ | Tissue | Adj P-value | Log2FC | Malignancy |
| 55311 | ZNF444 | LZE22D1 | Human | Esophagus | HGIN | 9.28e-03 | 1.52e-01 | 0.0595 |
| 55311 | ZNF444 | LZE24T | Human | Esophagus | ESCC | 1.90e-15 | 3.12e-01 | 0.0596 |
| 55311 | ZNF444 | P1T-E | Human | Esophagus | ESCC | 6.18e-03 | 1.15e-01 | 0.0875 |
| 55311 | ZNF444 | P2T-E | Human | Esophagus | ESCC | 1.85e-07 | 1.52e-01 | 0.1177 |
| 55311 | ZNF444 | P4T-E | Human | Esophagus | ESCC | 1.01e-08 | 1.86e-01 | 0.1323 |
| 55311 | ZNF444 | P8T-E | Human | Esophagus | ESCC | 2.73e-30 | 4.38e-01 | 0.0889 |
| 55311 | ZNF444 | P9T-E | Human | Esophagus | ESCC | 6.12e-05 | 1.19e-01 | 0.1131 |
| 55311 | ZNF444 | P10T-E | Human | Esophagus | ESCC | 2.47e-26 | 3.41e-01 | 0.116 |
| 55311 | ZNF444 | P11T-E | Human | Esophagus | ESCC | 5.70e-14 | 3.19e-01 | 0.1426 |
| 55311 | ZNF444 | P12T-E | Human | Esophagus | ESCC | 1.78e-13 | 2.67e-01 | 0.1122 |
| 55311 | ZNF444 | P15T-E | Human | Esophagus | ESCC | 5.38e-17 | 2.90e-01 | 0.1149 |
| 55311 | ZNF444 | P16T-E | Human | Esophagus | ESCC | 2.31e-13 | 1.79e-01 | 0.1153 |
| 55311 | ZNF444 | P17T-E | Human | Esophagus | ESCC | 8.18e-08 | 2.54e-01 | 0.1278 |
| 55311 | ZNF444 | P19T-E | Human | Esophagus | ESCC | 8.25e-07 | 4.04e-01 | 0.1662 |
| 55311 | ZNF444 | P20T-E | Human | Esophagus | ESCC | 5.41e-11 | 9.71e-02 | 0.1124 |
| 55311 | ZNF444 | P21T-E | Human | Esophagus | ESCC | 1.61e-12 | 1.23e-01 | 0.1617 |
| 55311 | ZNF444 | P22T-E | Human | Esophagus | ESCC | 6.84e-13 | 2.23e-01 | 0.1236 |
| 55311 | ZNF444 | P23T-E | Human | Esophagus | ESCC | 9.70e-12 | 2.33e-01 | 0.108 |
| 55311 | ZNF444 | P24T-E | Human | Esophagus | ESCC | 4.37e-15 | 1.65e-01 | 0.1287 |
| 55311 | ZNF444 | P26T-E | Human | Esophagus | ESCC | 9.42e-27 | 4.43e-01 | 0.1276 |
| Page: 1 2 3 4 5 |
| Tissue | Expression Dynamics | Abbreviation |
| Esophagus | 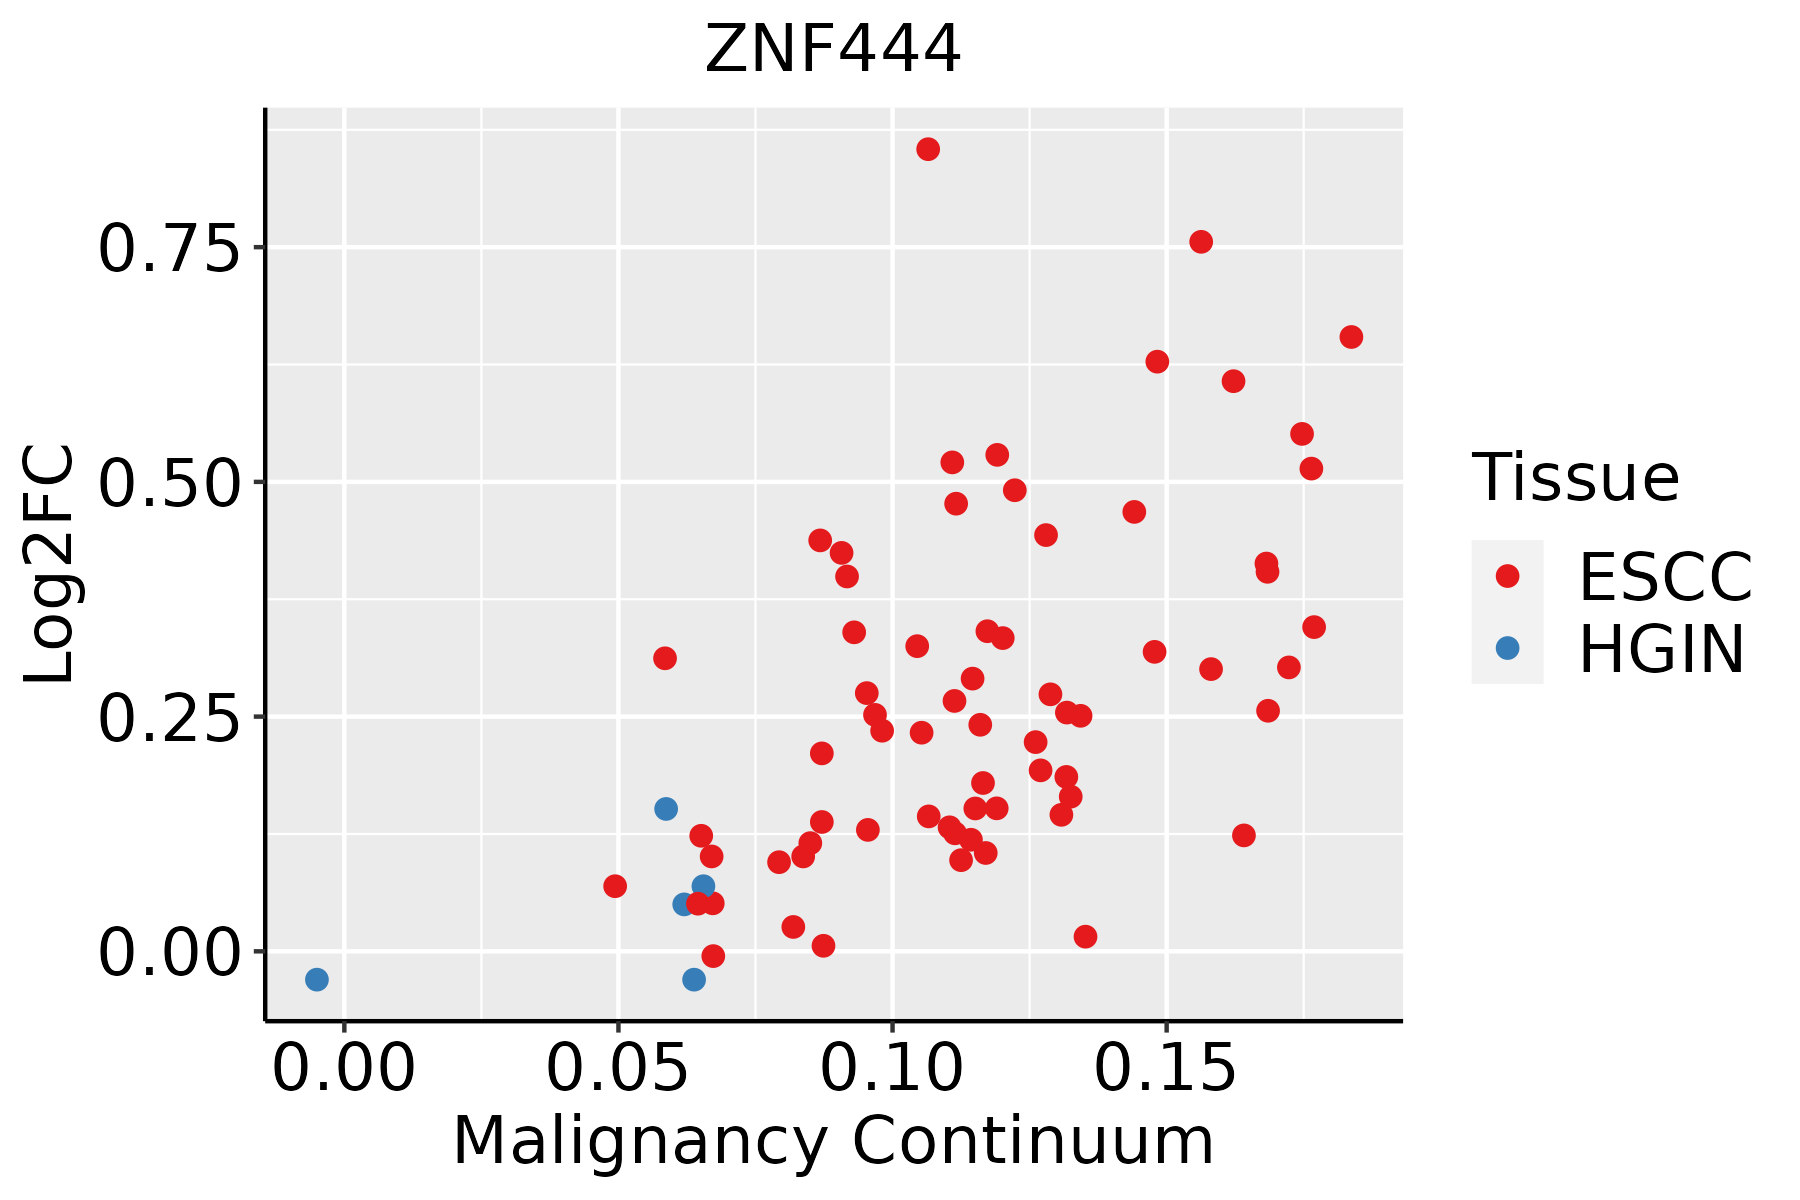 | ESCC: Esophageal squamous cell carcinoma |
| HGIN: High-grade intraepithelial neoplasias | ||
| LGIN: Low-grade intraepithelial neoplasias | ||
| Liver | 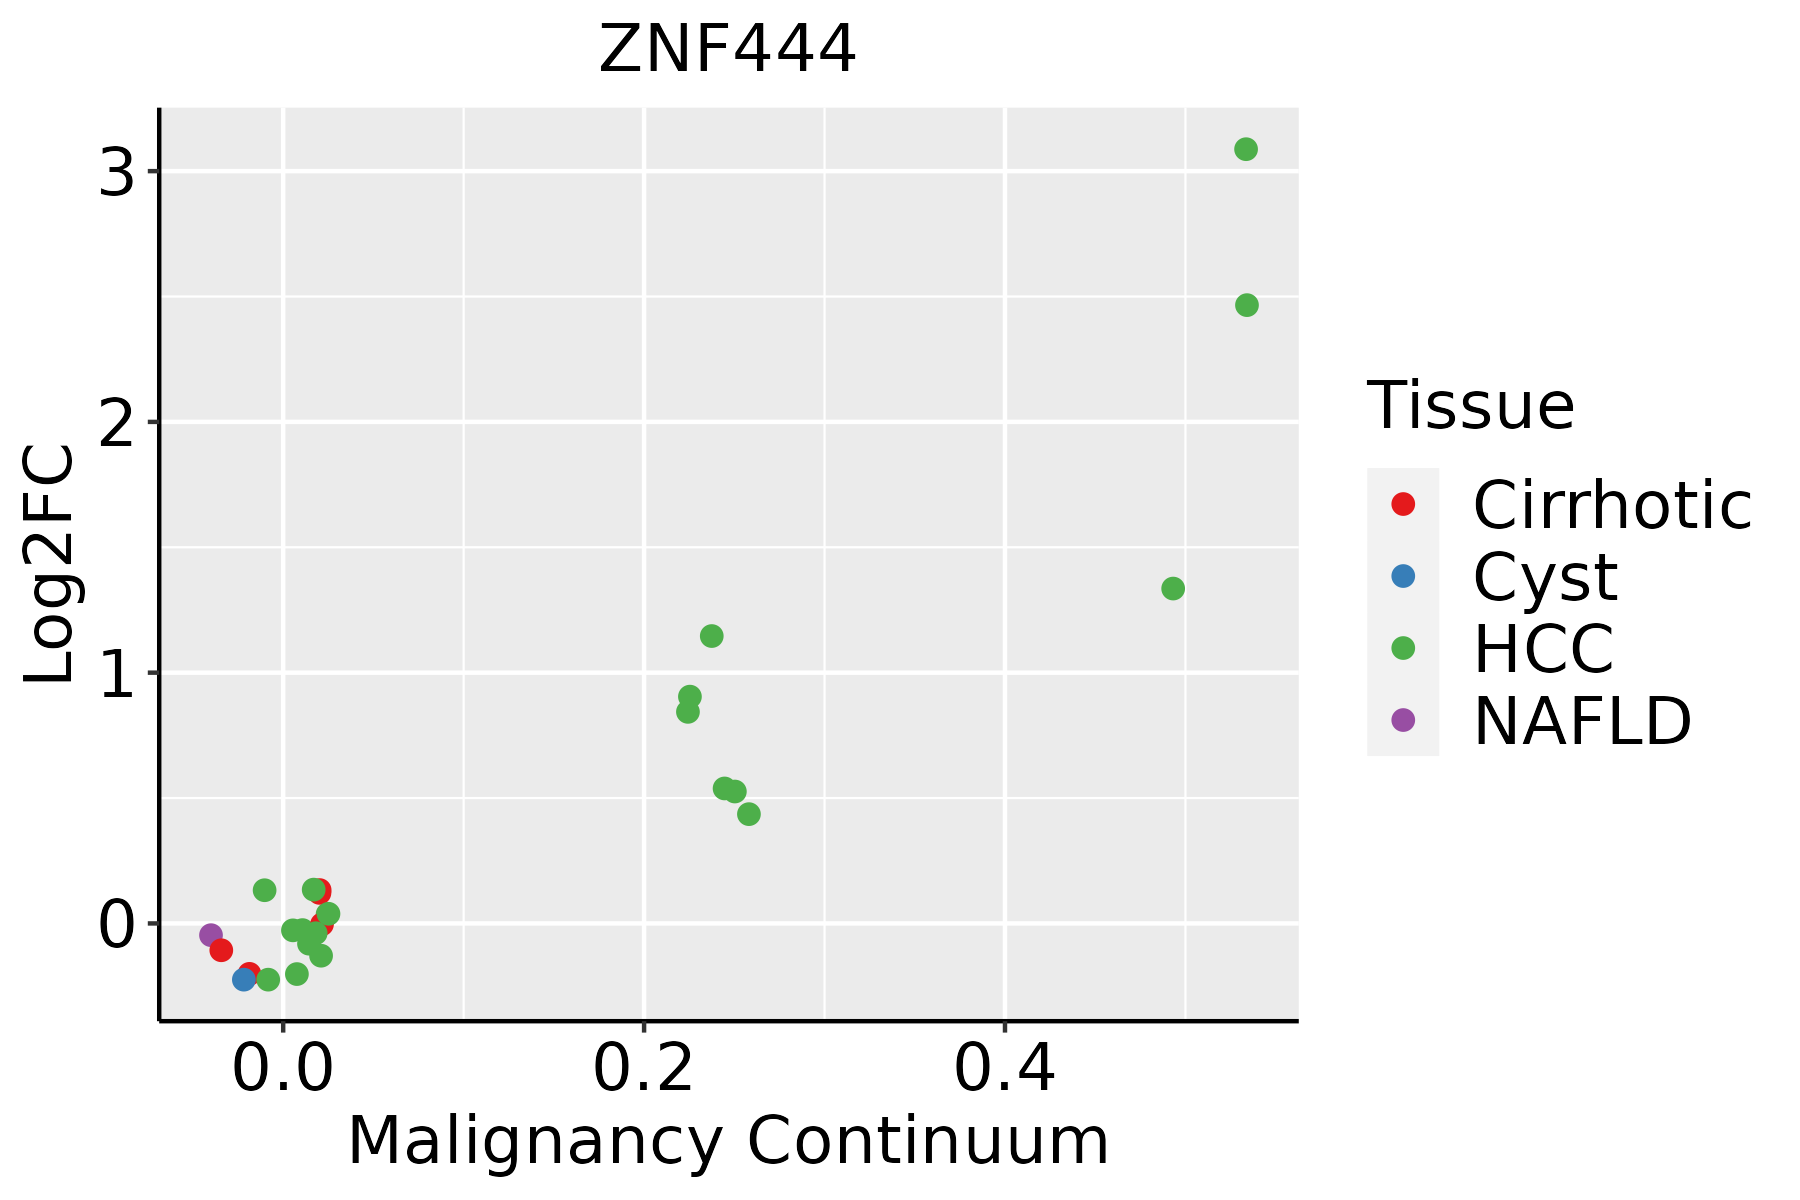 | HCC: Hepatocellular carcinoma |
| NAFLD: Non-alcoholic fatty liver disease | ||
| Oral Cavity | 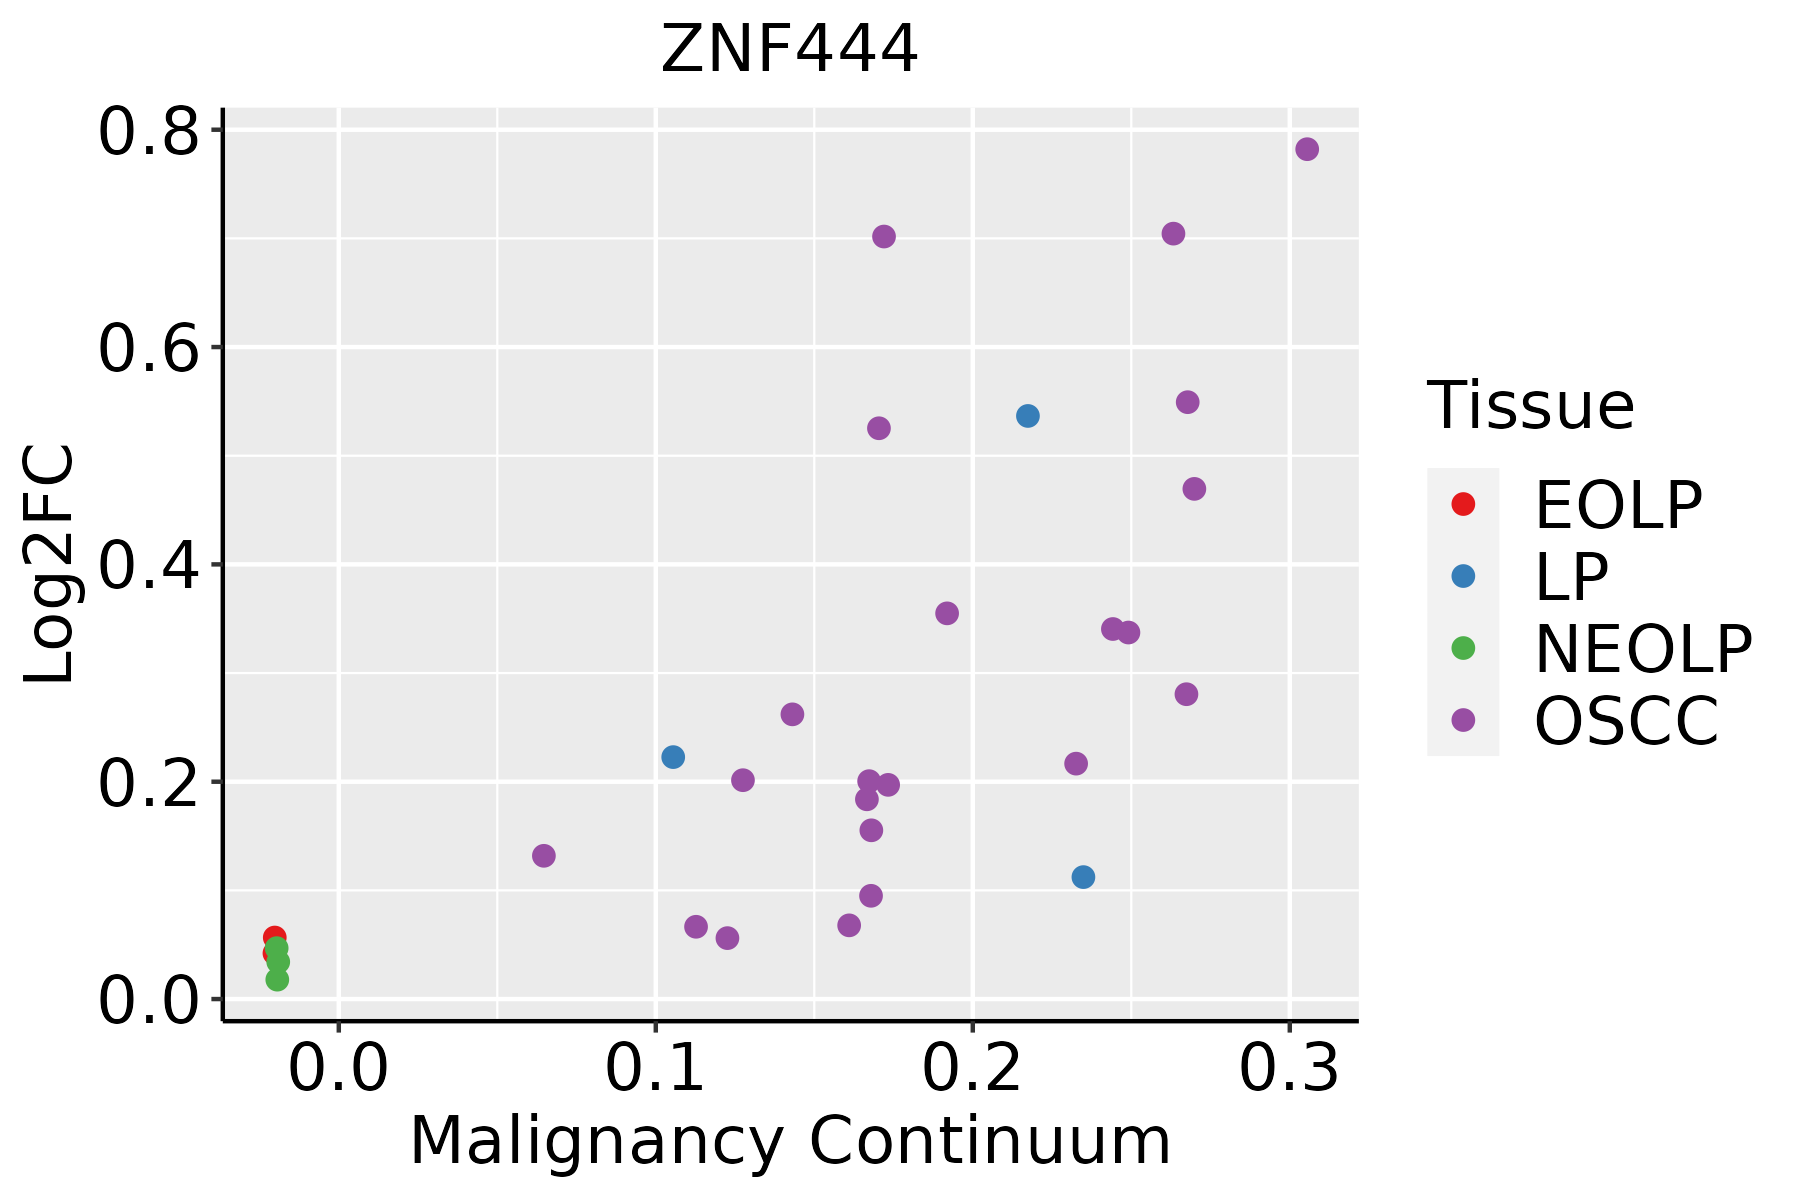 | EOLP: Erosive Oral lichen planus |
| LP: leukoplakia | ||
| NEOLP: Non-erosive oral lichen planus | ||
| OSCC: Oral squamous cell carcinoma |
| ∗log2FC in expression of this searched gene in stem-like cells from each diseased tissue sample relative to stem-like cells in normal samples in each tissue plotted against the malignancy continuum. Samples are colored based on if they are from different disease stage. |
Top |
Malignant transformation related pathway analysis |
| Find out the enriched GO biological processes and KEGG pathways involved in transition from healthy to precancer to cancer |
| Tissue | Disease Stage | Enriched GO biological Processes |
| Colorectum | AD |  |
| Colorectum | SER |  |
| Colorectum | MSS |  |
| Colorectum | MSI-H |  |
| Colorectum | FAP |  |
| ∗Top 15 enriched GO BP terms are showed in the bar plot of each disease state in each tissue. Each row represents a significant GO biological process which is colored according to the -log10(p.adjust). |
| Page: 1 2 3 4 5 6 7 8 9 |
| GO ID | Tissue | Disease Stage | Description | Gene Ratio | Bg Ratio | pvalue | p.adjust | Count |
| Page: 1 |
| Pathway ID | Tissue | Disease Stage | Description | Gene Ratio | Bg Ratio | pvalue | p.adjust | qvalue | Count |
| Page: 1 |
Top |
Cell-cell communication analysis |
| Identification of potential cell-cell interactions between two cell types and their ligand-receptor pairs for different disease states |
| Ligand | Receptor | LRpair | Pathway | Tissue | Disease Stage |
| Page: 1 |
Top |
Single-cell gene regulatory network inference analysis |
| Find out the significant the regulons (TFs) and the target genes of each regulon across cell types for different disease states |
| TF | Cell Type | Tissue | Disease Stage | Target Gene | RSS | Regulon Activity |
| ZNF444 | M1MAC | Cervix | ADJ | ADAP1,ZNF813,SH2D1B, etc. | 1.87e-01 |  |
| ZNF444 | INMON | Cervix | ADJ | ADAP1,ZNF813,SH2D1B, etc. | 1.33e-01 | |
| ZNF444 | NEUT | Cervix | ADJ | ADAP1,ZNF813,SH2D1B, etc. | 1.53e-01 | |
| ZNF444 | BN | Cervix | ADJ | ADAP1,ZNF813,SH2D1B, etc. | 2.24e-02 | |
| ZNF444 | M1MAC | Cervix | CC | ADAP1,ZNF813,SH2D1B, etc. | 4.45e-02 |  |
| ZNF444 | DC | Cervix | Healthy | ADAP1,ZNF813,SH2D1B, etc. | 1.41e-02 |  |
| ZNF444 | NEUT | Cervix | Healthy | ADAP1,ZNF813,SH2D1B, etc. | 5.18e-01 | |
| ZNF444 | NEUT | Cervix | HSIL_HPV | ADAP1,ZNF813,SH2D1B, etc. | 3.53e-01 |  |
| ZNF444 | M1MAC | Cervix | HSIL_HPV | ADAP1,ZNF813,SH2D1B, etc. | 8.65e-03 | |
| ZNF444 | MON | Cervix | HSIL_HPV | ADAP1,ZNF813,SH2D1B, etc. | 7.97e-03 | |
| ∗The dot plots of a searched regulon are shown for all cell subpopulations in each disease state of each tissue based on the regulon specific score inferred using pySCENIC and by calculating the average expression. |
| Page: 1 2 3 4 |
Top |
Somatic mutation of malignant transformation related genes |
| Annotation of somatic variants for genes involved in malignant transformation |
| Hugo Symbol | Variant Class | Variant Classification | dbSNP RS | HGVSc | HGVSp | HGVSp Short | SWISSPROT | BIOTYPE | SIFT | PolyPhen | Tumor Sample Barcode | Tissue | Histology | Sex | Age | Stage | Therapy Types | Drugs | Outcome |
| ZNF444 | SNV | Missense_Mutation | c.154N>A | p.Glu52Lys | p.E52K | Q8N0Y2 | protein_coding | deleterious(0) | probably_damaging(0.974) | TCGA-A6-2686-01 | Colorectum | colon adenocarcinoma | Female | >=65 | I/II | Unknown | Unknown | SD | |
| ZNF444 | insertion | Frame_Shift_Ins | rs775285349 | c.310_311insC | p.Asp106ArgfsTer38 | p.D106Rfs*38 | Q8N0Y2 | protein_coding | TCGA-AG-A02N-01 | Colorectum | rectum adenocarcinoma | Male | >=65 | I/II | Chemotherapy | folinic | CR | ||
| ZNF444 | SNV | Missense_Mutation | novel | c.367G>A | p.Ala123Thr | p.A123T | Q8N0Y2 | protein_coding | tolerated(0.56) | benign(0.012) | TCGA-AP-A1DK-01 | Endometrium | uterine corpus endometrioid carcinoma | Female | <65 | I/II | Unknown | Unknown | SD |
| ZNF444 | SNV | Missense_Mutation | rs759442720 | c.316G>A | p.Asp106Asn | p.D106N | Q8N0Y2 | protein_coding | tolerated(0.32) | benign(0.138) | TCGA-B5-A11E-01 | Endometrium | uterine corpus endometrioid carcinoma | Female | <65 | I/II | Unknown | Unknown | SD |
| ZNF444 | SNV | Missense_Mutation | c.358N>T | p.Gly120Cys | p.G120C | Q8N0Y2 | protein_coding | deleterious(0.01) | possibly_damaging(0.894) | TCGA-21-1077-01 | Lung | lung squamous cell carcinoma | Male | <65 | I/II | Unknown | Unknown | PD | |
| ZNF444 | SNV | Missense_Mutation | novel | c.355N>A | p.Gln119Lys | p.Q119K | Q8N0Y2 | protein_coding | tolerated(0.17) | benign(0.003) | TCGA-68-8251-01 | Lung | lung squamous cell carcinoma | Male | >=65 | I/II | Chemotherapy | carboplatin | SD |
| ZNF444 | SNV | Missense_Mutation | novel | c.443G>A | p.Gly148Glu | p.G148E | Q8N0Y2 | protein_coding | tolerated(0.37) | benign(0) | TCGA-CQ-A4CI-01 | Oral cavity | head & neck squamous cell carcinoma | Male | >=65 | III/IV | Unknown | Unknown | PD |
| ZNF444 | SNV | Missense_Mutation | novel | c.137G>T | p.Arg46Leu | p.R46L | Q8N0Y2 | protein_coding | tolerated(0.31) | probably_damaging(0.982) | TCGA-CV-7427-01 | Oral cavity | head & neck squamous cell carcinoma | Female | >=65 | I/II | Unknown | Unknown | PD |
| ZNF444 | SNV | Missense_Mutation | novel | c.310N>C | p.Ser104Pro | p.S104P | Q8N0Y2 | protein_coding | tolerated(0.19) | possibly_damaging(0.597) | TCGA-CV-A45Q-01 | Oral cavity | head & neck squamous cell carcinoma | Female | >=65 | I/II | Unknown | Unknown | SD |
| ZNF444 | SNV | Missense_Mutation | novel | c.130C>G | p.Leu44Val | p.L44V | Q8N0Y2 | protein_coding | deleterious(0) | probably_damaging(0.973) | TCGA-QK-A8ZB-01 | Oral cavity | head & neck squamous cell carcinoma | Male | >=65 | I/II | Unknown | Unknown | SD |
| Page: 1 2 |
Top |
Related drugs of malignant transformation related genes |
| Identification of chemicals and drugs interact with genes involved in malignant transfromation |
| (DGIdb 4.0) |
| Entrez ID | Symbol | Category | Interaction Types | Drug Claim Name | Drug Name | PMIDs |
| Page: 1 |

Copyright 2023-Present -The University of Texas Health Science Center at Houston |