
|
|||||
|
 | |
| |
| |
| |
| |
| |
|
Gene: ZNF431 |
Gene summary for ZNF431 |
| Gene information | Species | Human | Gene symbol | ZNF431 | Gene ID | 170959 |
| Gene name | zinc finger protein 431 | |
| Gene Alias | ZFP932 | |
| Cytomap | 19p12 | |
| Gene Type | protein-coding | GO ID | GO:0000122 | UniProtAcc | Q8TF32 |
Top |
Malignant transformation analysis |
| Identification of the aberrant gene expression in precancerous and cancerous lesions by comparing the gene expression of stem-like cells in diseased tissues with normal stem cells |
| Entrez ID | Symbol | Replicates | Species | Organ | Tissue | Adj P-value | Log2FC | Malignancy |
| 170959 | ZNF431 | LZE4T | Human | Esophagus | ESCC | 2.07e-12 | 3.47e-01 | 0.0811 |
| 170959 | ZNF431 | LZE7T | Human | Esophagus | ESCC | 6.43e-11 | 5.44e-01 | 0.0667 |
| 170959 | ZNF431 | LZE8T | Human | Esophagus | ESCC | 7.47e-03 | 1.22e-01 | 0.067 |
| 170959 | ZNF431 | LZE20T | Human | Esophagus | ESCC | 3.70e-08 | 1.96e-01 | 0.0662 |
| 170959 | ZNF431 | LZE22D1 | Human | Esophagus | HGIN | 8.41e-03 | 1.86e-01 | 0.0595 |
| 170959 | ZNF431 | LZE24T | Human | Esophagus | ESCC | 1.01e-11 | 2.39e-01 | 0.0596 |
| 170959 | ZNF431 | LZE6T | Human | Esophagus | ESCC | 1.65e-05 | 1.54e-01 | 0.0845 |
| 170959 | ZNF431 | P1T-E | Human | Esophagus | ESCC | 1.60e-12 | 5.66e-01 | 0.0875 |
| 170959 | ZNF431 | P2T-E | Human | Esophagus | ESCC | 5.62e-15 | 2.39e-01 | 0.1177 |
| 170959 | ZNF431 | P4T-E | Human | Esophagus | ESCC | 8.99e-16 | 3.87e-01 | 0.1323 |
| 170959 | ZNF431 | P5T-E | Human | Esophagus | ESCC | 8.12e-30 | 5.43e-01 | 0.1327 |
| 170959 | ZNF431 | P8T-E | Human | Esophagus | ESCC | 1.81e-23 | 5.23e-01 | 0.0889 |
| 170959 | ZNF431 | P10T-E | Human | Esophagus | ESCC | 3.11e-41 | 6.87e-01 | 0.116 |
| 170959 | ZNF431 | P11T-E | Human | Esophagus | ESCC | 7.54e-05 | 2.18e-01 | 0.1426 |
| 170959 | ZNF431 | P12T-E | Human | Esophagus | ESCC | 4.13e-28 | 5.51e-01 | 0.1122 |
| 170959 | ZNF431 | P16T-E | Human | Esophagus | ESCC | 1.18e-09 | 2.06e-01 | 0.1153 |
| 170959 | ZNF431 | P17T-E | Human | Esophagus | ESCC | 9.17e-06 | 2.36e-01 | 0.1278 |
| 170959 | ZNF431 | P20T-E | Human | Esophagus | ESCC | 1.41e-03 | 1.38e-01 | 0.1124 |
| 170959 | ZNF431 | P21T-E | Human | Esophagus | ESCC | 6.35e-11 | 2.02e-01 | 0.1617 |
| 170959 | ZNF431 | P22T-E | Human | Esophagus | ESCC | 2.53e-09 | 9.00e-02 | 0.1236 |
| Page: 1 2 3 4 |
| Tissue | Expression Dynamics | Abbreviation |
| Esophagus |  | ESCC: Esophageal squamous cell carcinoma |
| HGIN: High-grade intraepithelial neoplasias | ||
| LGIN: Low-grade intraepithelial neoplasias | ||
| Liver |  | HCC: Hepatocellular carcinoma |
| NAFLD: Non-alcoholic fatty liver disease | ||
| Thyroid | 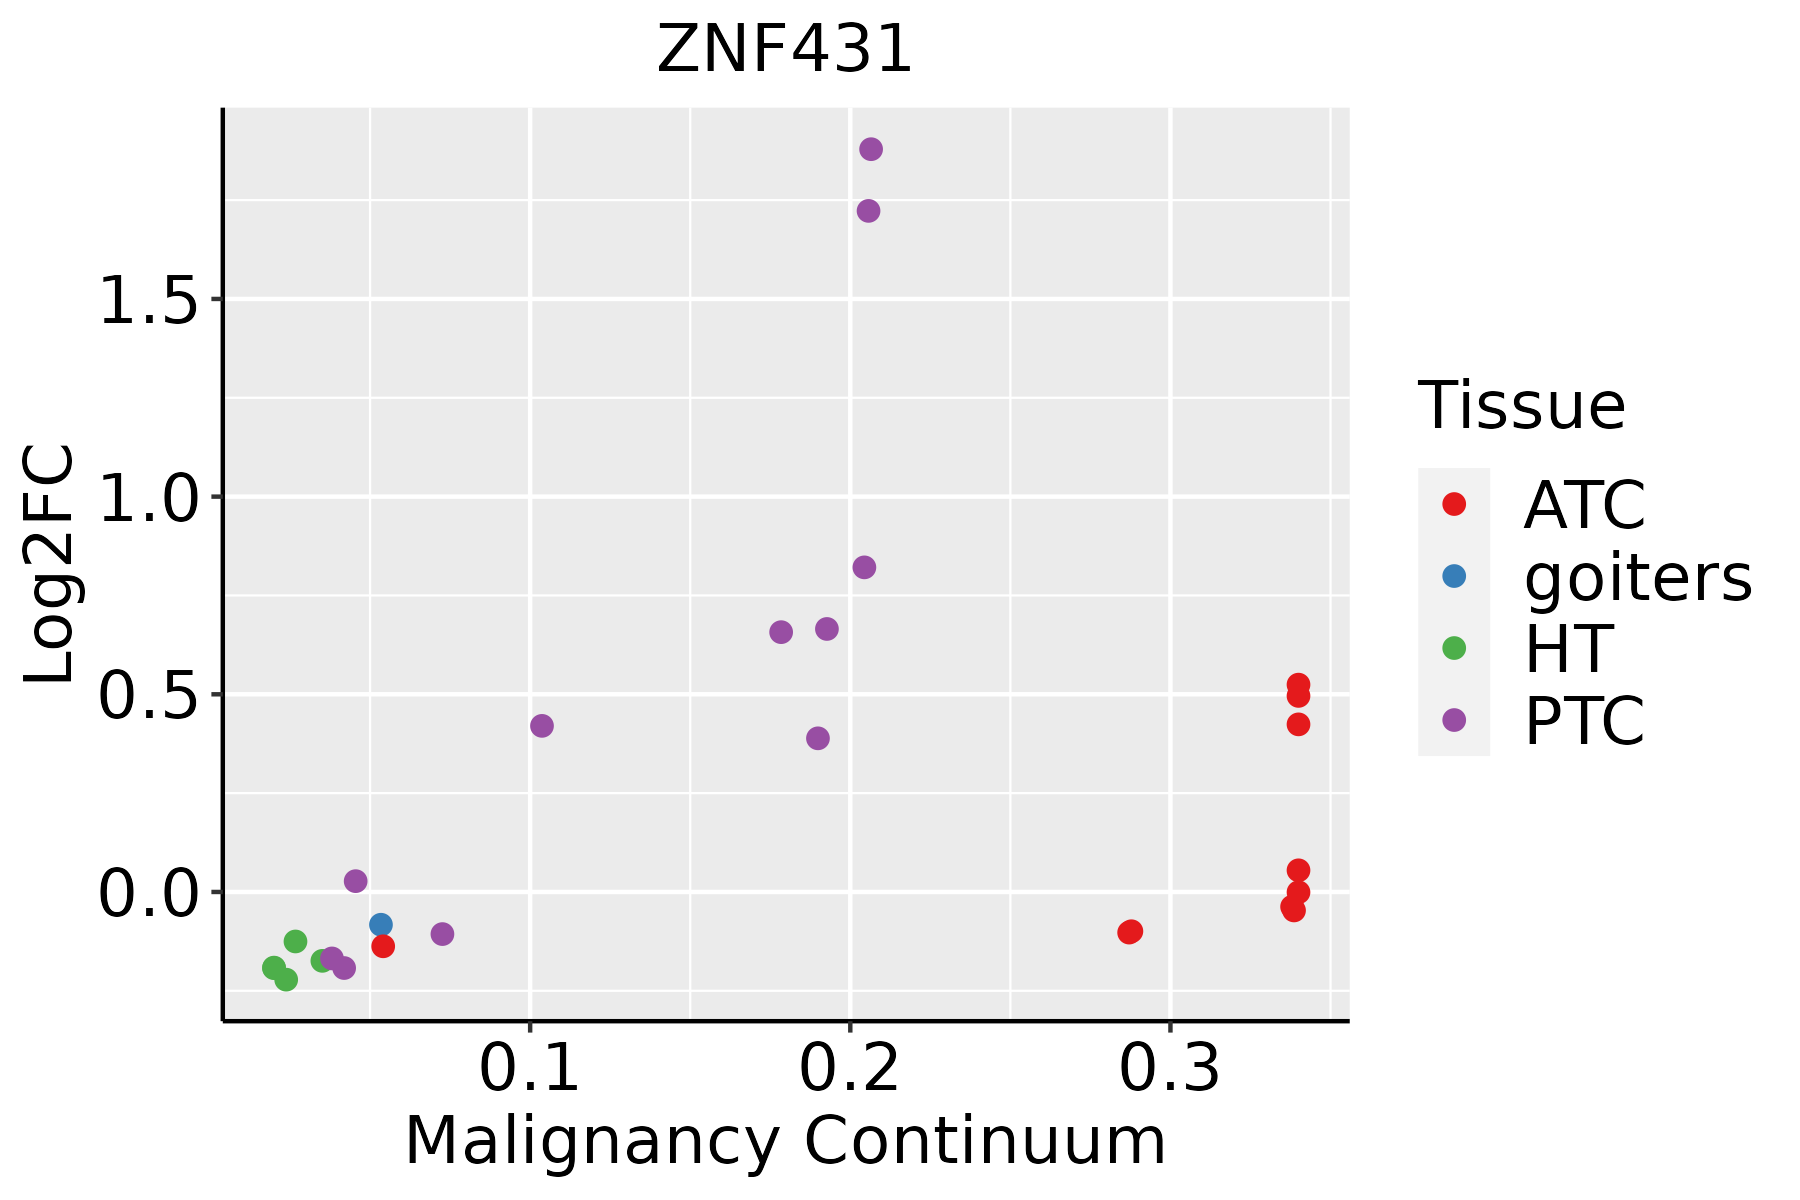 | ATC: Anaplastic thyroid cancer |
| HT: Hashimoto's thyroiditis | ||
| PTC: Papillary thyroid cancer |
| ∗log2FC in expression of this searched gene in stem-like cells from each diseased tissue sample relative to stem-like cells in normal samples in each tissue plotted against the malignancy continuum. Samples are colored based on if they are from different disease stage. |
Top |
Malignant transformation related pathway analysis |
| Find out the enriched GO biological processes and KEGG pathways involved in transition from healthy to precancer to cancer |
| Tissue | Disease Stage | Enriched GO biological Processes |
| Colorectum | AD |  |
| Colorectum | SER |  |
| Colorectum | MSS |  |
| Colorectum | MSI-H |  |
| Colorectum | FAP |  |
| ∗Top 15 enriched GO BP terms are showed in the bar plot of each disease state in each tissue. Each row represents a significant GO biological process which is colored according to the -log10(p.adjust). |
| Page: 1 2 3 4 5 6 7 8 9 |
| GO ID | Tissue | Disease Stage | Description | Gene Ratio | Bg Ratio | pvalue | p.adjust | Count |
| GO:00510908 | Esophagus | ESCC | regulation of DNA-binding transcription factor activity | 252/8552 | 440/18723 | 5.22e-07 | 6.97e-06 | 252 |
| GO:00434332 | Esophagus | ESCC | negative regulation of DNA-binding transcription factor activity | 103/8552 | 185/18723 | 3.86e-03 | 1.57e-02 | 103 |
| GO:00510902 | Liver | HCC | regulation of DNA-binding transcription factor activity | 220/7958 | 440/18723 | 8.04e-04 | 4.82e-03 | 220 |
| GO:005109016 | Thyroid | PTC | regulation of DNA-binding transcription factor activity | 178/5968 | 440/18723 | 7.63e-05 | 6.54e-04 | 178 |
| GO:005109022 | Thyroid | ATC | regulation of DNA-binding transcription factor activity | 190/6293 | 440/18723 | 1.49e-05 | 1.39e-04 | 190 |
| GO:00434333 | Thyroid | ATC | negative regulation of DNA-binding transcription factor activity | 79/6293 | 185/18723 | 5.96e-03 | 2.40e-02 | 79 |
| Page: 1 |
| Pathway ID | Tissue | Disease Stage | Description | Gene Ratio | Bg Ratio | pvalue | p.adjust | qvalue | Count |
| Page: 1 |
Top |
Cell-cell communication analysis |
| Identification of potential cell-cell interactions between two cell types and their ligand-receptor pairs for different disease states |
| Ligand | Receptor | LRpair | Pathway | Tissue | Disease Stage |
| Page: 1 |
Top |
Single-cell gene regulatory network inference analysis |
| Find out the significant the regulons (TFs) and the target genes of each regulon across cell types for different disease states |
| TF | Cell Type | Tissue | Disease Stage | Target Gene | RSS | Regulon Activity |
| ZNF431 | ICAF | Colorectum | CRC | DZIP1,PAPPA,ATPAF2, etc. | 3.75e-02 |  |
| ZNF431 | MVA | Colorectum | FAP | DZIP1,PAPPA,ATPAF2, etc. | 0.00e+00 |  |
| ZNF431 | ICAF | Colorectum | FAP | DZIP1,PAPPA,ATPAF2, etc. | 9.31e-03 | |
| ZNF431 | PCV | Colorectum | FAP | DZIP1,PAPPA,ATPAF2, etc. | 0.00e+00 | |
| ZNF431 | PLA | Lung | AAH | LINC00299,RAP2C,BACH2, etc. | 1.99e-02 |  |
| ZNF431 | BN | Lung | AAH | LINC00299,RAP2C,BACH2, etc. | 1.56e-02 | |
| ZNF431 | CD8TEREX | Lung | AAH | LINC00299,RAP2C,BACH2, etc. | 3.04e-02 | |
| ZNF431 | MAIT | Lung | AAH | LINC00299,RAP2C,BACH2, etc. | 4.21e-03 | |
| ∗The dot plots of a searched regulon are shown for all cell subpopulations in each disease state of each tissue based on the regulon specific score inferred using pySCENIC and by calculating the average expression. |
| Page: 1 |
Top |
Somatic mutation of malignant transformation related genes |
| Annotation of somatic variants for genes involved in malignant transformation |
| Hugo Symbol | Variant Class | Variant Classification | dbSNP RS | HGVSc | HGVSp | HGVSp Short | SWISSPROT | BIOTYPE | SIFT | PolyPhen | Tumor Sample Barcode | Tissue | Histology | Sex | Age | Stage | Therapy Types | Drugs | Outcome |
| ZNF431 | SNV | Missense_Mutation | c.1600C>T | p.His534Tyr | p.H534Y | Q8TF32 | protein_coding | deleterious(0.03) | benign(0.344) | TCGA-A8-A07B-01 | Breast | breast invasive carcinoma | Female | >=65 | I/II | Unknown | Unknown | SD | |
| ZNF431 | SNV | Missense_Mutation | c.163N>A | p.Ala55Thr | p.A55T | Q8TF32 | protein_coding | deleterious(0.03) | possibly_damaging(0.708) | TCGA-A8-A09Z-01 | Breast | breast invasive carcinoma | Female | >=65 | I/II | Unknown | Unknown | SD | |
| ZNF431 | SNV | Missense_Mutation | novel | c.618N>G | p.Cys206Trp | p.C206W | Q8TF32 | protein_coding | deleterious(0) | probably_damaging(0.993) | TCGA-AC-A23C-01 | Breast | breast invasive carcinoma | Female | <65 | I/II | Chemotherapy | chemo | CR |
| ZNF431 | SNV | Missense_Mutation | c.1175N>A | p.Arg392Lys | p.R392K | Q8TF32 | protein_coding | tolerated(0.32) | benign(0.041) | TCGA-AN-A046-01 | Breast | breast invasive carcinoma | Female | >=65 | I/II | Unknown | Unknown | SD | |
| ZNF431 | SNV | Missense_Mutation | novel | c.673N>G | p.Ile225Val | p.I225V | Q8TF32 | protein_coding | tolerated(0.06) | benign(0.344) | TCGA-BH-A2L8-01 | Breast | breast invasive carcinoma | Female | <65 | I/II | Chemotherapy | cytoxan | CR |
| ZNF431 | SNV | Missense_Mutation | c.491T>A | p.Leu164Gln | p.L164Q | Q8TF32 | protein_coding | deleterious(0.01) | possibly_damaging(0.903) | TCGA-E2-A10C-01 | Breast | breast invasive carcinoma | Female | <65 | I/II | Chemotherapy | cytoxan | SD | |
| ZNF431 | SNV | Missense_Mutation | c.797G>C | p.Gly266Ala | p.G266A | Q8TF32 | protein_coding | deleterious(0) | probably_damaging(0.99) | TCGA-E9-A22A-01 | Breast | breast invasive carcinoma | Female | >=65 | I/II | Hormone Therapy | tamoxiphen | SD | |
| ZNF431 | SNV | Missense_Mutation | c.407A>G | p.Lys136Arg | p.K136R | Q8TF32 | protein_coding | tolerated(0.1) | benign(0.259) | TCGA-GI-A2C8-01 | Breast | breast invasive carcinoma | Female | <65 | III/IV | Unspecific | Adriamycin | SD | |
| ZNF431 | SNV | Missense_Mutation | novel | c.859N>T | p.Pro287Ser | p.P287S | Q8TF32 | protein_coding | deleterious(0.04) | possibly_damaging(0.896) | TCGA-2W-A8YY-01 | Cervix | cervical & endocervical cancer | Female | <65 | I/II | Chemotherapy | cisplatin | CR |
| ZNF431 | SNV | Missense_Mutation | rs879217005 | c.1211T>A | p.Val404Glu | p.V404E | Q8TF32 | protein_coding | tolerated(1) | benign(0) | TCGA-DS-A1OA-01 | Cervix | cervical & endocervical cancer | Female | >=65 | I/II | Chemotherapy | carboplatin | PD |
| Page: 1 2 3 4 5 6 7 8 |
Top |
Related drugs of malignant transformation related genes |
| Identification of chemicals and drugs interact with genes involved in malignant transfromation |
| (DGIdb 4.0) |
| Entrez ID | Symbol | Category | Interaction Types | Drug Claim Name | Drug Name | PMIDs |
| Page: 1 |

Copyright 2023-Present -The University of Texas Health Science Center at Houston |