
|
|||||
|
 | |
| |
| |
| |
| |
| |
|
Gene: ZNF430 |
Gene summary for ZNF430 |
| Gene information | Species | Human | Gene symbol | ZNF430 | Gene ID | 80264 |
| Gene name | zinc finger protein 430 | |
| Gene Alias | ZNF430 | |
| Cytomap | 19p12 | |
| Gene Type | protein-coding | GO ID | GO:0006139 | UniProtAcc | A8K360 |
Top |
Malignant transformation analysis |
| Identification of the aberrant gene expression in precancerous and cancerous lesions by comparing the gene expression of stem-like cells in diseased tissues with normal stem cells |
| Entrez ID | Symbol | Replicates | Species | Organ | Tissue | Adj P-value | Log2FC | Malignancy |
| 80264 | ZNF430 | LZE4T | Human | Esophagus | ESCC | 7.33e-08 | 2.11e-01 | 0.0811 |
| 80264 | ZNF430 | LZE7T | Human | Esophagus | ESCC | 3.34e-10 | 7.58e-01 | 0.0667 |
| 80264 | ZNF430 | LZE20T | Human | Esophagus | ESCC | 2.87e-07 | 1.10e-01 | 0.0662 |
| 80264 | ZNF430 | LZE22T | Human | Esophagus | ESCC | 2.69e-02 | 1.64e-01 | 0.068 |
| 80264 | ZNF430 | LZE24T | Human | Esophagus | ESCC | 3.28e-07 | 3.27e-01 | 0.0596 |
| 80264 | ZNF430 | LZE6T | Human | Esophagus | ESCC | 2.70e-04 | 1.16e-01 | 0.0845 |
| 80264 | ZNF430 | P1T-E | Human | Esophagus | ESCC | 3.57e-04 | 3.44e-01 | 0.0875 |
| 80264 | ZNF430 | P2T-E | Human | Esophagus | ESCC | 1.00e-14 | 1.83e-01 | 0.1177 |
| 80264 | ZNF430 | P4T-E | Human | Esophagus | ESCC | 3.20e-24 | 4.92e-01 | 0.1323 |
| 80264 | ZNF430 | P5T-E | Human | Esophagus | ESCC | 8.11e-18 | 3.19e-01 | 0.1327 |
| 80264 | ZNF430 | P8T-E | Human | Esophagus | ESCC | 7.91e-25 | 4.43e-01 | 0.0889 |
| 80264 | ZNF430 | P10T-E | Human | Esophagus | ESCC | 1.30e-46 | 7.99e-01 | 0.116 |
| 80264 | ZNF430 | P11T-E | Human | Esophagus | ESCC | 1.99e-08 | 3.15e-01 | 0.1426 |
| 80264 | ZNF430 | P12T-E | Human | Esophagus | ESCC | 5.61e-26 | 6.44e-01 | 0.1122 |
| 80264 | ZNF430 | P15T-E | Human | Esophagus | ESCC | 4.89e-03 | 5.57e-03 | 0.1149 |
| 80264 | ZNF430 | P16T-E | Human | Esophagus | ESCC | 4.93e-10 | 1.59e-01 | 0.1153 |
| 80264 | ZNF430 | P20T-E | Human | Esophagus | ESCC | 1.01e-10 | 2.26e-01 | 0.1124 |
| 80264 | ZNF430 | P21T-E | Human | Esophagus | ESCC | 2.73e-13 | 1.48e-01 | 0.1617 |
| 80264 | ZNF430 | P22T-E | Human | Esophagus | ESCC | 2.72e-14 | 2.00e-01 | 0.1236 |
| 80264 | ZNF430 | P24T-E | Human | Esophagus | ESCC | 3.63e-06 | 8.48e-02 | 0.1287 |
| Page: 1 2 3 4 |
| Tissue | Expression Dynamics | Abbreviation |
| Esophagus | 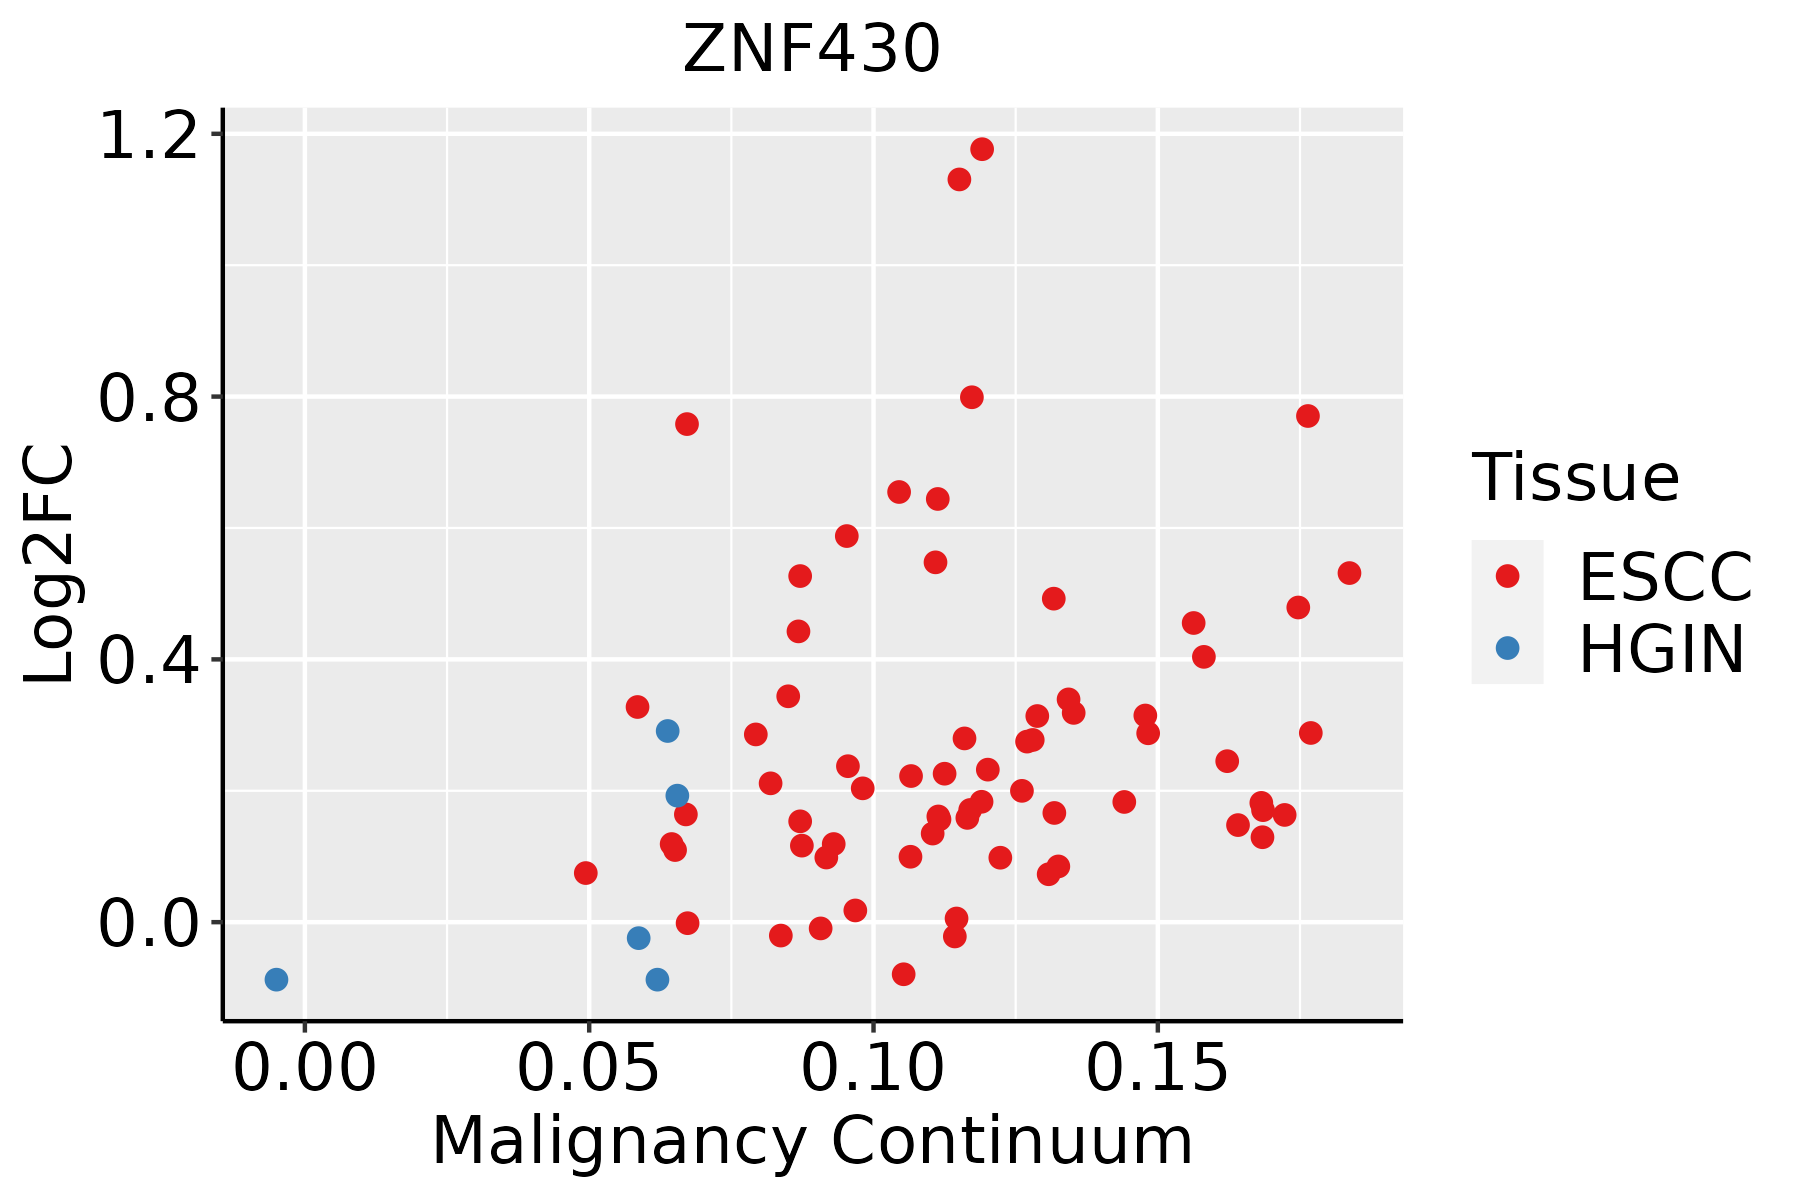 | ESCC: Esophageal squamous cell carcinoma |
| HGIN: High-grade intraepithelial neoplasias | ||
| LGIN: Low-grade intraepithelial neoplasias | ||
| Liver | 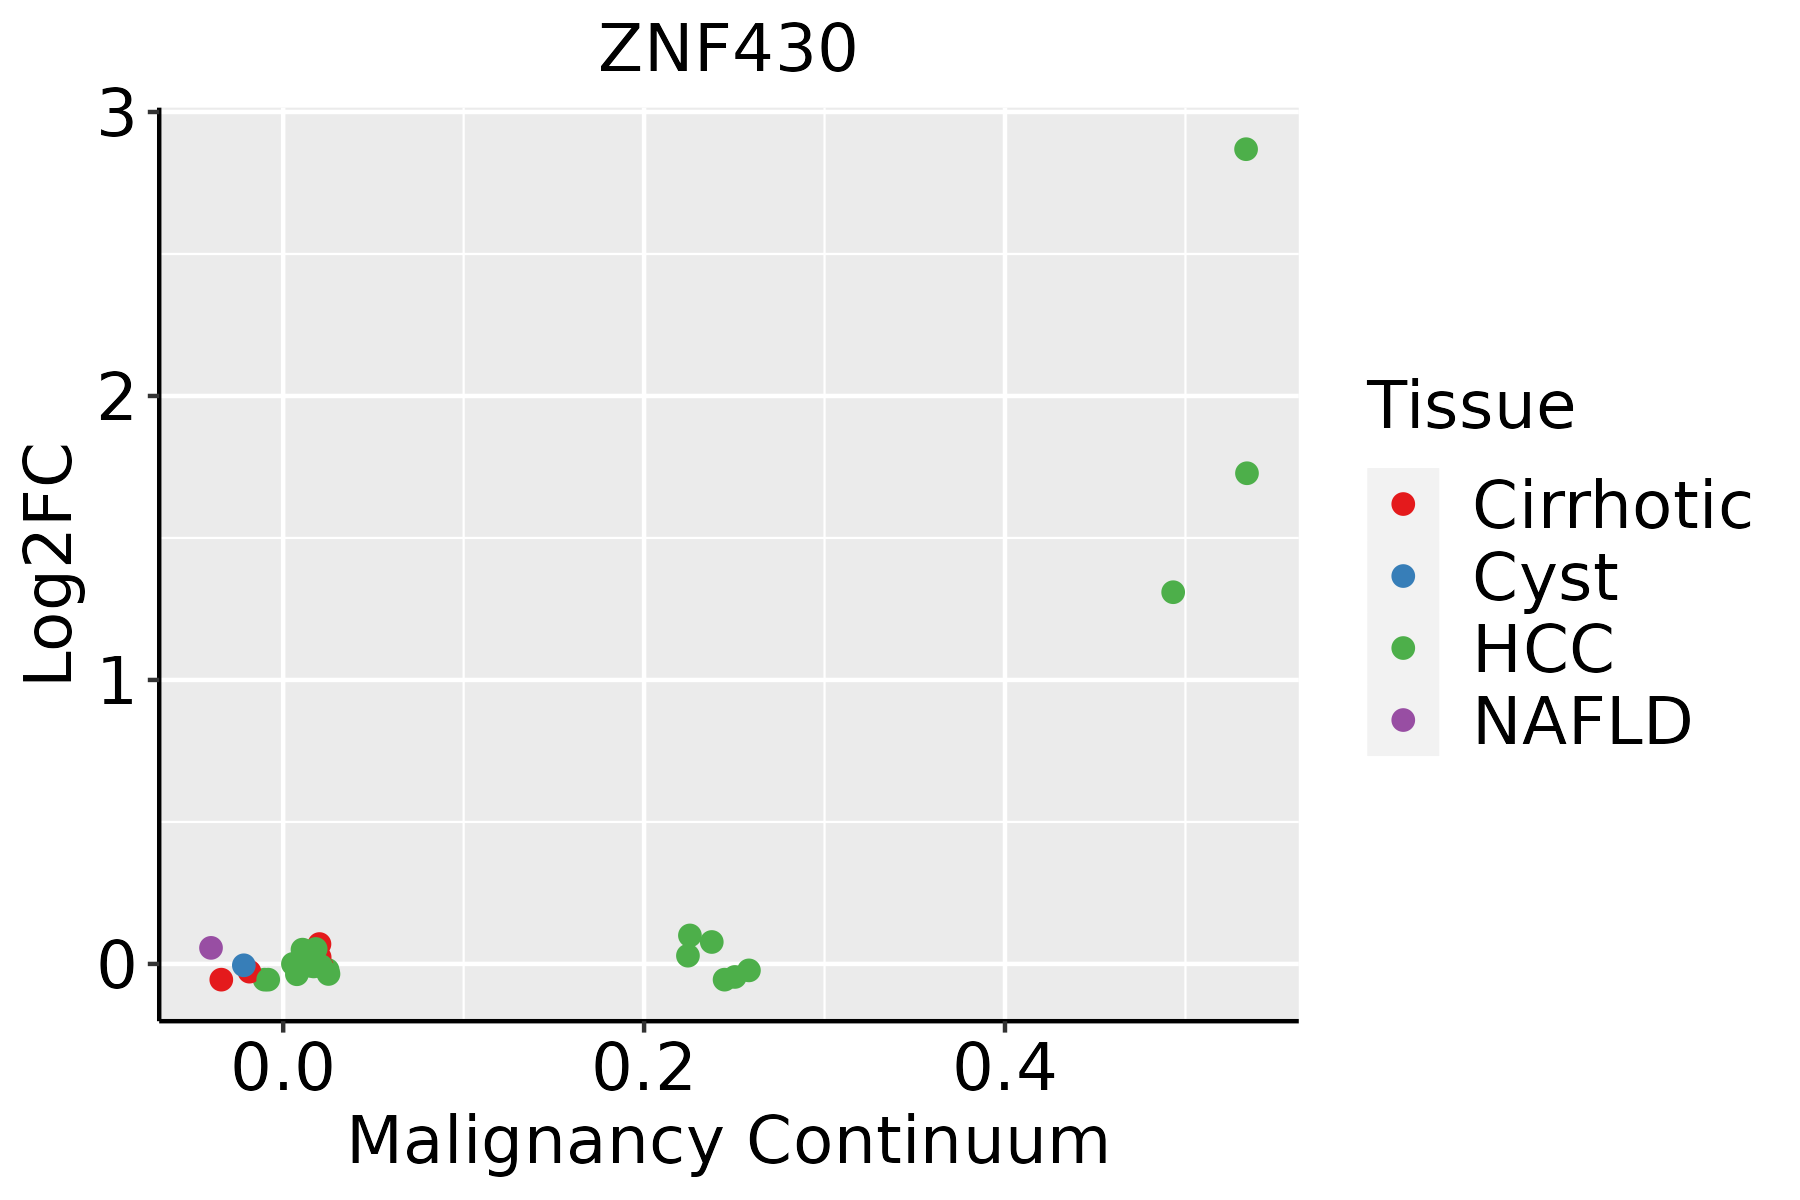 | HCC: Hepatocellular carcinoma |
| NAFLD: Non-alcoholic fatty liver disease | ||
| Thyroid | 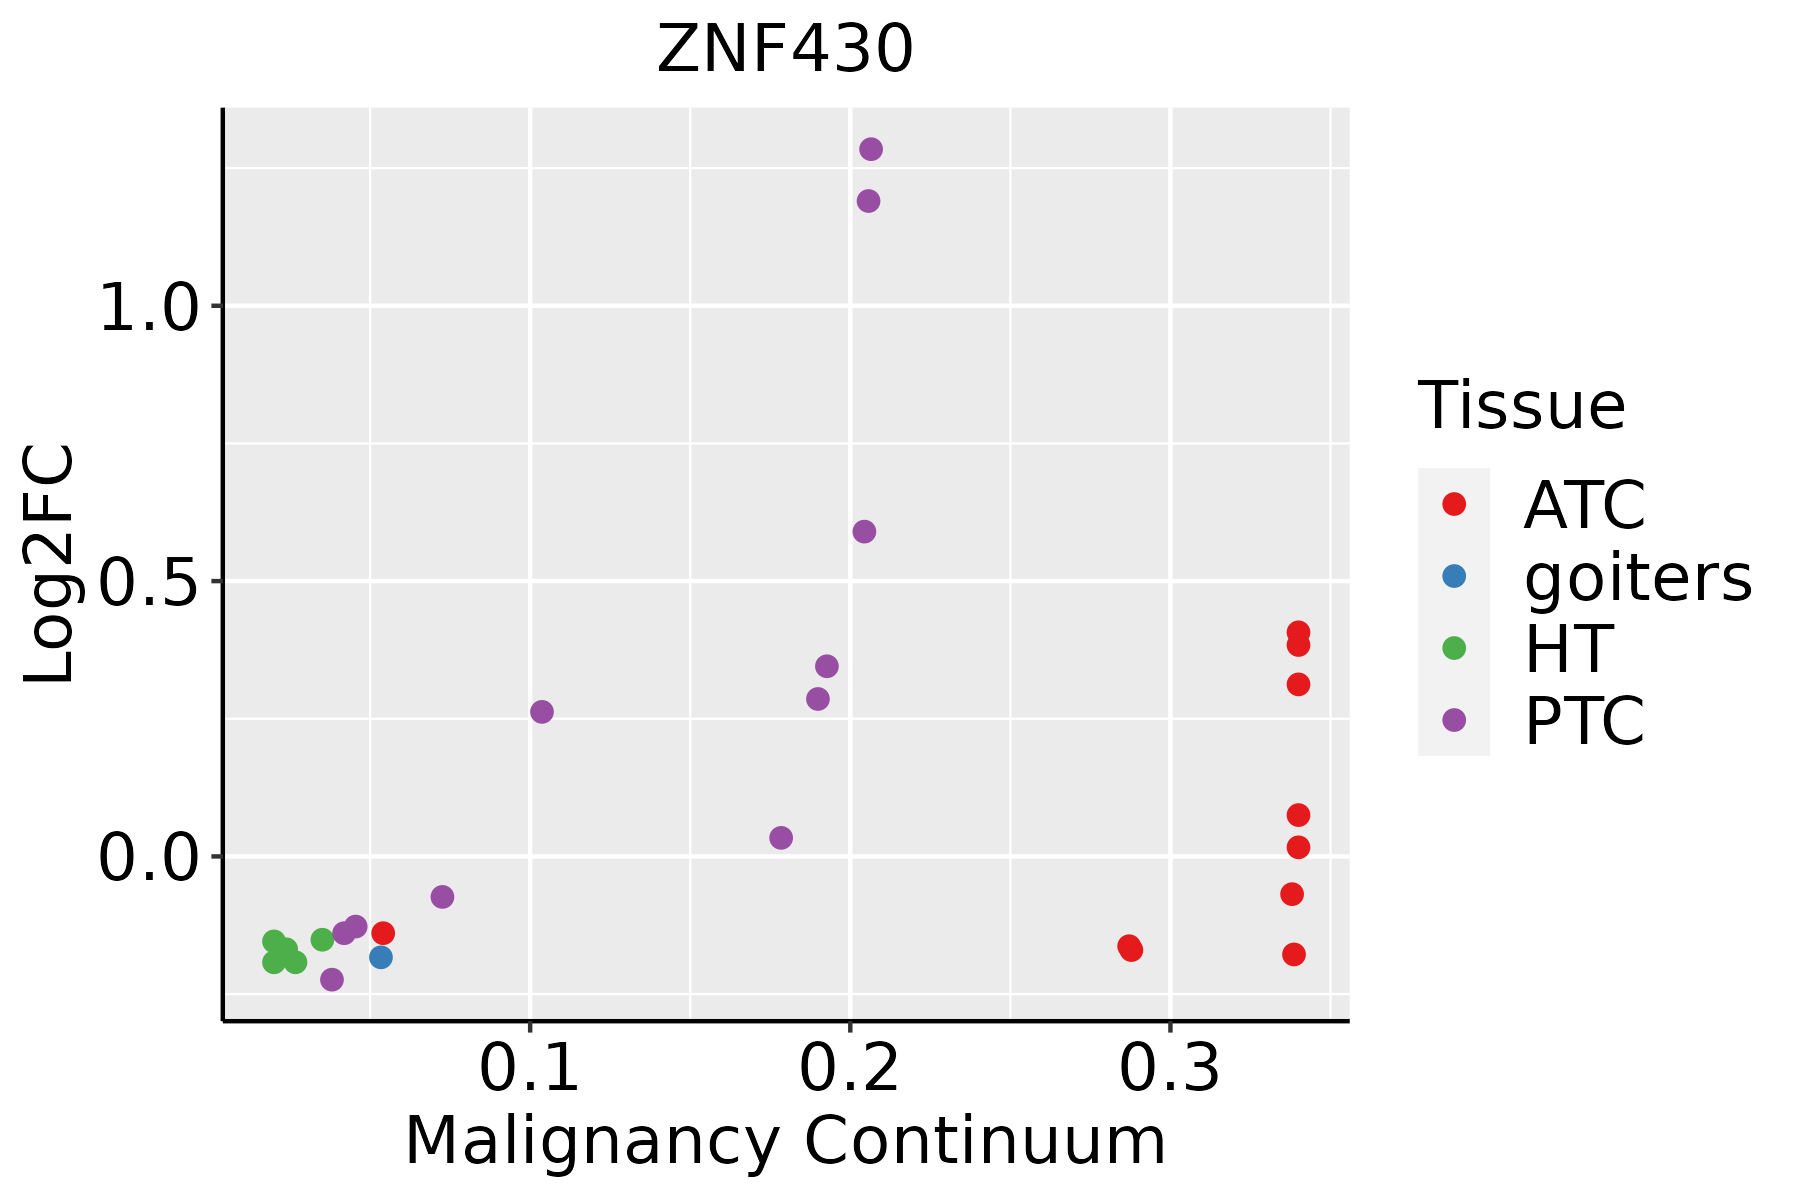 | ATC: Anaplastic thyroid cancer |
| HT: Hashimoto's thyroiditis | ||
| PTC: Papillary thyroid cancer |
| ∗log2FC in expression of this searched gene in stem-like cells from each diseased tissue sample relative to stem-like cells in normal samples in each tissue plotted against the malignancy continuum. Samples are colored based on if they are from different disease stage. |
Top |
Malignant transformation related pathway analysis |
| Find out the enriched GO biological processes and KEGG pathways involved in transition from healthy to precancer to cancer |
| Tissue | Disease Stage | Enriched GO biological Processes |
| Colorectum | AD |  |
| Colorectum | SER |  |
| Colorectum | MSS |  |
| Colorectum | MSI-H |  |
| Colorectum | FAP |  |
| ∗Top 15 enriched GO BP terms are showed in the bar plot of each disease state in each tissue. Each row represents a significant GO biological process which is colored according to the -log10(p.adjust). |
| Page: 1 2 3 4 5 6 7 8 9 |
| GO ID | Tissue | Disease Stage | Description | Gene Ratio | Bg Ratio | pvalue | p.adjust | Count |
| GO:0021762111 | Esophagus | ESCC | substantia nigra development | 35/8552 | 44/18723 | 4.40e-06 | 4.69e-05 | 35 |
| GO:004885718 | Esophagus | ESCC | neural nucleus development | 44/8552 | 64/18723 | 1.59e-04 | 1.05e-03 | 44 |
| GO:003090118 | Esophagus | ESCC | midbrain development | 58/8552 | 90/18723 | 2.52e-04 | 1.55e-03 | 58 |
| GO:002176222 | Liver | HCC | substantia nigra development | 33/7958 | 44/18723 | 1.21e-05 | 1.38e-04 | 33 |
| GO:003090121 | Liver | HCC | midbrain development | 54/7958 | 90/18723 | 6.04e-04 | 3.79e-03 | 54 |
| GO:004885722 | Liver | HCC | neural nucleus development | 38/7958 | 64/18723 | 4.78e-03 | 2.02e-02 | 38 |
| GO:0021762112 | Thyroid | PTC | substantia nigra development | 31/5968 | 44/18723 | 1.70e-07 | 3.19e-06 | 31 |
| GO:0030901111 | Thyroid | PTC | midbrain development | 48/5968 | 90/18723 | 1.95e-05 | 1.99e-04 | 48 |
| GO:0048857110 | Thyroid | PTC | neural nucleus development | 34/5968 | 64/18723 | 3.38e-04 | 2.33e-03 | 34 |
| GO:002176233 | Thyroid | ATC | substantia nigra development | 32/6293 | 44/18723 | 1.28e-07 | 2.12e-06 | 32 |
| GO:003090133 | Thyroid | ATC | midbrain development | 51/6293 | 90/18723 | 5.79e-06 | 6.13e-05 | 51 |
| GO:004885732 | Thyroid | ATC | neural nucleus development | 35/6293 | 64/18723 | 4.15e-04 | 2.50e-03 | 35 |
| Page: 1 |
| Pathway ID | Tissue | Disease Stage | Description | Gene Ratio | Bg Ratio | pvalue | p.adjust | qvalue | Count |
| Page: 1 |
Top |
Cell-cell communication analysis |
| Identification of potential cell-cell interactions between two cell types and their ligand-receptor pairs for different disease states |
| Ligand | Receptor | LRpair | Pathway | Tissue | Disease Stage |
| Page: 1 |
Top |
Single-cell gene regulatory network inference analysis |
| Find out the significant the regulons (TFs) and the target genes of each regulon across cell types for different disease states |
| TF | Cell Type | Tissue | Disease Stage | Target Gene | RSS | Regulon Activity |
| ZNF430 | M1MAC | Breast | ADJ | CCDC28A,TRAPPC2,SLFN13, etc. | 4.32e-02 |  |
| ZNF430 | PLA | Breast | IDC | CCDC28A,TRAPPC2,SLFN13, etc. | 1.41e-01 |  |
| ZNF430 | LYMEND | Colorectum | CRC | MAP3K11,FAM117A,DPY19L4, etc. | 2.94e-02 |  |
| ZNF430 | PERI | Colorectum | MSI-H | MAP3K11,FAM117A,DPY19L4, etc. | 1.84e-01 |  |
| ZNF430 | BN | Lung | AIS | AC092650.1,RMDN2,MYC, etc. | 1.24e-01 |  |
| ∗The dot plots of a searched regulon are shown for all cell subpopulations in each disease state of each tissue based on the regulon specific score inferred using pySCENIC and by calculating the average expression. |
| Page: 1 |
Top |
Somatic mutation of malignant transformation related genes |
| Annotation of somatic variants for genes involved in malignant transformation |
| Hugo Symbol | Variant Class | Variant Classification | dbSNP RS | HGVSc | HGVSp | HGVSp Short | SWISSPROT | BIOTYPE | SIFT | PolyPhen | Tumor Sample Barcode | Tissue | Histology | Sex | Age | Stage | Therapy Types | Drugs | Outcome |
| ZNF430 | SNV | Missense_Mutation | c.983N>A | p.Arg328Gln | p.R328Q | Q9H8G1 | protein_coding | tolerated(0.96) | benign(0.003) | TCGA-D8-A1JA-01 | Breast | breast invasive carcinoma | Female | <65 | III/IV | Chemotherapy | adriamycin | PD | |
| ZNF430 | insertion | Nonsense_Mutation | novel | c.806_807insAAAATAATAAAGGCCCTAATT | p.Ala269_Phe270insLysTerTerArgProTerPhe | p.A269_F270insK**RP*F | Q9H8G1 | protein_coding | TCGA-AR-A0U0-01 | Breast | breast invasive carcinoma | Female | >=65 | I/II | Unknown | Unknown | SD | ||
| ZNF430 | SNV | Missense_Mutation | novel | c.917N>T | p.Thr306Ile | p.T306I | Q9H8G1 | protein_coding | tolerated(0.15) | benign(0.076) | TCGA-2W-A8YY-01 | Cervix | cervical & endocervical cancer | Female | <65 | I/II | Chemotherapy | cisplatin | CR |
| ZNF430 | SNV | Missense_Mutation | rs199515644 | c.1151N>A | p.Arg384Gln | p.R384Q | Q9H8G1 | protein_coding | tolerated(0.99) | benign(0.005) | TCGA-LP-A5U2-01 | Cervix | cervical & endocervical cancer | Female | <65 | III/IV | Unknown | Unknown | SD |
| ZNF430 | SNV | Missense_Mutation | novel | c.194N>C | p.Leu65Ser | p.L65S | Q9H8G1 | protein_coding | deleterious(0) | probably_damaging(1) | TCGA-A6-2672-01 | Colorectum | colon adenocarcinoma | Female | >=65 | III/IV | Unknown | Unknown | SD |
| ZNF430 | SNV | Missense_Mutation | c.1145N>G | p.Phe382Cys | p.F382C | Q9H8G1 | protein_coding | deleterious(0) | probably_damaging(1) | TCGA-AA-3510-01 | Colorectum | colon adenocarcinoma | Male | >=65 | I/II | Unknown | Unknown | SD | |
| ZNF430 | SNV | Missense_Mutation | c.501G>C | p.Gln167His | p.Q167H | Q9H8G1 | protein_coding | deleterious(0.03) | benign(0.062) | TCGA-AA-3678-01 | Colorectum | colon adenocarcinoma | Female | <65 | III/IV | Chemotherapy | folinic | CR | |
| ZNF430 | SNV | Missense_Mutation | rs775831110 | c.842N>C | p.Ile281Thr | p.I281T | Q9H8G1 | protein_coding | tolerated(0.52) | benign(0.055) | TCGA-AA-3710-01 | Colorectum | colon adenocarcinoma | Female | >=65 | I/II | Unknown | Unknown | SD |
| ZNF430 | SNV | Missense_Mutation | rs759878122 | c.524A>G | p.Glu175Gly | p.E175G | Q9H8G1 | protein_coding | deleterious(0) | benign(0.071) | TCGA-AA-3977-01 | Colorectum | colon adenocarcinoma | Male | >=65 | I/II | Unknown | Unknown | SD |
| ZNF430 | SNV | Missense_Mutation | c.758G>T | p.Arg253Ile | p.R253I | Q9H8G1 | protein_coding | tolerated(0.39) | benign(0.172) | TCGA-AA-A010-01 | Colorectum | colon adenocarcinoma | Female | <65 | I/II | Chemotherapy | folinic | CR |
| Page: 1 2 3 4 5 6 7 8 |
Top |
Related drugs of malignant transformation related genes |
| Identification of chemicals and drugs interact with genes involved in malignant transfromation |
| (DGIdb 4.0) |
| Entrez ID | Symbol | Category | Interaction Types | Drug Claim Name | Drug Name | PMIDs |
| Page: 1 |

Copyright 2023-Present -The University of Texas Health Science Center at Houston |