
|
|||||
|
 | |
| |
| |
| |
| |
| |
|
Gene: ZNF43 |
Gene summary for ZNF43 |
| Gene information | Species | Human | Gene symbol | ZNF43 | Gene ID | 7594 |
| Gene name | zinc finger protein 43 | |
| Gene Alias | HTF6 | |
| Cytomap | 19p12 | |
| Gene Type | protein-coding | GO ID | GO:0006139 | UniProtAcc | A0A024R7P7 |
Top |
Malignant transformation analysis |
| Identification of the aberrant gene expression in precancerous and cancerous lesions by comparing the gene expression of stem-like cells in diseased tissues with normal stem cells |
| Entrez ID | Symbol | Replicates | Species | Organ | Tissue | Adj P-value | Log2FC | Malignancy |
| 7594 | ZNF43 | cirrhotic2 | Human | Liver | Cirrhotic | 8.28e-03 | 3.76e-02 | 0.0201 |
| 7594 | ZNF43 | HCC1 | Human | Liver | HCC | 3.14e-04 | 3.12e+00 | 0.5336 |
| 7594 | ZNF43 | HCC2 | Human | Liver | HCC | 1.43e-15 | 2.76e+00 | 0.5341 |
| 7594 | ZNF43 | male-WTA | Human | Thyroid | PTC | 2.44e-08 | 1.29e-01 | 0.1037 |
| 7594 | ZNF43 | PTC01 | Human | Thyroid | PTC | 8.23e-06 | 1.94e-01 | 0.1899 |
| 7594 | ZNF43 | PTC04 | Human | Thyroid | PTC | 2.08e-09 | 1.13e-01 | 0.1927 |
| 7594 | ZNF43 | PTC05 | Human | Thyroid | PTC | 5.98e-24 | 8.42e-01 | 0.2065 |
| 7594 | ZNF43 | PTC06 | Human | Thyroid | PTC | 1.27e-13 | 4.03e-01 | 0.2057 |
| 7594 | ZNF43 | PTC07 | Human | Thyroid | PTC | 2.85e-14 | 3.35e-01 | 0.2044 |
| 7594 | ZNF43 | ATC13 | Human | Thyroid | ATC | 1.88e-33 | 5.10e-01 | 0.34 |
| 7594 | ZNF43 | ATC4 | Human | Thyroid | ATC | 4.77e-06 | 9.05e-02 | 0.34 |
| 7594 | ZNF43 | ATC5 | Human | Thyroid | ATC | 8.78e-31 | 5.67e-01 | 0.34 |
| Page: 1 |
| Tissue | Expression Dynamics | Abbreviation |
| Liver | 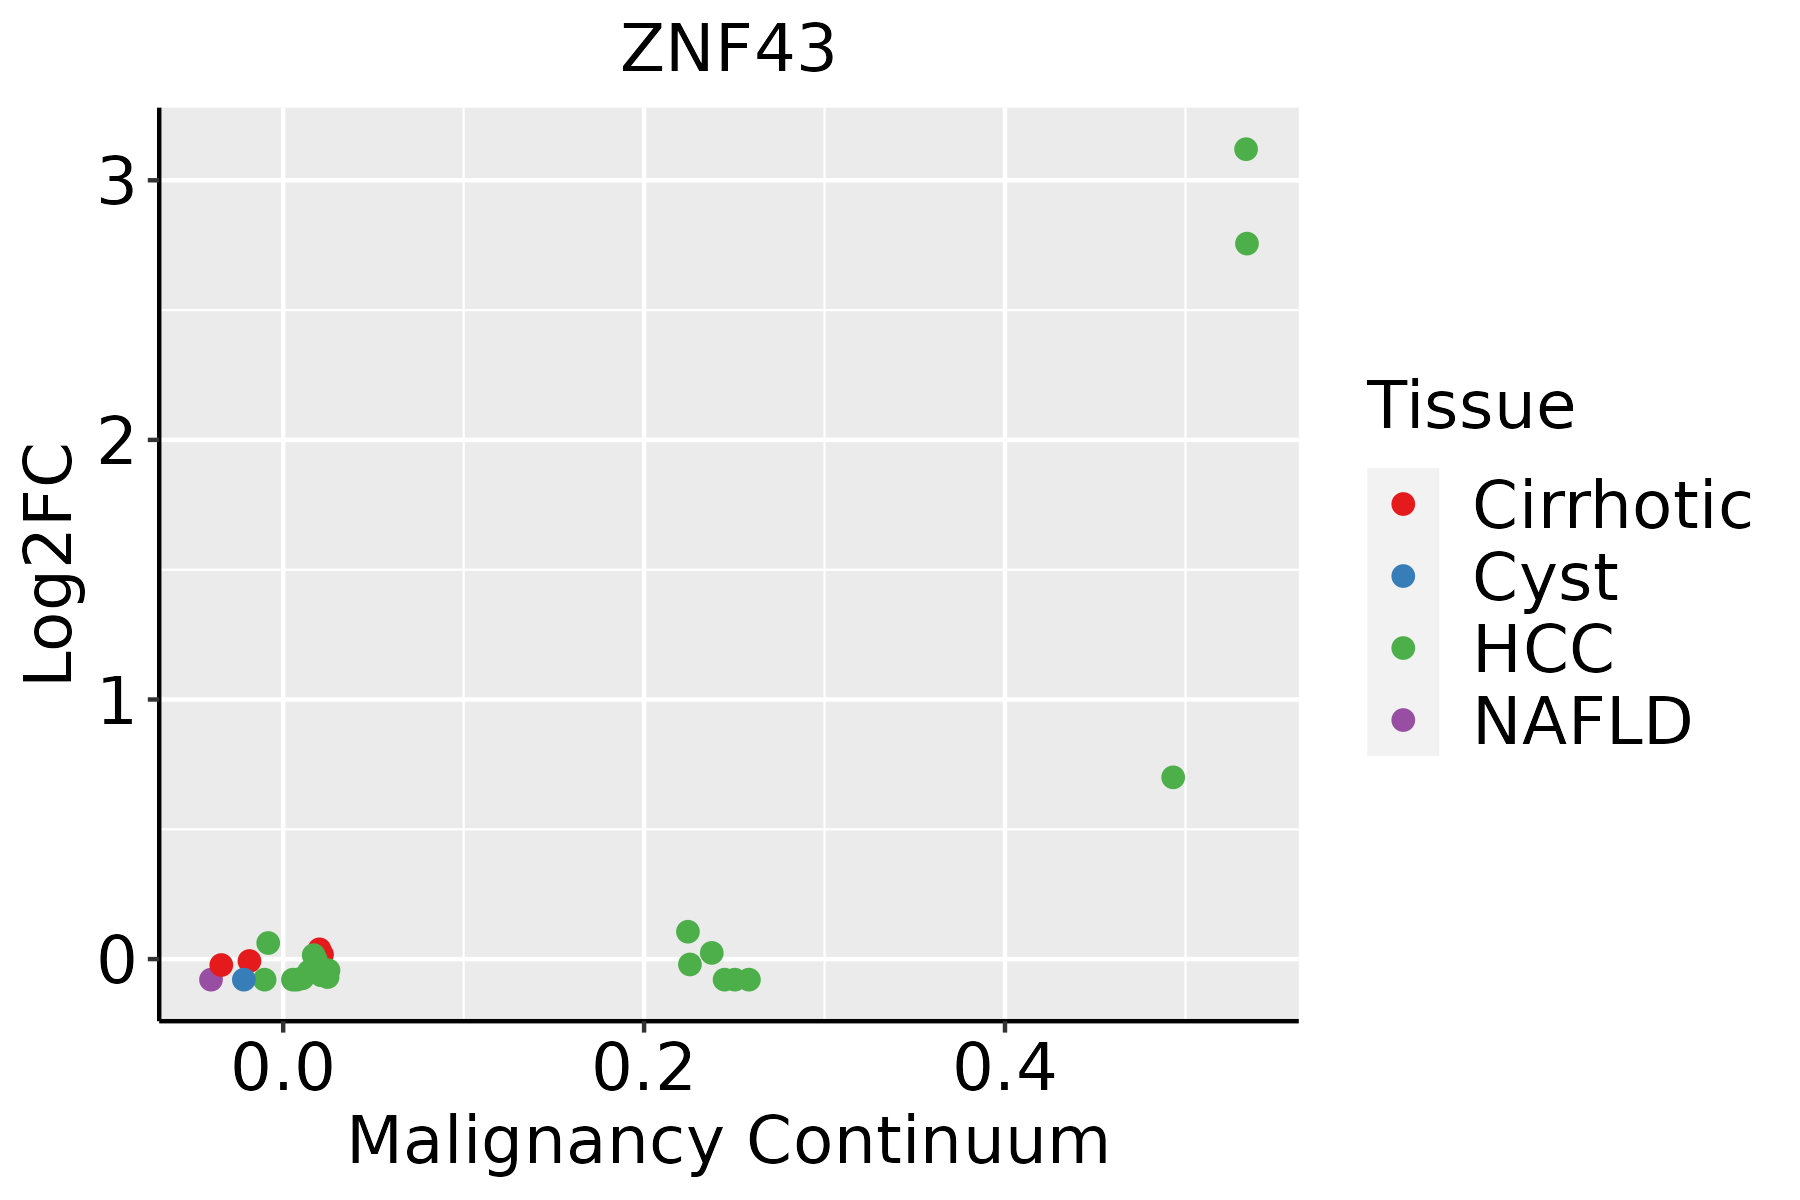 | HCC: Hepatocellular carcinoma |
| NAFLD: Non-alcoholic fatty liver disease | ||
| Thyroid | 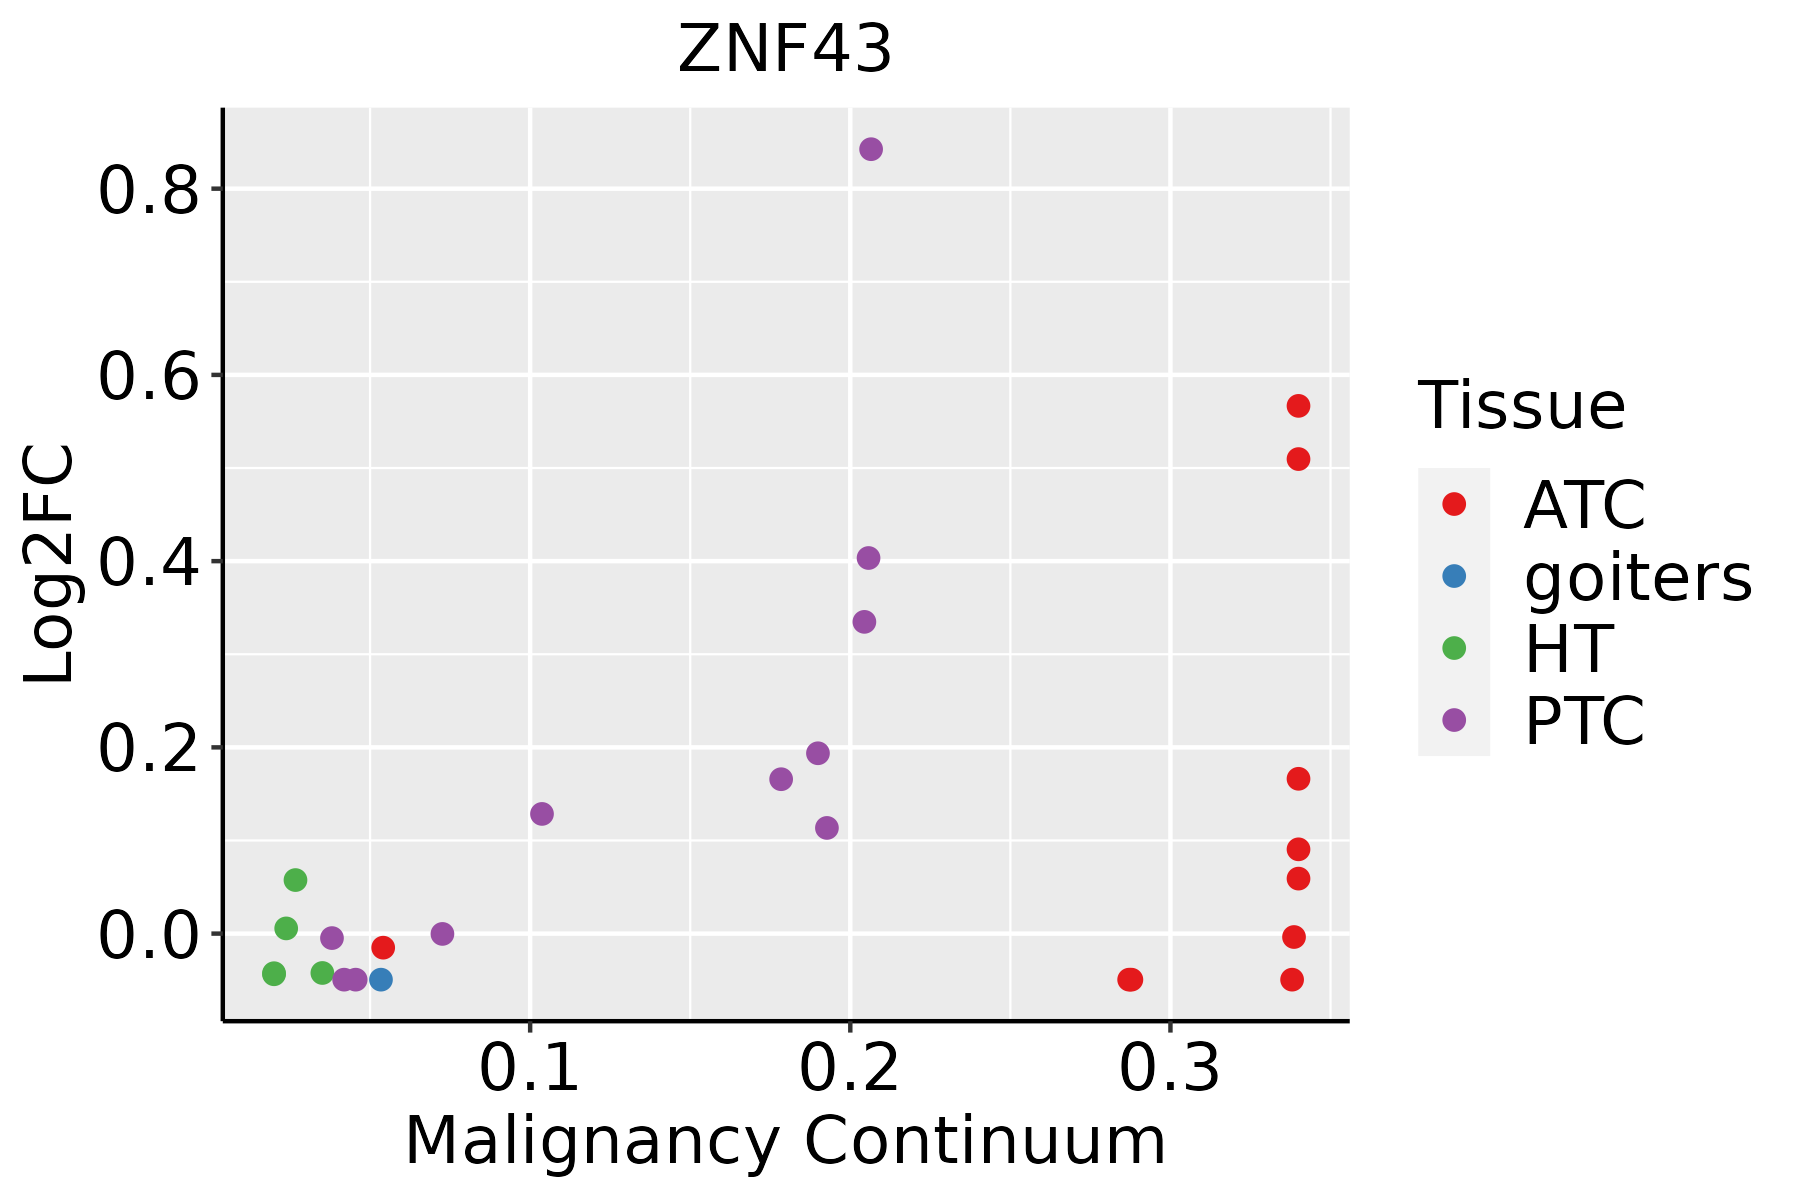 | ATC: Anaplastic thyroid cancer |
| HT: Hashimoto's thyroiditis | ||
| PTC: Papillary thyroid cancer |
| ∗log2FC in expression of this searched gene in stem-like cells from each diseased tissue sample relative to stem-like cells in normal samples in each tissue plotted against the malignancy continuum. Samples are colored based on if they are from different disease stage. |
Top |
Malignant transformation related pathway analysis |
| Find out the enriched GO biological processes and KEGG pathways involved in transition from healthy to precancer to cancer |
| Tissue | Disease Stage | Enriched GO biological Processes |
| Colorectum | AD |  |
| Colorectum | SER |  |
| Colorectum | MSS |  |
| Colorectum | MSI-H |  |
| Colorectum | FAP |  |
| ∗Top 15 enriched GO BP terms are showed in the bar plot of each disease state in each tissue. Each row represents a significant GO biological process which is colored according to the -log10(p.adjust). |
| Page: 1 2 3 4 5 6 7 8 9 |
| GO ID | Tissue | Disease Stage | Description | Gene Ratio | Bg Ratio | pvalue | p.adjust | Count |
| GO:00510908 | Esophagus | ESCC | regulation of DNA-binding transcription factor activity | 252/8552 | 440/18723 | 5.22e-07 | 6.97e-06 | 252 |
| GO:0021762111 | Esophagus | ESCC | substantia nigra development | 35/8552 | 44/18723 | 4.40e-06 | 4.69e-05 | 35 |
| GO:004885718 | Esophagus | ESCC | neural nucleus development | 44/8552 | 64/18723 | 1.59e-04 | 1.05e-03 | 44 |
| GO:003090118 | Esophagus | ESCC | midbrain development | 58/8552 | 90/18723 | 2.52e-04 | 1.55e-03 | 58 |
| GO:00434332 | Esophagus | ESCC | negative regulation of DNA-binding transcription factor activity | 103/8552 | 185/18723 | 3.86e-03 | 1.57e-02 | 103 |
| GO:002176222 | Liver | HCC | substantia nigra development | 33/7958 | 44/18723 | 1.21e-05 | 1.38e-04 | 33 |
| GO:003090121 | Liver | HCC | midbrain development | 54/7958 | 90/18723 | 6.04e-04 | 3.79e-03 | 54 |
| GO:00510902 | Liver | HCC | regulation of DNA-binding transcription factor activity | 220/7958 | 440/18723 | 8.04e-04 | 4.82e-03 | 220 |
| GO:004885722 | Liver | HCC | neural nucleus development | 38/7958 | 64/18723 | 4.78e-03 | 2.02e-02 | 38 |
| GO:0021762112 | Thyroid | PTC | substantia nigra development | 31/5968 | 44/18723 | 1.70e-07 | 3.19e-06 | 31 |
| GO:0030901111 | Thyroid | PTC | midbrain development | 48/5968 | 90/18723 | 1.95e-05 | 1.99e-04 | 48 |
| GO:005109016 | Thyroid | PTC | regulation of DNA-binding transcription factor activity | 178/5968 | 440/18723 | 7.63e-05 | 6.54e-04 | 178 |
| GO:0048857110 | Thyroid | PTC | neural nucleus development | 34/5968 | 64/18723 | 3.38e-04 | 2.33e-03 | 34 |
| GO:002176233 | Thyroid | ATC | substantia nigra development | 32/6293 | 44/18723 | 1.28e-07 | 2.12e-06 | 32 |
| GO:003090133 | Thyroid | ATC | midbrain development | 51/6293 | 90/18723 | 5.79e-06 | 6.13e-05 | 51 |
| GO:005109022 | Thyroid | ATC | regulation of DNA-binding transcription factor activity | 190/6293 | 440/18723 | 1.49e-05 | 1.39e-04 | 190 |
| GO:004885732 | Thyroid | ATC | neural nucleus development | 35/6293 | 64/18723 | 4.15e-04 | 2.50e-03 | 35 |
| GO:00434333 | Thyroid | ATC | negative regulation of DNA-binding transcription factor activity | 79/6293 | 185/18723 | 5.96e-03 | 2.40e-02 | 79 |
| Page: 1 |
| Pathway ID | Tissue | Disease Stage | Description | Gene Ratio | Bg Ratio | pvalue | p.adjust | qvalue | Count |
| Page: 1 |
Top |
Cell-cell communication analysis |
| Identification of potential cell-cell interactions between two cell types and their ligand-receptor pairs for different disease states |
| Ligand | Receptor | LRpair | Pathway | Tissue | Disease Stage |
| Page: 1 |
Top |
Single-cell gene regulatory network inference analysis |
| Find out the significant the regulons (TFs) and the target genes of each regulon across cell types for different disease states |
| TF | Cell Type | Tissue | Disease Stage | Target Gene | RSS | Regulon Activity |
| ZNF43 | FIB | Cervix | HSIL_HPV | PCDHGA8,LCN6,MFSD14A, etc. | 5.36e-02 |  |
| ZNF43 | MYOFIB | Cervix | N_HPV | PCDHGA8,LCN6,MFSD14A, etc. | 4.50e-02 |  |
| ZNF43 | PIL | Skin | ADJ | SOX4,BHLHE41,ZNF91, etc. | 7.29e-02 |  |
| ZNF43 | PIL | Skin | cSCC | SOX4,BHLHE41,ZNF91, etc. | 3.27e-02 |  |
| ∗The dot plots of a searched regulon are shown for all cell subpopulations in each disease state of each tissue based on the regulon specific score inferred using pySCENIC and by calculating the average expression. |
| Page: 1 |
Top |
Somatic mutation of malignant transformation related genes |
| Annotation of somatic variants for genes involved in malignant transformation |
| Hugo Symbol | Variant Class | Variant Classification | dbSNP RS | HGVSc | HGVSp | HGVSp Short | SWISSPROT | BIOTYPE | SIFT | PolyPhen | Tumor Sample Barcode | Tissue | Histology | Sex | Age | Stage | Therapy Types | Drugs | Outcome |
| ZNF43 | SNV | Missense_Mutation | rs144229123 | c.1406N>T | p.Gly469Val | p.G469V | protein_coding | deleterious(0) | probably_damaging(0.999) | TCGA-A2-A1FW-01 | Breast | breast invasive carcinoma | Female | <65 | III/IV | Chemotherapy | cytoxan | SD | |
| ZNF43 | SNV | Missense_Mutation | c.2407N>C | p.Asp803His | p.D803H | protein_coding | deleterious(0) | possibly_damaging(0.471) | TCGA-A8-A095-01 | Breast | breast invasive carcinoma | Female | <65 | I/II | Chemotherapy | 5-fluorouracil | CR | ||
| ZNF43 | SNV | Missense_Mutation | c.1453N>T | p.His485Tyr | p.H485Y | protein_coding | deleterious(0.02) | probably_damaging(0.916) | TCGA-AC-A23H-01 | Breast | breast invasive carcinoma | Female | >=65 | I/II | Unknown | Unknown | PD | ||
| ZNF43 | SNV | Missense_Mutation | novel | c.137N>G | p.Tyr46Cys | p.Y46C | protein_coding | deleterious(0) | probably_damaging(0.966) | TCGA-AC-A3QP-01 | Breast | breast invasive carcinoma | Female | >=65 | I/II | Hormone Therapy | femara | SD | |
| ZNF43 | SNV | Missense_Mutation | rs750782917 | c.261N>A | p.Met87Ile | p.M87I | protein_coding | tolerated(0.6) | benign(0.094) | TCGA-AR-A0TV-01 | Breast | breast invasive carcinoma | Female | >=65 | I/II | Unknown | Unknown | SD | |
| ZNF43 | SNV | Missense_Mutation | c.1714G>C | p.Glu572Gln | p.E572Q | protein_coding | deleterious(0.01) | probably_damaging(0.966) | TCGA-B6-A0WX-01 | Breast | breast invasive carcinoma | Female | <65 | III/IV | Unknown | Unknown | PD | ||
| ZNF43 | SNV | Missense_Mutation | rs768755727 | c.791A>G | p.Tyr264Cys | p.Y264C | protein_coding | deleterious(0) | possibly_damaging(0.465) | TCGA-C8-A27B-01 | Breast | breast invasive carcinoma | Female | <65 | I/II | Chemotherapy | 5-fluorouracil | CR | |
| ZNF43 | SNV | Missense_Mutation | c.394N>A | p.Glu132Lys | p.E132K | protein_coding | tolerated(0.15) | benign(0) | TCGA-C8-A8HP-01 | Breast | breast invasive carcinoma | Female | <65 | III/IV | Chemotherapy | 5-fluorouracil | CR | ||
| ZNF43 | SNV | Missense_Mutation | c.2340N>A | p.Phe780Leu | p.F780L | protein_coding | deleterious(0.01) | possibly_damaging(0.908) | TCGA-D8-A27G-01 | Breast | breast invasive carcinoma | Female | >=65 | I/II | Unknown | Unknown | SD | ||
| ZNF43 | SNV | Missense_Mutation | c.2411N>A | p.Val804Glu | p.V804E | protein_coding | deleterious(0.01) | possibly_damaging(0.447) | TCGA-E2-A1LH-01 | Breast | breast invasive carcinoma | Female | <65 | I/II | Chemotherapy | adriamycin | SD |
| Page: 1 2 3 4 5 6 7 8 9 10 11 12 13 14 15 16 |
Top |
Related drugs of malignant transformation related genes |
| Identification of chemicals and drugs interact with genes involved in malignant transfromation |
| (DGIdb 4.0) |
| Entrez ID | Symbol | Category | Interaction Types | Drug Claim Name | Drug Name | PMIDs |
| Page: 1 |

Copyright 2023-Present -The University of Texas Health Science Center at Houston |