
|
|||||
|
 | |
| |
| |
| |
| |
| |
|
Gene: ZNF426 |
Gene summary for ZNF426 |
| Gene information | Species | Human | Gene symbol | ZNF426 | Gene ID | 79088 |
| Gene name | zinc finger protein 426 | |
| Gene Alias | K-RBP | |
| Cytomap | 19p13.2 | |
| Gene Type | protein-coding | GO ID | GO:0006139 | UniProtAcc | K7ER43 |
Top |
Malignant transformation analysis |
| Identification of the aberrant gene expression in precancerous and cancerous lesions by comparing the gene expression of stem-like cells in diseased tissues with normal stem cells |
| Entrez ID | Symbol | Replicates | Species | Organ | Tissue | Adj P-value | Log2FC | Malignancy |
| 79088 | ZNF426 | LZE5T | Human | Esophagus | ESCC | 1.57e-02 | 2.08e-01 | 0.0514 |
| 79088 | ZNF426 | LZE8T | Human | Esophagus | ESCC | 1.10e-02 | 7.76e-02 | 0.067 |
| 79088 | ZNF426 | LZE20T | Human | Esophagus | ESCC | 7.18e-07 | 2.07e-01 | 0.0662 |
| 79088 | ZNF426 | LZE24T | Human | Esophagus | ESCC | 2.65e-05 | 1.27e-01 | 0.0596 |
| 79088 | ZNF426 | LZE21T | Human | Esophagus | ESCC | 1.37e-06 | 3.00e-01 | 0.0655 |
| 79088 | ZNF426 | P1T-E | Human | Esophagus | ESCC | 1.05e-09 | 3.04e-01 | 0.0875 |
| 79088 | ZNF426 | P2T-E | Human | Esophagus | ESCC | 2.83e-25 | 4.09e-01 | 0.1177 |
| 79088 | ZNF426 | P4T-E | Human | Esophagus | ESCC | 5.16e-10 | 1.91e-01 | 0.1323 |
| 79088 | ZNF426 | P5T-E | Human | Esophagus | ESCC | 1.30e-07 | 1.56e-01 | 0.1327 |
| 79088 | ZNF426 | P8T-E | Human | Esophagus | ESCC | 1.88e-16 | 3.33e-01 | 0.0889 |
| 79088 | ZNF426 | P9T-E | Human | Esophagus | ESCC | 2.38e-11 | 2.16e-01 | 0.1131 |
| 79088 | ZNF426 | P10T-E | Human | Esophagus | ESCC | 8.82e-23 | 3.72e-01 | 0.116 |
| 79088 | ZNF426 | P11T-E | Human | Esophagus | ESCC | 3.25e-05 | 2.08e-01 | 0.1426 |
| 79088 | ZNF426 | P12T-E | Human | Esophagus | ESCC | 4.28e-16 | 2.88e-01 | 0.1122 |
| 79088 | ZNF426 | P15T-E | Human | Esophagus | ESCC | 3.16e-13 | 2.03e-01 | 0.1149 |
| 79088 | ZNF426 | P16T-E | Human | Esophagus | ESCC | 7.05e-12 | 2.92e-01 | 0.1153 |
| 79088 | ZNF426 | P17T-E | Human | Esophagus | ESCC | 4.79e-04 | 1.63e-01 | 0.1278 |
| 79088 | ZNF426 | P20T-E | Human | Esophagus | ESCC | 6.20e-06 | 1.28e-01 | 0.1124 |
| 79088 | ZNF426 | P21T-E | Human | Esophagus | ESCC | 3.65e-12 | 2.67e-01 | 0.1617 |
| 79088 | ZNF426 | P24T-E | Human | Esophagus | ESCC | 2.68e-06 | 1.22e-01 | 0.1287 |
| Page: 1 2 3 |
| Tissue | Expression Dynamics | Abbreviation |
| Esophagus | 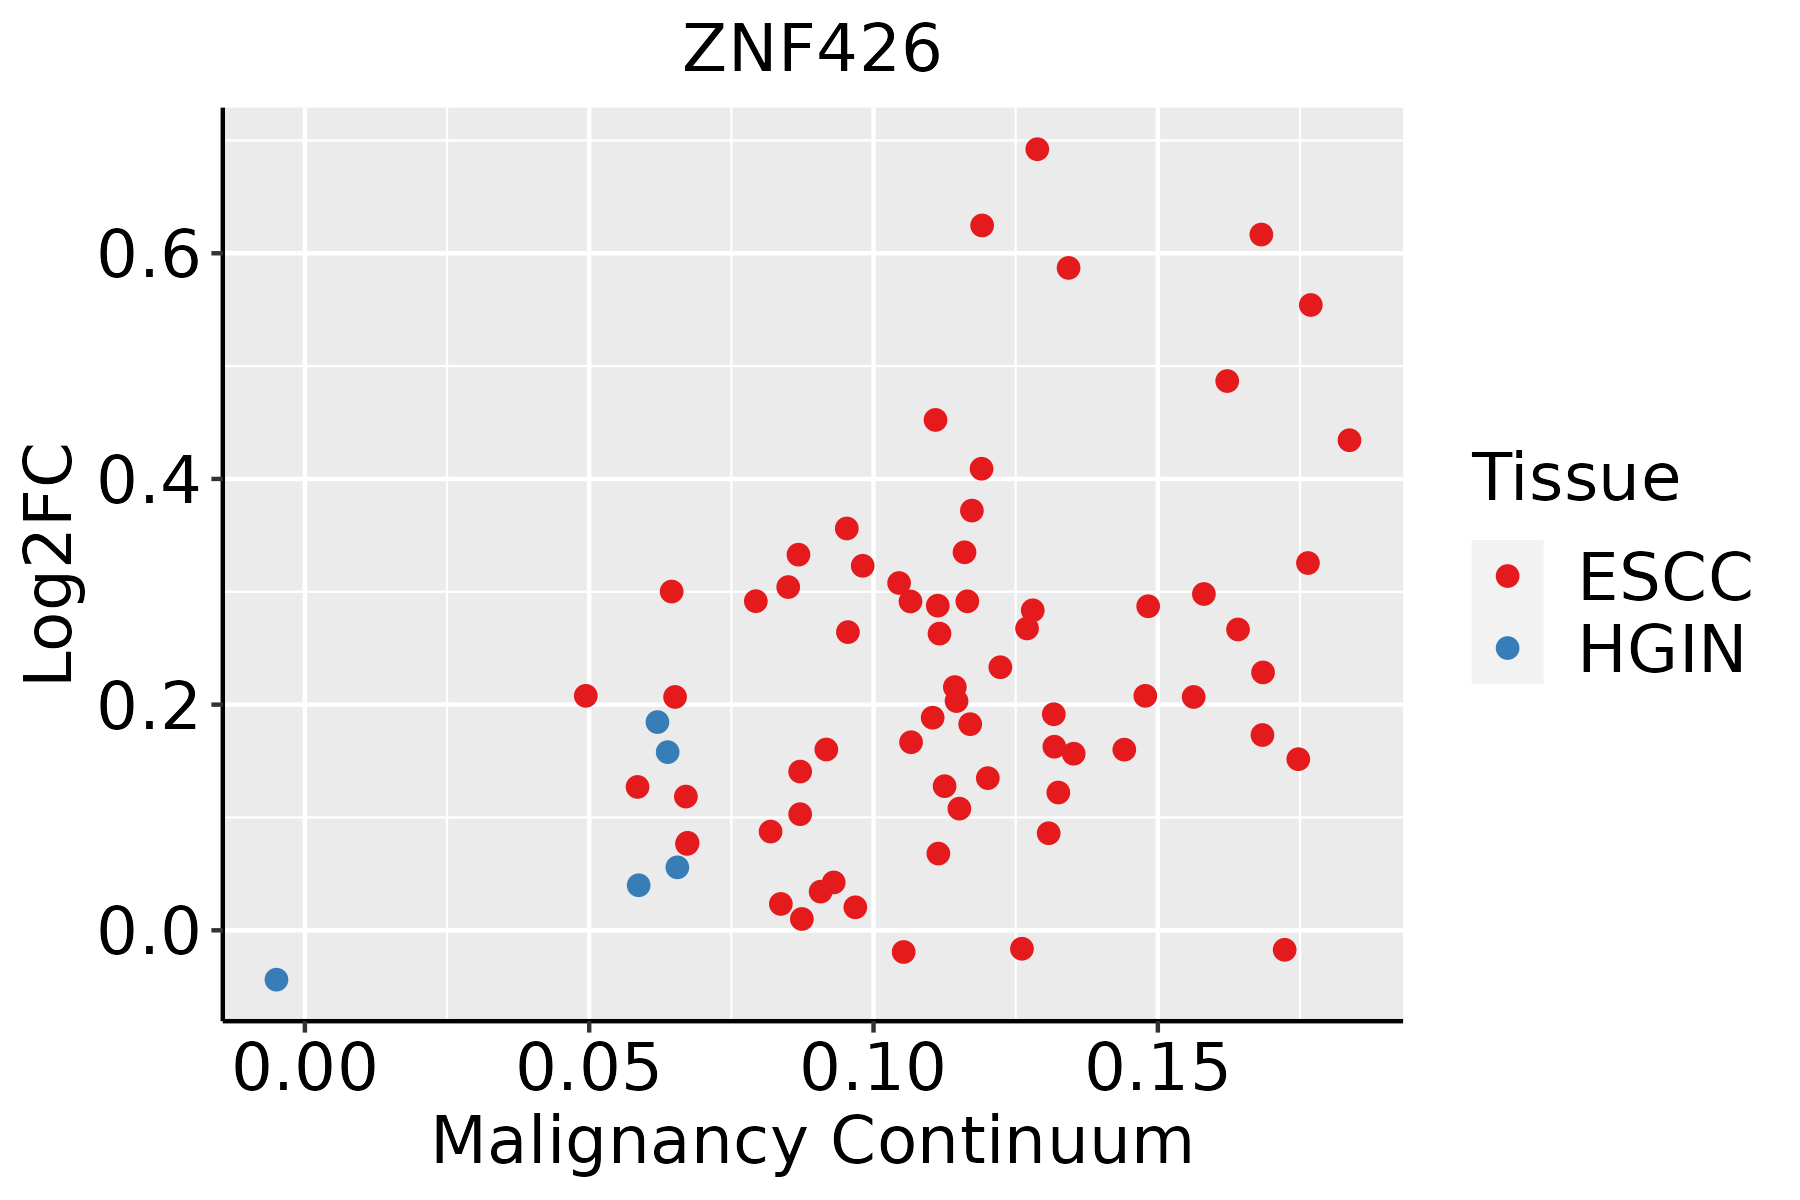 | ESCC: Esophageal squamous cell carcinoma |
| HGIN: High-grade intraepithelial neoplasias | ||
| LGIN: Low-grade intraepithelial neoplasias | ||
| Liver |  | HCC: Hepatocellular carcinoma |
| NAFLD: Non-alcoholic fatty liver disease |
| ∗log2FC in expression of this searched gene in stem-like cells from each diseased tissue sample relative to stem-like cells in normal samples in each tissue plotted against the malignancy continuum. Samples are colored based on if they are from different disease stage. |
Top |
Malignant transformation related pathway analysis |
| Find out the enriched GO biological processes and KEGG pathways involved in transition from healthy to precancer to cancer |
| Tissue | Disease Stage | Enriched GO biological Processes |
| Colorectum | AD |  |
| Colorectum | SER |  |
| Colorectum | MSS |  |
| Colorectum | MSI-H |  |
| Colorectum | FAP |  |
| ∗Top 15 enriched GO BP terms are showed in the bar plot of each disease state in each tissue. Each row represents a significant GO biological process which is colored according to the -log10(p.adjust). |
| Page: 1 2 3 4 5 6 7 8 9 |
| GO ID | Tissue | Disease Stage | Description | Gene Ratio | Bg Ratio | pvalue | p.adjust | Count |
| Page: 1 |
| Pathway ID | Tissue | Disease Stage | Description | Gene Ratio | Bg Ratio | pvalue | p.adjust | qvalue | Count |
| Page: 1 |
Top |
Cell-cell communication analysis |
| Identification of potential cell-cell interactions between two cell types and their ligand-receptor pairs for different disease states |
| Ligand | Receptor | LRpair | Pathway | Tissue | Disease Stage |
| Page: 1 |
Top |
Single-cell gene regulatory network inference analysis |
| Find out the significant the regulons (TFs) and the target genes of each regulon across cell types for different disease states |
| TF | Cell Type | Tissue | Disease Stage | Target Gene | RSS | Regulon Activity |
| ZNF426 | LUMP | Breast | ADJ | MARS2,AC097059.1,VAPB, etc. | 2.15e-01 |  |
| ZNF426 | LUMP | Breast | Precancer | MARS2,AC097059.1,VAPB, etc. | 1.89e-01 |  |
| ZNF426 | MON | Breast | Precancer | MAN1C1,NRM,BUD13, etc. | 4.72e-02 | |
| ZNF426 | MAST | Colorectum | Healthy | TSPAN17,LIMA1,DEFA5, etc. | 8.18e-02 |  |
| ZNF426 | QUIE | Esophagus | Healthy | PDLIM4,PDK4,SGCE, etc. | 2.79e-02 |  |
| ZNF426 | END | Thyroid | HT | STARD13,BAMBI,PCCA, etc. | 2.17e-01 |  |
| ∗The dot plots of a searched regulon are shown for all cell subpopulations in each disease state of each tissue based on the regulon specific score inferred using pySCENIC and by calculating the average expression. |
| Page: 1 |
Top |
Somatic mutation of malignant transformation related genes |
| Annotation of somatic variants for genes involved in malignant transformation |
| Hugo Symbol | Variant Class | Variant Classification | dbSNP RS | HGVSc | HGVSp | HGVSp Short | SWISSPROT | BIOTYPE | SIFT | PolyPhen | Tumor Sample Barcode | Tissue | Histology | Sex | Age | Stage | Therapy Types | Drugs | Outcome |
| ZNF426 | SNV | Missense_Mutation | c.1291T>C | p.Tyr431His | p.Y431H | Q9BUY5 | protein_coding | tolerated(0.53) | probably_damaging(0.992) | TCGA-A2-A0YM-01 | Breast | breast invasive carcinoma | Female | >=65 | I/II | Unknown | Unknown | SD | |
| ZNF426 | SNV | Missense_Mutation | rs140856109 | c.1127N>T | p.Ser376Phe | p.S376F | Q9BUY5 | protein_coding | tolerated(0.35) | benign(0.159) | TCGA-A8-A06X-01 | Breast | breast invasive carcinoma | Female | >=65 | I/II | Unknown | Unknown | SD |
| ZNF426 | SNV | Missense_Mutation | novel | c.266G>A | p.Ser89Asn | p.S89N | Q9BUY5 | protein_coding | tolerated(0.21) | benign(0.003) | TCGA-EA-A410-01 | Cervix | cervical & endocervical cancer | Female | <65 | I/II | Unknown | Unknown | SD |
| ZNF426 | SNV | Missense_Mutation | novel | c.1195A>G | p.Lys399Glu | p.K399E | Q9BUY5 | protein_coding | deleterious(0) | probably_damaging(0.983) | TCGA-AA-3947-01 | Colorectum | colon adenocarcinoma | Female | <65 | I/II | Unknown | Unknown | SD |
| ZNF426 | SNV | Missense_Mutation | novel | c.1496N>A | p.Thr499Asn | p.T499N | Q9BUY5 | protein_coding | deleterious(0) | possibly_damaging(0.902) | TCGA-AA-3952-01 | Colorectum | colon adenocarcinoma | Male | >=65 | III/IV | Unknown | Unknown | PD |
| ZNF426 | SNV | Missense_Mutation | rs745424017 | c.899G>A | p.Arg300Gln | p.R300Q | Q9BUY5 | protein_coding | tolerated(0.56) | possibly_damaging(0.787) | TCGA-AA-3984-01 | Colorectum | colon adenocarcinoma | Female | <65 | I/II | Unknown | Unknown | SD |
| ZNF426 | SNV | Missense_Mutation | novel | c.1004C>A | p.Pro335His | p.P335H | Q9BUY5 | protein_coding | deleterious(0) | probably_damaging(0.998) | TCGA-AA-A01I-01 | Colorectum | colon adenocarcinoma | Male | >=65 | I/II | Unknown | Unknown | SD |
| ZNF426 | SNV | Missense_Mutation | rs766406474 | c.1067G>A | p.Arg356Gln | p.R356Q | Q9BUY5 | protein_coding | tolerated(0.3) | probably_damaging(0.929) | TCGA-CA-6717-01 | Colorectum | colon adenocarcinoma | Male | <65 | I/II | Chemotherapy | oxaliplatin | CR |
| ZNF426 | SNV | Missense_Mutation | novel | c.758A>G | p.Glu253Gly | p.E253G | Q9BUY5 | protein_coding | deleterious(0) | benign(0.076) | TCGA-CA-6717-01 | Colorectum | colon adenocarcinoma | Male | <65 | I/II | Chemotherapy | oxaliplatin | CR |
| ZNF426 | SNV | Missense_Mutation | novel | c.253A>G | p.Ile85Val | p.I85V | Q9BUY5 | protein_coding | tolerated(0.06) | benign(0) | TCGA-CA-6717-01 | Colorectum | colon adenocarcinoma | Male | <65 | I/II | Chemotherapy | oxaliplatin | CR |
| Page: 1 2 3 4 5 6 7 |
Top |
Related drugs of malignant transformation related genes |
| Identification of chemicals and drugs interact with genes involved in malignant transfromation |
| (DGIdb 4.0) |
| Entrez ID | Symbol | Category | Interaction Types | Drug Claim Name | Drug Name | PMIDs |
| Page: 1 |

Copyright 2023-Present -The University of Texas Health Science Center at Houston |