
|
|||||
|
 | |
| |
| |
| |
| |
| |
|
Gene: ZNF407 |
Gene summary for ZNF407 |
| Gene information | Species | Human | Gene symbol | ZNF407 | Gene ID | 55628 |
| Gene name | zinc finger protein 407 | |
| Gene Alias | ZNF407 | |
| Cytomap | 18q22.3 | |
| Gene Type | protein-coding | GO ID | GO:0006139 | UniProtAcc | Q9C0G0 |
Top |
Malignant transformation analysis |
| Identification of the aberrant gene expression in precancerous and cancerous lesions by comparing the gene expression of stem-like cells in diseased tissues with normal stem cells |
| Entrez ID | Symbol | Replicates | Species | Organ | Tissue | Adj P-value | Log2FC | Malignancy |
| 55628 | ZNF407 | CCI_1 | Human | Cervix | CC | 1.40e-09 | 9.92e-01 | 0.528 |
| 55628 | ZNF407 | CCI_2 | Human | Cervix | CC | 8.28e-08 | 8.20e-01 | 0.5249 |
| 55628 | ZNF407 | CCI_3 | Human | Cervix | CC | 8.04e-16 | 9.82e-01 | 0.516 |
| 55628 | ZNF407 | HTA11_3410_2000001011 | Human | Colorectum | AD | 2.47e-22 | -7.22e-01 | 0.0155 |
| 55628 | ZNF407 | HTA11_2487_2000001011 | Human | Colorectum | SER | 4.28e-04 | -4.89e-01 | -0.1808 |
| 55628 | ZNF407 | HTA11_1938_2000001011 | Human | Colorectum | AD | 7.81e-05 | -5.10e-01 | -0.0811 |
| 55628 | ZNF407 | HTA11_3361_2000001011 | Human | Colorectum | AD | 1.01e-09 | -7.38e-01 | -0.1207 |
| 55628 | ZNF407 | HTA11_696_2000001011 | Human | Colorectum | AD | 3.14e-11 | -5.37e-01 | -0.1464 |
| 55628 | ZNF407 | HTA11_866_2000001011 | Human | Colorectum | AD | 4.42e-12 | -4.91e-01 | -0.1001 |
| 55628 | ZNF407 | HTA11_1391_2000001011 | Human | Colorectum | AD | 3.32e-03 | -3.98e-01 | -0.059 |
| 55628 | ZNF407 | HTA11_7862_2000001011 | Human | Colorectum | AD | 1.27e-02 | -5.38e-01 | -0.0179 |
| 55628 | ZNF407 | HTA11_866_3004761011 | Human | Colorectum | AD | 2.53e-15 | -6.43e-01 | 0.096 |
| 55628 | ZNF407 | HTA11_8622_2000001021 | Human | Colorectum | SER | 1.18e-02 | -6.55e-01 | 0.0528 |
| 55628 | ZNF407 | HTA11_10711_2000001011 | Human | Colorectum | AD | 1.83e-09 | -6.58e-01 | 0.0338 |
| 55628 | ZNF407 | HTA11_7696_3000711011 | Human | Colorectum | AD | 4.23e-22 | -6.44e-01 | 0.0674 |
| 55628 | ZNF407 | HTA11_6818_2000001021 | Human | Colorectum | AD | 1.62e-03 | -4.95e-01 | 0.0588 |
| 55628 | ZNF407 | HTA11_99999970781_79442 | Human | Colorectum | MSS | 2.73e-17 | -5.28e-01 | 0.294 |
| 55628 | ZNF407 | HTA11_99999971662_82457 | Human | Colorectum | MSS | 5.20e-15 | -5.89e-01 | 0.3859 |
| 55628 | ZNF407 | HTA11_99999973899_84307 | Human | Colorectum | MSS | 1.16e-06 | -7.20e-01 | 0.2585 |
| 55628 | ZNF407 | HTA11_99999974143_84620 | Human | Colorectum | MSS | 1.08e-23 | -6.59e-01 | 0.3005 |
| Page: 1 2 3 4 |
| Tissue | Expression Dynamics | Abbreviation |
| Cervix | 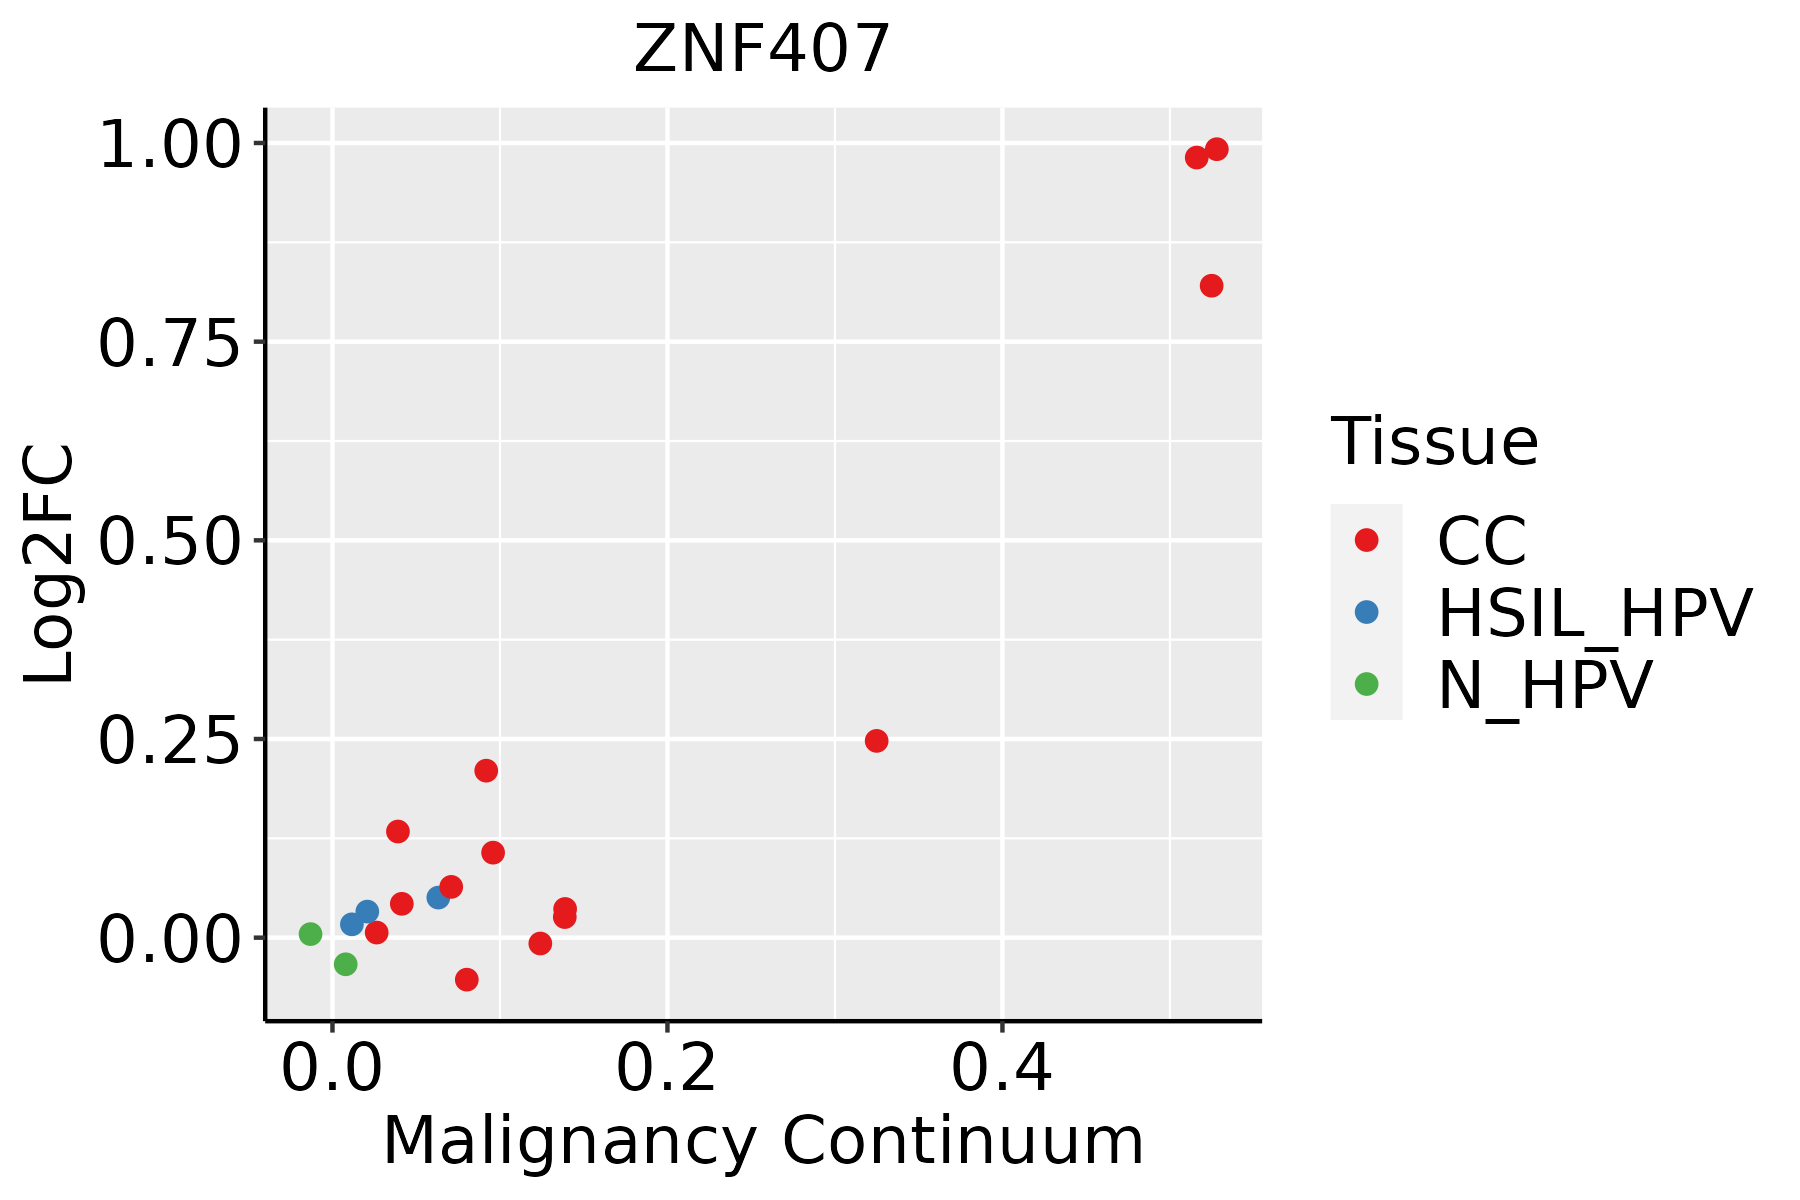 | CC: Cervix cancer |
| HSIL_HPV: HPV-infected high-grade squamous intraepithelial lesions | ||
| N_HPV: HPV-infected normal cervix | ||
| Colorectum (GSE201348) |  | FAP: Familial adenomatous polyposis |
| CRC: Colorectal cancer | ||
| Colorectum (HTA11) |  | AD: Adenomas |
| SER: Sessile serrated lesions | ||
| MSI-H: Microsatellite-high colorectal cancer | ||
| MSS: Microsatellite stable colorectal cancer | ||
| Endometrium |  | AEH: Atypical endometrial hyperplasia |
| EEC: Endometrioid Cancer | ||
| Liver | 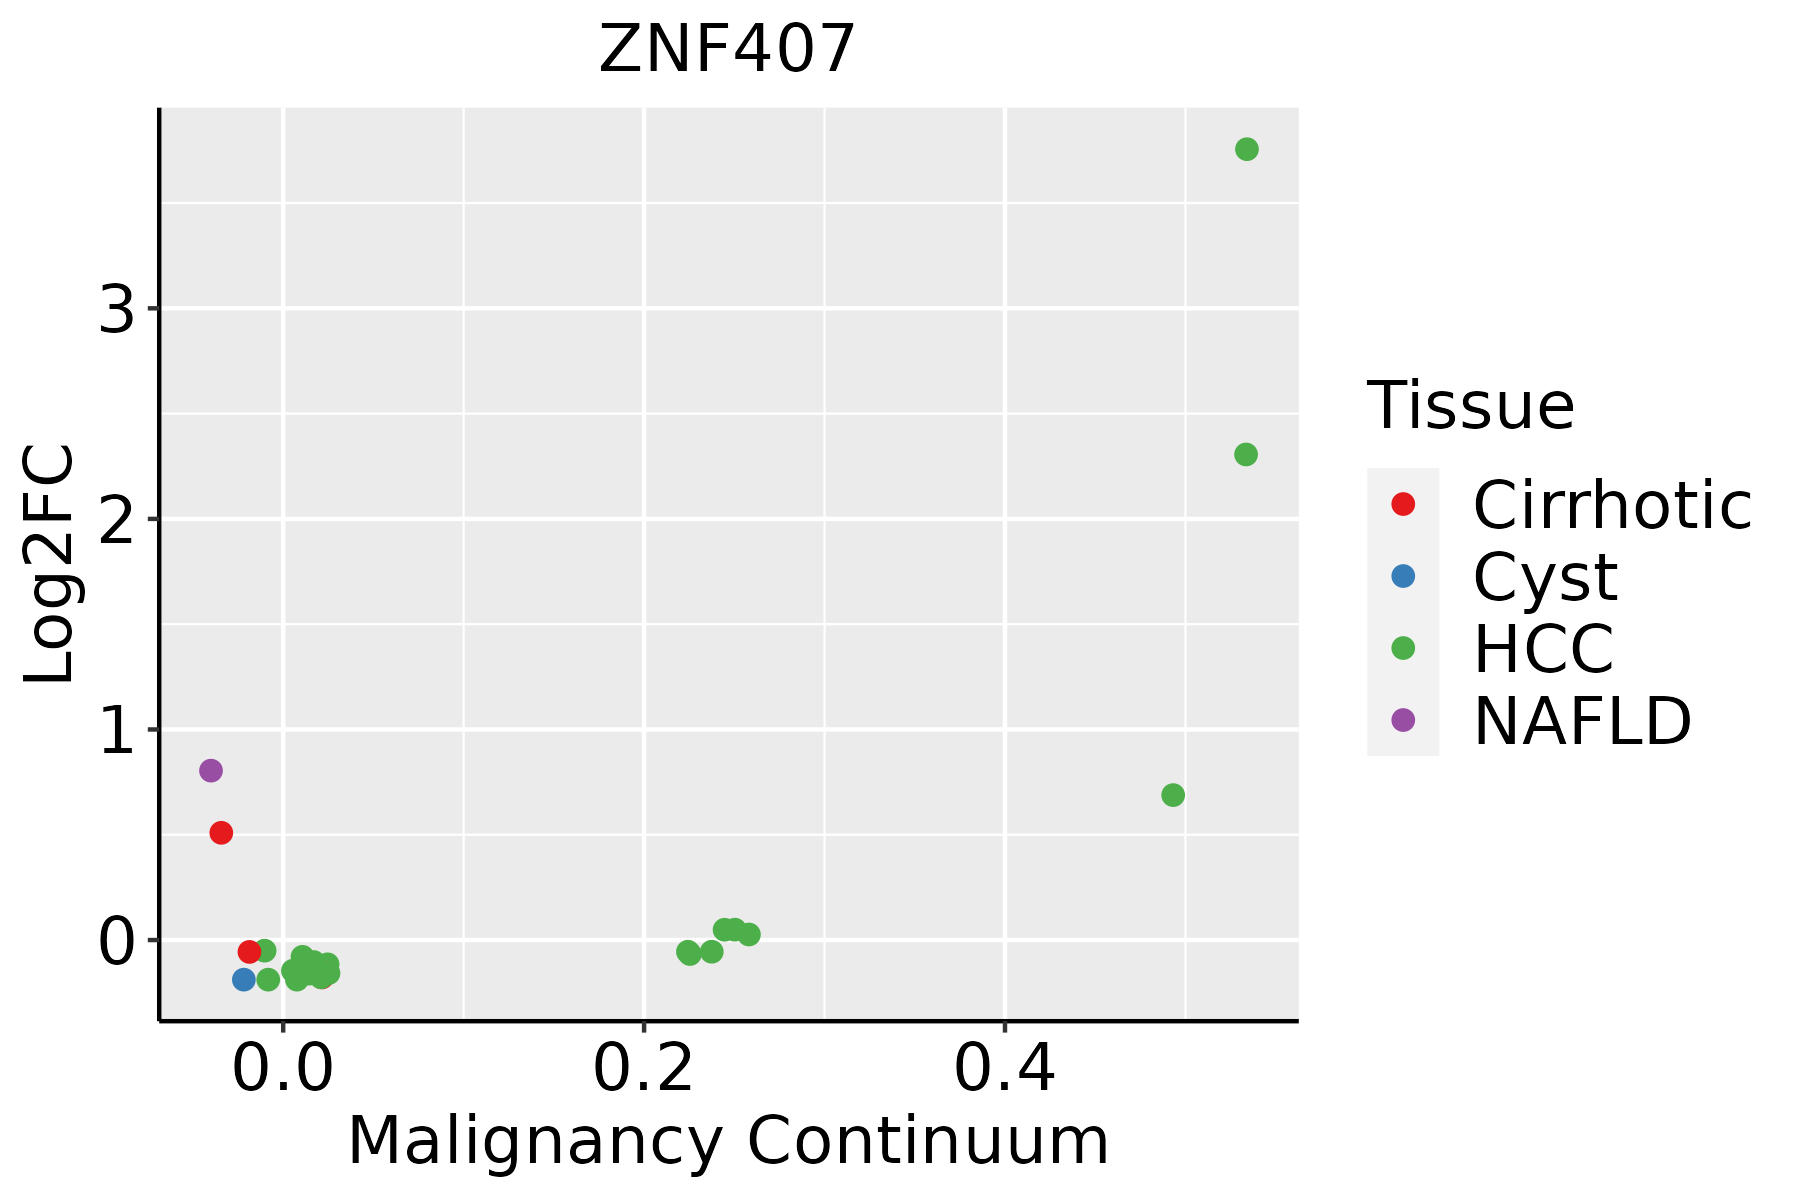 | HCC: Hepatocellular carcinoma |
| NAFLD: Non-alcoholic fatty liver disease | ||
| Lung | 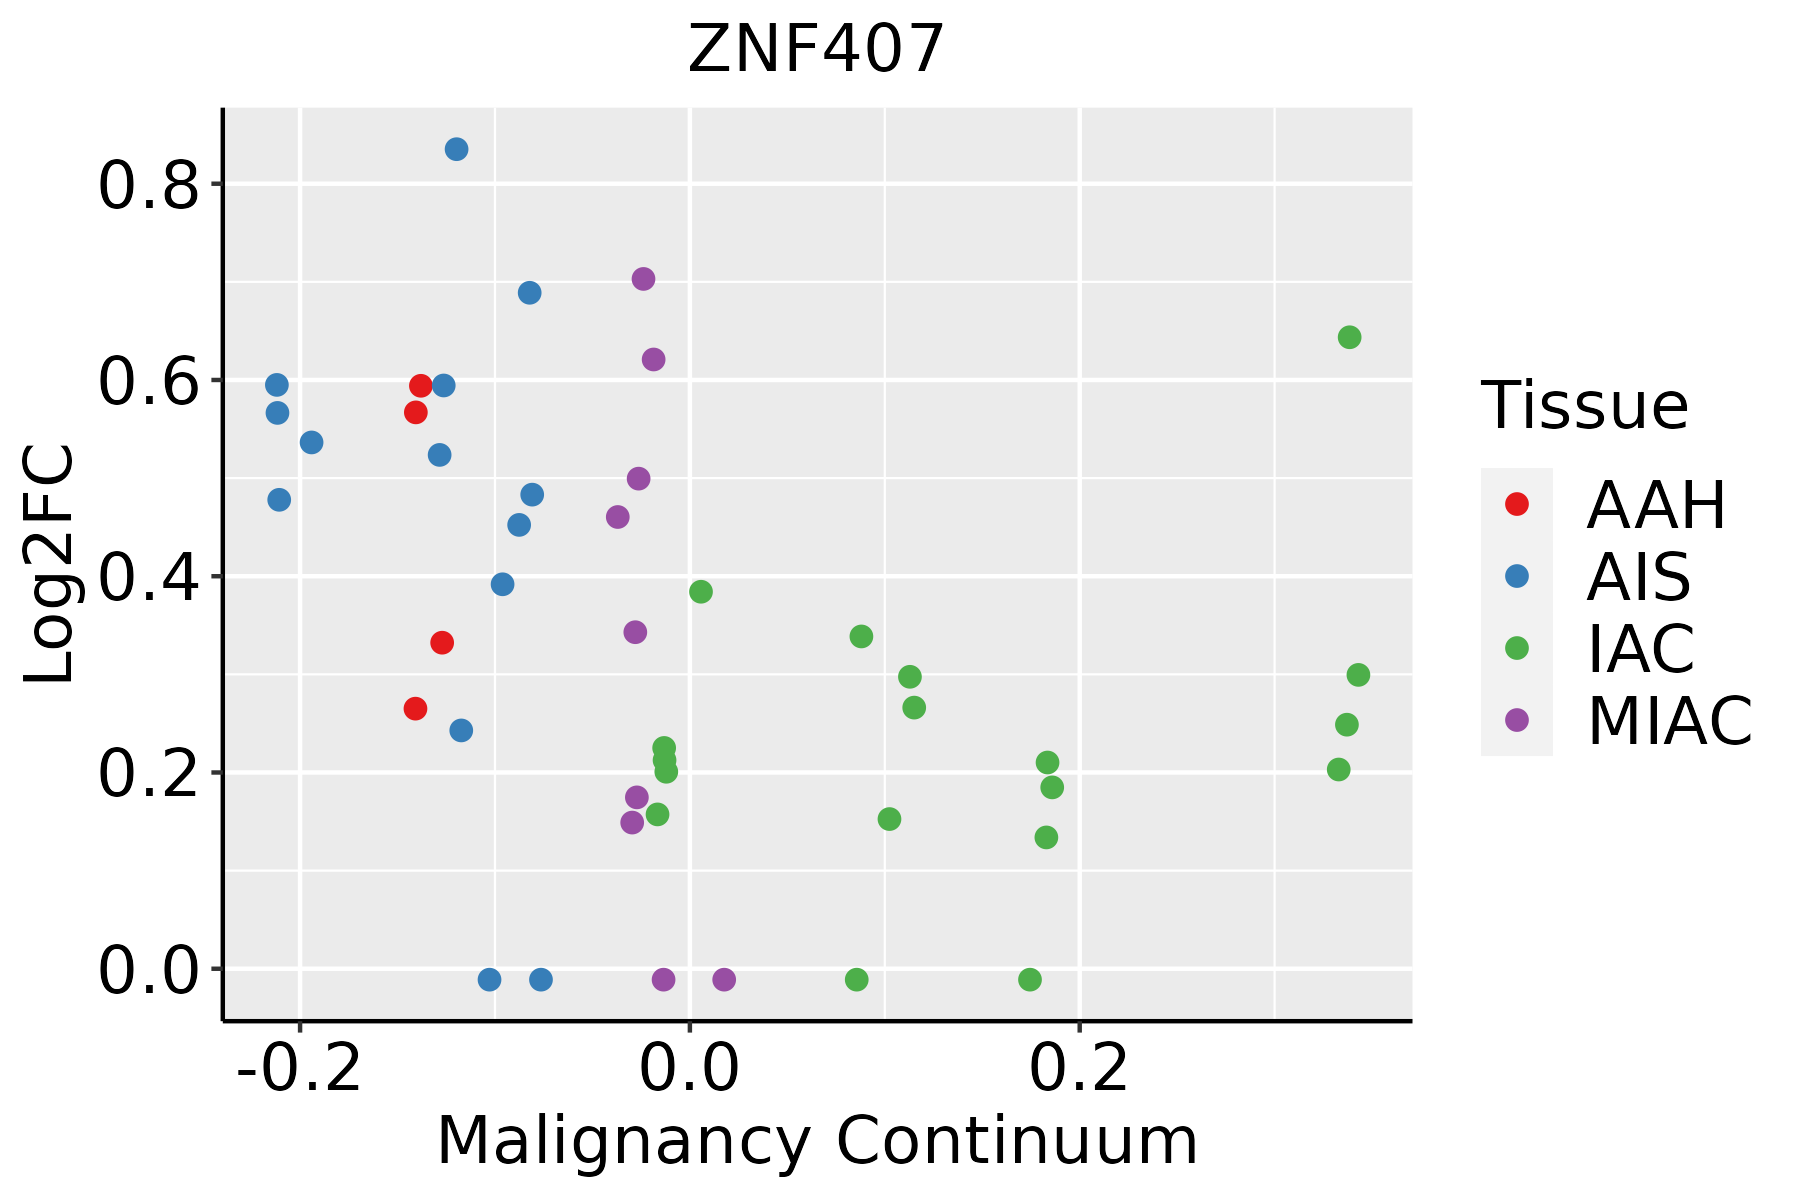 | AAH: Atypical adenomatous hyperplasia |
| AIS: Adenocarcinoma in situ | ||
| IAC: Invasive lung adenocarcinoma | ||
| MIA: Minimally invasive adenocarcinoma |
| ∗log2FC in expression of this searched gene in stem-like cells from each diseased tissue sample relative to stem-like cells in normal samples in each tissue plotted against the malignancy continuum. Samples are colored based on if they are from different disease stage. |
Top |
Malignant transformation related pathway analysis |
| Find out the enriched GO biological processes and KEGG pathways involved in transition from healthy to precancer to cancer |
| Tissue | Disease Stage | Enriched GO biological Processes |
| Colorectum | AD |  |
| Colorectum | SER |  |
| Colorectum | MSS |  |
| Colorectum | MSI-H |  |
| Colorectum | FAP |  |
| ∗Top 15 enriched GO BP terms are showed in the bar plot of each disease state in each tissue. Each row represents a significant GO biological process which is colored according to the -log10(p.adjust). |
| Page: 1 2 3 4 5 6 7 8 9 |
| GO ID | Tissue | Disease Stage | Description | Gene Ratio | Bg Ratio | pvalue | p.adjust | Count |
| Page: 1 |
| Pathway ID | Tissue | Disease Stage | Description | Gene Ratio | Bg Ratio | pvalue | p.adjust | qvalue | Count |
| Page: 1 |
Top |
Cell-cell communication analysis |
| Identification of potential cell-cell interactions between two cell types and their ligand-receptor pairs for different disease states |
| Ligand | Receptor | LRpair | Pathway | Tissue | Disease Stage |
| Page: 1 |
Top |
Single-cell gene regulatory network inference analysis |
| Find out the significant the regulons (TFs) and the target genes of each regulon across cell types for different disease states |
| TF | Cell Type | Tissue | Disease Stage | Target Gene | RSS | Regulon Activity |
| ZNF407 | PERI | Colorectum | MSI-H | PTPRM,ANKRD12,ATP9B, etc. | 2.40e-01 |  |
| ZNF407 | CD8TEXP | Prostate | ADJ | ZDHHC21,UTRN,FAM172A, etc. | 3.25e-02 |  |
| ZNF407 | CD8TCM | Prostate | BPH | ZDHHC21,UTRN,FAM172A, etc. | 2.53e-01 |  |
| ZNF407 | BN | Prostate | Healthy | ZDHHC21,UTRN,FAM172A, etc. | 3.18e-02 |  |
| ZNF407 | BN | Prostate | Tumor | ZDHHC21,UTRN,FAM172A, etc. | 1.09e-01 |  |
| ZNF407 | MSC | Prostate | Healthy | TRAK1,DNAJC27,EBF1, etc. | 8.14e-02 | |
| ∗The dot plots of a searched regulon are shown for all cell subpopulations in each disease state of each tissue based on the regulon specific score inferred using pySCENIC and by calculating the average expression. |
| Page: 1 |
Top |
Somatic mutation of malignant transformation related genes |
| Annotation of somatic variants for genes involved in malignant transformation |
| Hugo Symbol | Variant Class | Variant Classification | dbSNP RS | HGVSc | HGVSp | HGVSp Short | SWISSPROT | BIOTYPE | SIFT | PolyPhen | Tumor Sample Barcode | Tissue | Histology | Sex | Age | Stage | Therapy Types | Drugs | Outcome |
| ZNF407 | SNV | Missense_Mutation | c.1139N>C | p.Arg380Thr | p.R380T | Q9C0G0 | protein_coding | tolerated(0.2) | benign(0) | TCGA-A8-A0A9-01 | Breast | breast invasive carcinoma | Female | >=65 | I/II | Hormone Therapy | anastrozole | SD | |
| ZNF407 | SNV | Missense_Mutation | novel | c.6281N>T | p.Ala2094Val | p.A2094V | Q9C0G0 | protein_coding | deleterious(0) | possibly_damaging(0.759) | TCGA-AC-A2BK-01 | Breast | breast invasive carcinoma | Female | >=65 | III/IV | Chemotherapy | cytoxan | CR |
| ZNF407 | SNV | Missense_Mutation | c.917N>C | p.Arg306Thr | p.R306T | Q9C0G0 | protein_coding | tolerated(0.14) | benign(0.025) | TCGA-AO-A0JB-01 | Breast | breast invasive carcinoma | Female | <65 | III/IV | Chemotherapy | cyclophosphamide | SD | |
| ZNF407 | SNV | Missense_Mutation | novel | c.2231T>G | p.Leu744Trp | p.L744W | Q9C0G0 | protein_coding | deleterious(0) | probably_damaging(0.987) | TCGA-B6-A0I1-01 | Breast | breast invasive carcinoma | Female | >=65 | I/II | Unknown | Unknown | PD |
| ZNF407 | SNV | Missense_Mutation | novel | c.245N>T | p.Glu82Val | p.E82V | Q9C0G0 | protein_coding | tolerated(0.09) | benign(0.03) | TCGA-BH-A0B6-01 | Breast | breast invasive carcinoma | Female | <65 | I/II | Unknown | Unknown | SD |
| ZNF407 | SNV | Missense_Mutation | c.622N>T | p.His208Tyr | p.H208Y | Q9C0G0 | protein_coding | tolerated(0.65) | possibly_damaging(0.462) | TCGA-BH-A0H5-01 | Breast | breast invasive carcinoma | Female | <65 | I/II | Chemotherapy | cytoxan | CR | |
| ZNF407 | SNV | Missense_Mutation | c.3055N>C | p.Cys1019Arg | p.C1019R | Q9C0G0 | protein_coding | deleterious(0) | probably_damaging(0.998) | TCGA-BH-A18S-01 | Breast | breast invasive carcinoma | Female | >=65 | I/II | Unknown | Unknown | SD | |
| ZNF407 | SNV | Missense_Mutation | novel | c.4270G>A | p.Asp1424Asn | p.D1424N | Q9C0G0 | protein_coding | deleterious(0.04) | probably_damaging(0.999) | TCGA-BH-A42V-01 | Breast | breast invasive carcinoma | Female | <65 | I/II | Unknown | Unknown | SD |
| ZNF407 | SNV | Missense_Mutation | rs772230269 | c.4076N>G | p.Ser1359Cys | p.S1359C | Q9C0G0 | protein_coding | tolerated(0.11) | probably_damaging(0.963) | TCGA-C8-A132-01 | Breast | breast invasive carcinoma | Female | <65 | I/II | Unknown | Unknown | SD |
| ZNF407 | SNV | Missense_Mutation | c.6379N>C | p.Glu2127Gln | p.E2127Q | Q9C0G0 | protein_coding | deleterious(0.01) | probably_damaging(0.946) | TCGA-D8-A1JA-01 | Breast | breast invasive carcinoma | Female | <65 | III/IV | Chemotherapy | adriamycin | PD |
| Page: 1 2 3 4 5 6 7 8 9 10 11 12 13 14 15 16 17 18 19 20 21 22 23 24 |
Top |
Related drugs of malignant transformation related genes |
| Identification of chemicals and drugs interact with genes involved in malignant transfromation |
| (DGIdb 4.0) |
| Entrez ID | Symbol | Category | Interaction Types | Drug Claim Name | Drug Name | PMIDs |
| Page: 1 |

Copyright 2023-Present -The University of Texas Health Science Center at Houston |