
|
|||||
|
 | |
| |
| |
| |
| |
| |
|
Gene: ZNF395 |
Gene summary for ZNF395 |
| Gene information | Species | Human | Gene symbol | ZNF395 | Gene ID | 55893 |
| Gene name | zinc finger protein 395 | |
| Gene Alias | HDBP-2 | |
| Cytomap | 8p21.1 | |
| Gene Type | protein-coding | GO ID | GO:0006139 | UniProtAcc | Q7L9C8 |
Top |
Malignant transformation analysis |
| Identification of the aberrant gene expression in precancerous and cancerous lesions by comparing the gene expression of stem-like cells in diseased tissues with normal stem cells |
| Entrez ID | Symbol | Replicates | Species | Organ | Tissue | Adj P-value | Log2FC | Malignancy |
| 55893 | ZNF395 | HTA11_1938_2000001011 | Human | Colorectum | AD | 1.21e-03 | 3.62e-01 | -0.0811 |
| 55893 | ZNF395 | HTA11_78_2000001011 | Human | Colorectum | AD | 3.68e-03 | 3.22e-01 | -0.1088 |
| 55893 | ZNF395 | HTA11_347_2000001011 | Human | Colorectum | AD | 4.06e-07 | 3.38e-01 | -0.1954 |
| 55893 | ZNF395 | HTA11_7862_2000001011 | Human | Colorectum | AD | 2.23e-05 | 4.53e-01 | -0.0179 |
| 55893 | ZNF395 | HTA11_10623_2000001011 | Human | Colorectum | AD | 1.25e-02 | 3.97e-01 | -0.0177 |
| 55893 | ZNF395 | HTA11_7696_3000711011 | Human | Colorectum | AD | 3.17e-09 | 3.22e-01 | 0.0674 |
| 55893 | ZNF395 | HTA11_7469_2000001011 | Human | Colorectum | AD | 2.14e-03 | 6.16e-01 | -0.0124 |
| 55893 | ZNF395 | HTA11_99999970781_79442 | Human | Colorectum | MSS | 1.94e-04 | 2.52e-01 | 0.294 |
| 55893 | ZNF395 | LZE4T | Human | Esophagus | ESCC | 2.27e-04 | 1.59e-02 | 0.0811 |
| 55893 | ZNF395 | LZE8T | Human | Esophagus | ESCC | 1.47e-05 | -1.33e-02 | 0.067 |
| 55893 | ZNF395 | LZE20T | Human | Esophagus | ESCC | 9.86e-03 | -1.28e-01 | 0.0662 |
| 55893 | ZNF395 | LZE22T | Human | Esophagus | ESCC | 2.98e-02 | 4.44e-02 | 0.068 |
| 55893 | ZNF395 | LZE24T | Human | Esophagus | ESCC | 9.61e-11 | 2.09e-01 | 0.0596 |
| 55893 | ZNF395 | P2T-E | Human | Esophagus | ESCC | 6.47e-32 | 2.22e-01 | 0.1177 |
| 55893 | ZNF395 | P4T-E | Human | Esophagus | ESCC | 3.53e-11 | 8.02e-02 | 0.1323 |
| 55893 | ZNF395 | P5T-E | Human | Esophagus | ESCC | 1.92e-08 | -1.16e-01 | 0.1327 |
| 55893 | ZNF395 | P8T-E | Human | Esophagus | ESCC | 9.18e-16 | 3.75e-01 | 0.0889 |
| 55893 | ZNF395 | P9T-E | Human | Esophagus | ESCC | 8.50e-05 | -5.33e-02 | 0.1131 |
| 55893 | ZNF395 | P10T-E | Human | Esophagus | ESCC | 2.40e-26 | 4.64e-01 | 0.116 |
| 55893 | ZNF395 | P11T-E | Human | Esophagus | ESCC | 6.01e-03 | 2.67e-01 | 0.1426 |
| Page: 1 2 3 4 5 |
| Tissue | Expression Dynamics | Abbreviation |
| Colorectum (GSE201348) |  | FAP: Familial adenomatous polyposis |
| CRC: Colorectal cancer | ||
| Colorectum (HTA11) |  | AD: Adenomas |
| SER: Sessile serrated lesions | ||
| MSI-H: Microsatellite-high colorectal cancer | ||
| MSS: Microsatellite stable colorectal cancer | ||
| Esophagus | 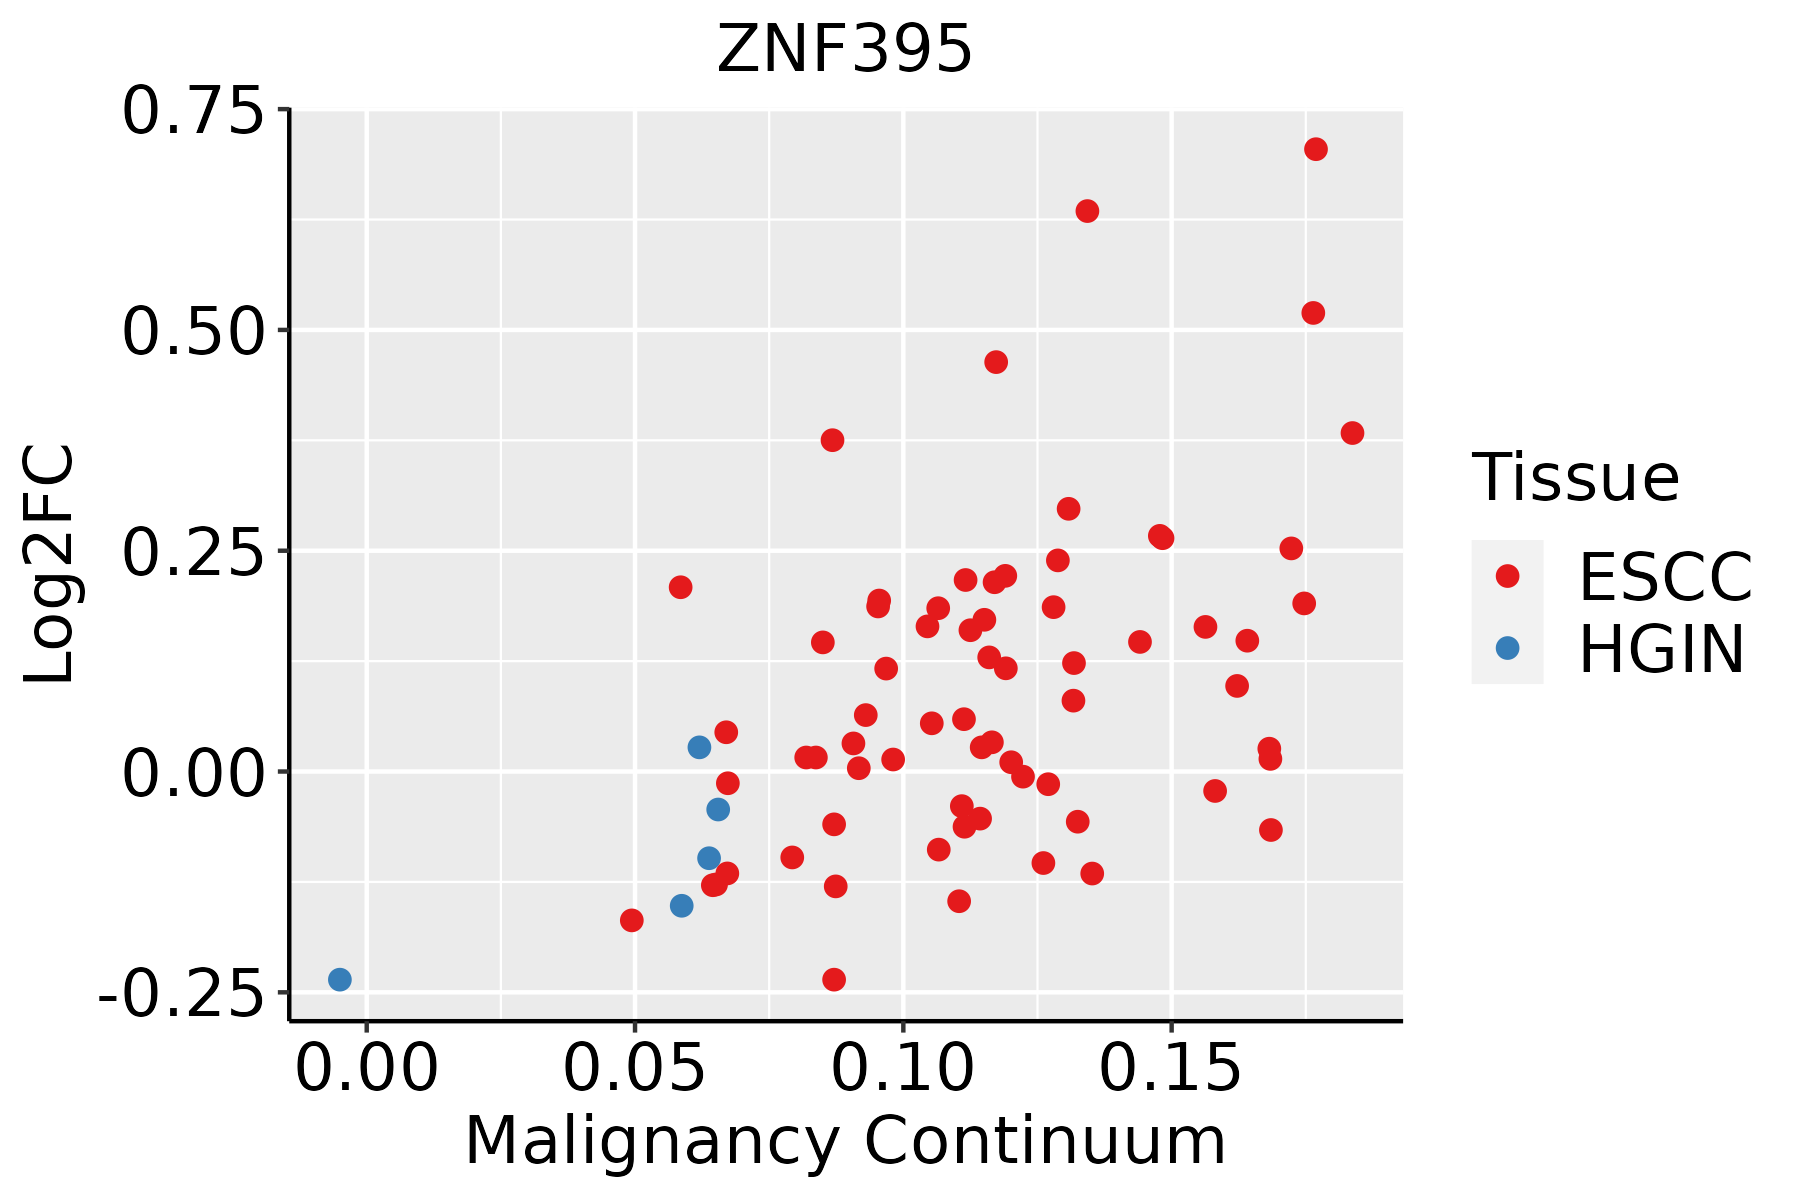 | ESCC: Esophageal squamous cell carcinoma |
| HGIN: High-grade intraepithelial neoplasias | ||
| LGIN: Low-grade intraepithelial neoplasias | ||
| Oral Cavity | 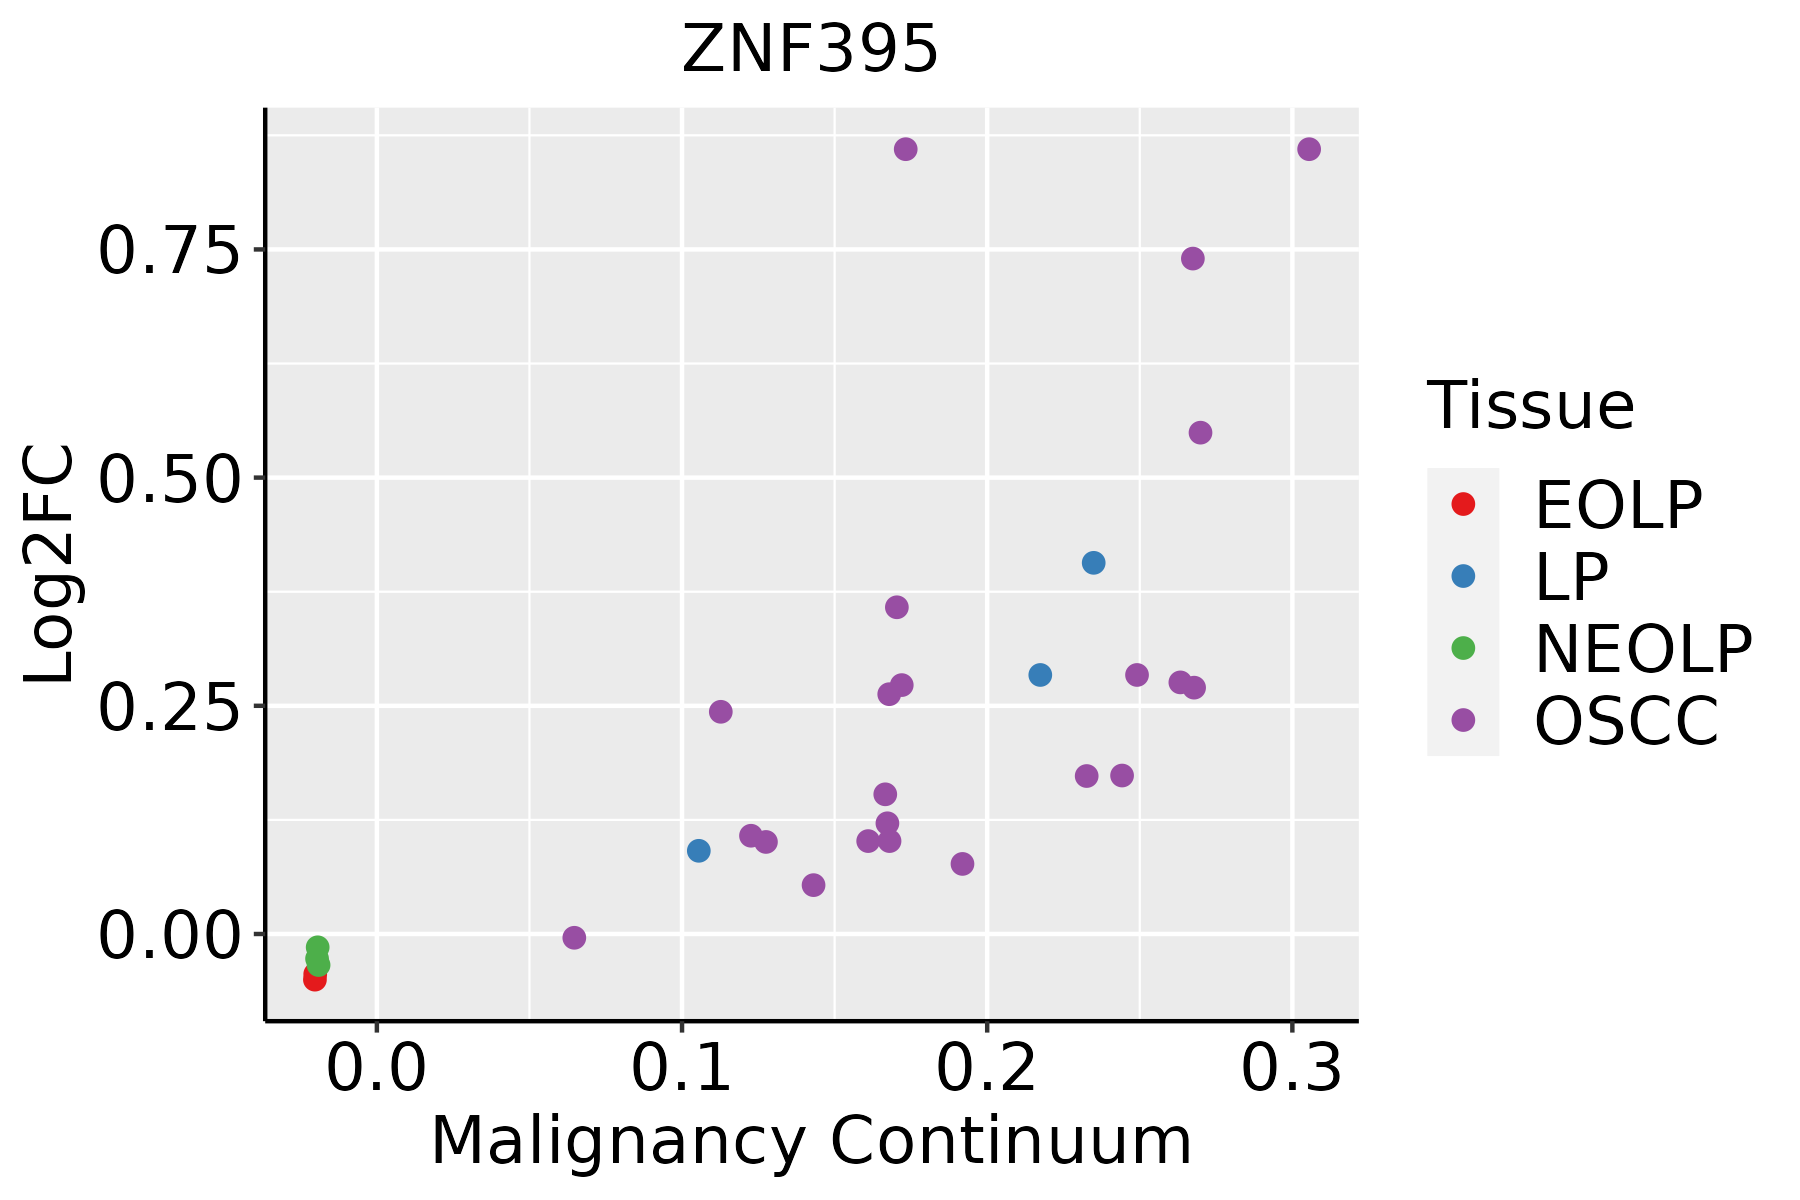 | EOLP: Erosive Oral lichen planus |
| LP: leukoplakia | ||
| NEOLP: Non-erosive oral lichen planus | ||
| OSCC: Oral squamous cell carcinoma | ||
| Prostate |  | BPH: Benign Prostatic Hyperplasia |
| Skin | 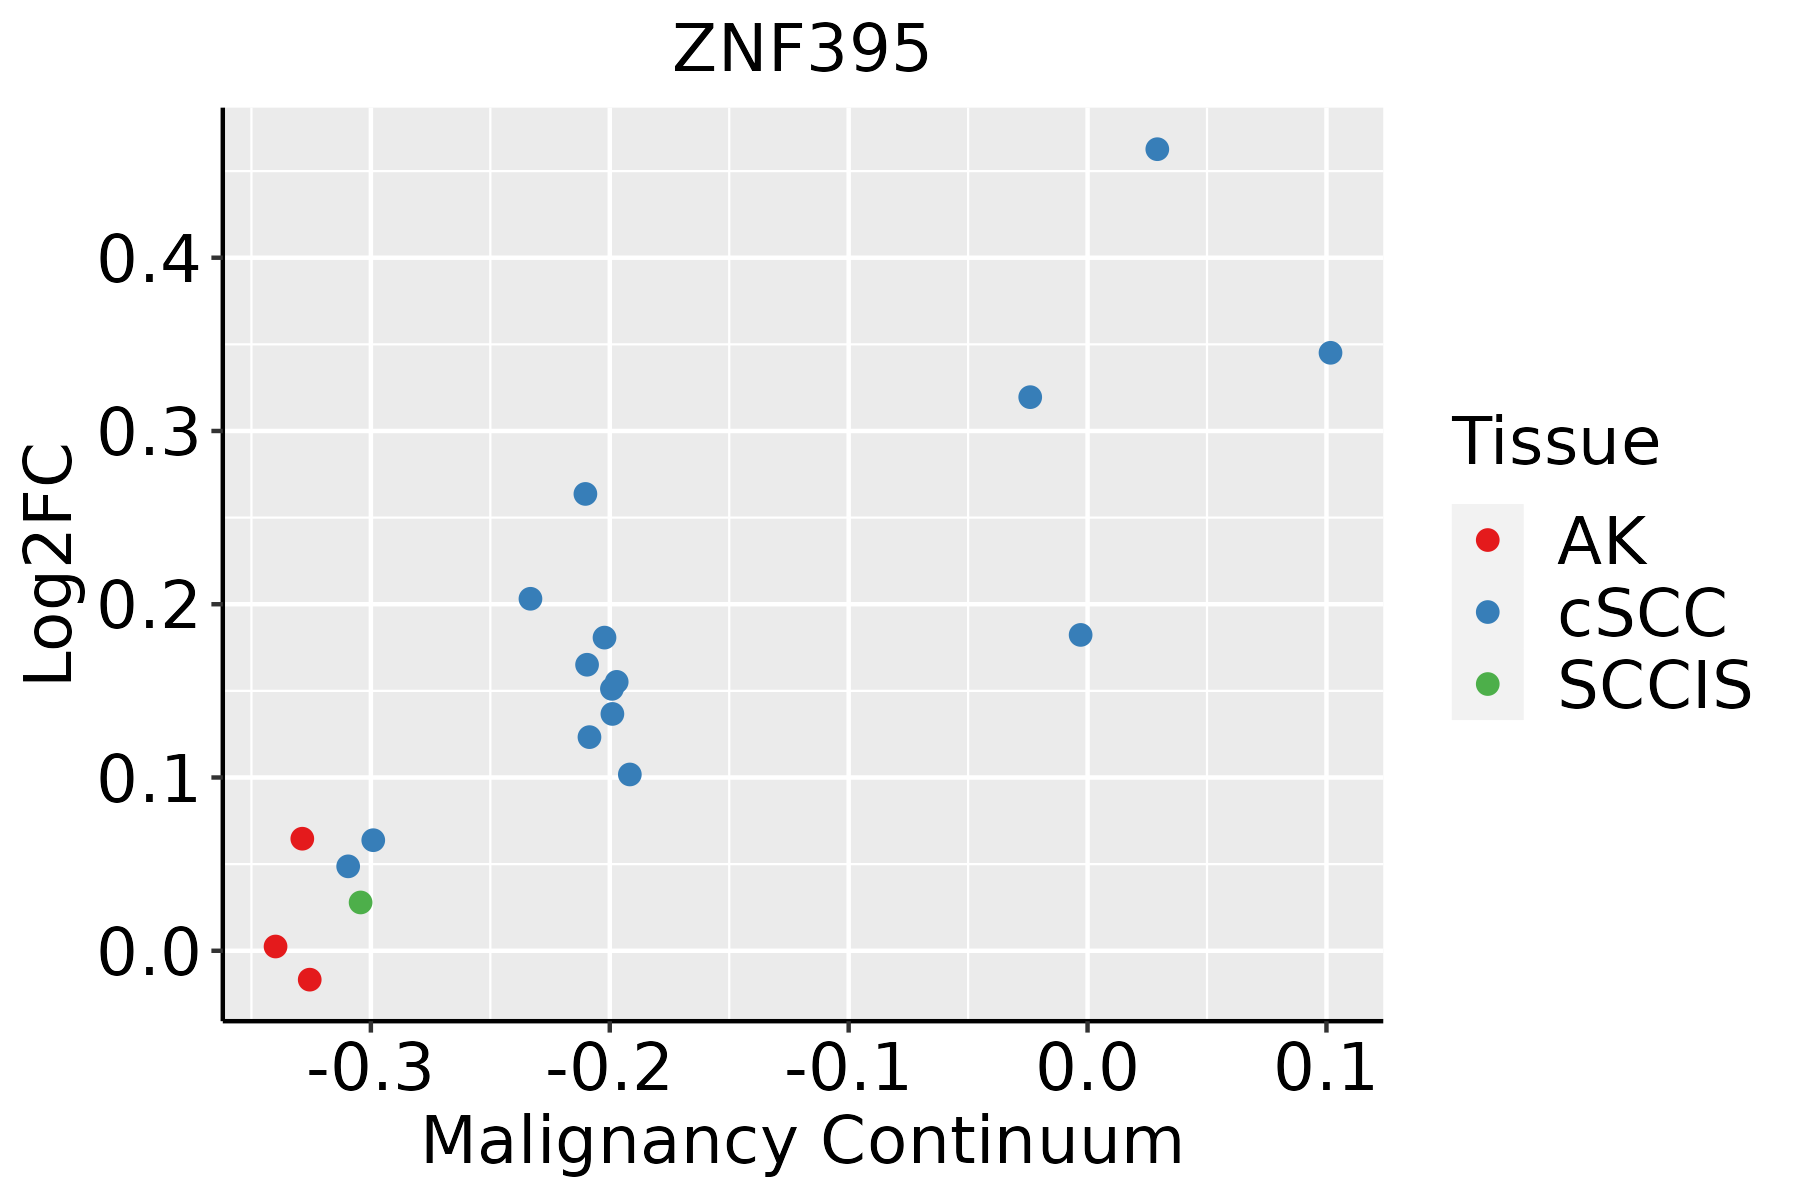 | AK: Actinic keratosis |
| cSCC: Cutaneous squamous cell carcinoma | ||
| SCCIS:squamous cell carcinoma in situ |
| ∗log2FC in expression of this searched gene in stem-like cells from each diseased tissue sample relative to stem-like cells in normal samples in each tissue plotted against the malignancy continuum. Samples are colored based on if they are from different disease stage. |
Top |
Malignant transformation related pathway analysis |
| Find out the enriched GO biological processes and KEGG pathways involved in transition from healthy to precancer to cancer |
| Tissue | Disease Stage | Enriched GO biological Processes |
| Colorectum | AD |  |
| Colorectum | SER |  |
| Colorectum | MSS |  |
| Colorectum | MSI-H |  |
| Colorectum | FAP |  |
| ∗Top 15 enriched GO BP terms are showed in the bar plot of each disease state in each tissue. Each row represents a significant GO biological process which is colored according to the -log10(p.adjust). |
| Page: 1 2 3 4 5 6 7 8 9 |
| GO ID | Tissue | Disease Stage | Description | Gene Ratio | Bg Ratio | pvalue | p.adjust | Count |
| Page: 1 |
| Pathway ID | Tissue | Disease Stage | Description | Gene Ratio | Bg Ratio | pvalue | p.adjust | qvalue | Count |
| Page: 1 |
Top |
Cell-cell communication analysis |
| Identification of potential cell-cell interactions between two cell types and their ligand-receptor pairs for different disease states |
| Ligand | Receptor | LRpair | Pathway | Tissue | Disease Stage |
| Page: 1 |
Top |
Single-cell gene regulatory network inference analysis |
| Find out the significant the regulons (TFs) and the target genes of each regulon across cell types for different disease states |
| TF | Cell Type | Tissue | Disease Stage | Target Gene | RSS | Regulon Activity |
| ∗The dot plots of a searched regulon are shown for all cell subpopulations in each disease state of each tissue based on the regulon specific score inferred using pySCENIC and by calculating the average expression. |
| Page: 1 |
Top |
Somatic mutation of malignant transformation related genes |
| Annotation of somatic variants for genes involved in malignant transformation |
| Hugo Symbol | Variant Class | Variant Classification | dbSNP RS | HGVSc | HGVSp | HGVSp Short | SWISSPROT | BIOTYPE | SIFT | PolyPhen | Tumor Sample Barcode | Tissue | Histology | Sex | Age | Stage | Therapy Types | Drugs | Outcome |
| ZNF395 | SNV | Missense_Mutation | rs764292183 | c.1336C>T | p.Arg446Trp | p.R446W | Q9H8N7 | protein_coding | deleterious(0) | probably_damaging(0.992) | TCGA-A2-A0EV-01 | Breast | breast invasive carcinoma | Female | >=65 | I/II | Unknown | Unknown | SD |
| ZNF395 | SNV | Missense_Mutation | rs747728421 | c.1380N>T | p.Met460Ile | p.M460I | Q9H8N7 | protein_coding | tolerated(0.27) | benign(0) | TCGA-AN-A046-01 | Breast | breast invasive carcinoma | Female | >=65 | I/II | Unknown | Unknown | SD |
| ZNF395 | SNV | Missense_Mutation | c.1322N>G | p.Ser441Cys | p.S441C | Q9H8N7 | protein_coding | deleterious(0.01) | probably_damaging(0.912) | TCGA-C8-A26Y-01 | Breast | breast invasive carcinoma | Female | >=65 | I/II | Unknown | Unknown | SD | |
| ZNF395 | insertion | Frame_Shift_Ins | novel | c.1337_1338insATGGGTGACTC | p.Ser447TrpfsTer6 | p.S447Wfs*6 | Q9H8N7 | protein_coding | TCGA-A2-A0EV-01 | Breast | breast invasive carcinoma | Female | >=65 | I/II | Unknown | Unknown | SD | ||
| ZNF395 | SNV | Missense_Mutation | novel | c.805N>G | p.Pro269Ala | p.P269A | Q9H8N7 | protein_coding | deleterious(0) | probably_damaging(0.997) | TCGA-ZJ-AB0I-01 | Cervix | cervical & endocervical cancer | Female | <65 | I/II | Unknown | Unknown | SD |
| ZNF395 | SNV | Missense_Mutation | rs142226591 | c.124G>A | p.Ala42Thr | p.A42T | Q9H8N7 | protein_coding | tolerated(0.33) | benign(0) | TCGA-AD-6889-01 | Colorectum | colon adenocarcinoma | Male | >=65 | I/II | Chemotherapy | xeloda | PD |
| ZNF395 | SNV | Missense_Mutation | c.1538N>G | p.Asp513Gly | p.D513G | Q9H8N7 | protein_coding | deleterious(0) | probably_damaging(0.998) | TCGA-AZ-6598-01 | Colorectum | colon adenocarcinoma | Female | >=65 | I/II | Unknown | Unknown | SD | |
| ZNF395 | SNV | Missense_Mutation | c.982C>A | p.Leu328Met | p.L328M | Q9H8N7 | protein_coding | tolerated(0.36) | benign(0) | TCGA-AZ-6600-01 | Colorectum | colon adenocarcinoma | Male | <65 | III/IV | Chemotherapy | cpt-11 | PD | |
| ZNF395 | SNV | Missense_Mutation | novel | c.1382N>C | p.Lys461Thr | p.K461T | Q9H8N7 | protein_coding | tolerated(0.1) | probably_damaging(0.997) | TCGA-CA-6717-01 | Colorectum | colon adenocarcinoma | Male | <65 | I/II | Chemotherapy | oxaliplatin | CR |
| ZNF395 | SNV | Missense_Mutation | c.88G>A | p.Ala30Thr | p.A30T | Q9H8N7 | protein_coding | tolerated(0.63) | benign(0.342) | TCGA-DM-A28C-01 | Colorectum | colon adenocarcinoma | Male | >=65 | I/II | Unknown | Unknown | PD |
| Page: 1 2 3 4 5 6 |
Top |
Related drugs of malignant transformation related genes |
| Identification of chemicals and drugs interact with genes involved in malignant transfromation |
| (DGIdb 4.0) |
| Entrez ID | Symbol | Category | Interaction Types | Drug Claim Name | Drug Name | PMIDs |
| Page: 1 |

Copyright 2023-Present -The University of Texas Health Science Center at Houston |