
|
|||||
|
 | |
| |
| |
| |
| |
| |
|
Gene: ZNF385B |
Gene summary for ZNF385B |
| Gene information | Species | Human | Gene symbol | ZNF385B | Gene ID | 151126 |
| Gene name | zinc finger protein 385B | |
| Gene Alias | ZNF533 | |
| Cytomap | 2q31.2-q31.3 | |
| Gene Type | protein-coding | GO ID | GO:0006915 | UniProtAcc | Q569K4 |
Top |
Malignant transformation analysis |
| Identification of the aberrant gene expression in precancerous and cancerous lesions by comparing the gene expression of stem-like cells in diseased tissues with normal stem cells |
| Entrez ID | Symbol | Replicates | Species | Organ | Tissue | Adj P-value | Log2FC | Malignancy |
| 151126 | ZNF385B | NAFLD1 | Human | Liver | NAFLD | 2.22e-05 | 7.91e-01 | -0.04 |
| 151126 | ZNF385B | S43 | Human | Liver | Cirrhotic | 2.96e-05 | -2.54e-01 | -0.0187 |
| 151126 | ZNF385B | HCC1_Meng | Human | Liver | HCC | 3.66e-20 | -2.68e-01 | 0.0246 |
| 151126 | ZNF385B | HCC2_Meng | Human | Liver | HCC | 4.80e-10 | -3.00e-01 | 0.0107 |
| 151126 | ZNF385B | cirrhotic1 | Human | Liver | Cirrhotic | 3.13e-04 | -2.13e-01 | 0.0202 |
| 151126 | ZNF385B | cirrhotic2 | Human | Liver | Cirrhotic | 3.61e-09 | -1.17e-01 | 0.0201 |
| 151126 | ZNF385B | cirrhotic3 | Human | Liver | Cirrhotic | 1.21e-03 | -2.66e-01 | 0.0215 |
| 151126 | ZNF385B | HCC1 | Human | Liver | HCC | 9.74e-04 | 2.74e+00 | 0.5336 |
| 151126 | ZNF385B | HCC5 | Human | Liver | HCC | 1.55e-03 | 4.85e-01 | 0.4932 |
| 151126 | ZNF385B | Pt13.a | Human | Liver | HCC | 1.05e-09 | -3.00e-01 | 0.021 |
| 151126 | ZNF385B | Pt13.b | Human | Liver | HCC | 1.92e-04 | -3.00e-01 | 0.0251 |
| 151126 | ZNF385B | Pt13.c | Human | Liver | HCC | 4.12e-02 | -3.00e-01 | 0.0076 |
| 151126 | ZNF385B | Pt14.d | Human | Liver | HCC | 4.18e-07 | -2.87e-01 | 0.0143 |
| 151126 | ZNF385B | S014 | Human | Liver | HCC | 5.65e-03 | 8.45e-02 | 0.2254 |
| 151126 | ZNF385B | S016 | Human | Liver | HCC | 3.72e-03 | 1.10e-01 | 0.2243 |
| 151126 | ZNF385B | TD9 | Human | Lung | IAC | 2.78e-04 | 1.14e+00 | 0.088 |
| 151126 | ZNF385B | RNA-P10T1-P10T1-2 | Human | Lung | AIS | 3.93e-02 | 1.33e+00 | -0.1028 |
| 151126 | ZNF385B | RNA-P10T1-P10T1-4 | Human | Lung | AIS | 2.18e-03 | 1.46e+00 | -0.1173 |
| 151126 | ZNF385B | RNA-P10T2-P10T2-1 | Human | Lung | AAH | 1.77e-14 | 1.68e+00 | -0.1271 |
| 151126 | ZNF385B | RNA-P10T2-P10T2-2 | Human | Lung | AAH | 2.86e-15 | 1.72e+00 | -0.1406 |
| Page: 1 2 |
| Tissue | Expression Dynamics | Abbreviation |
| Liver | 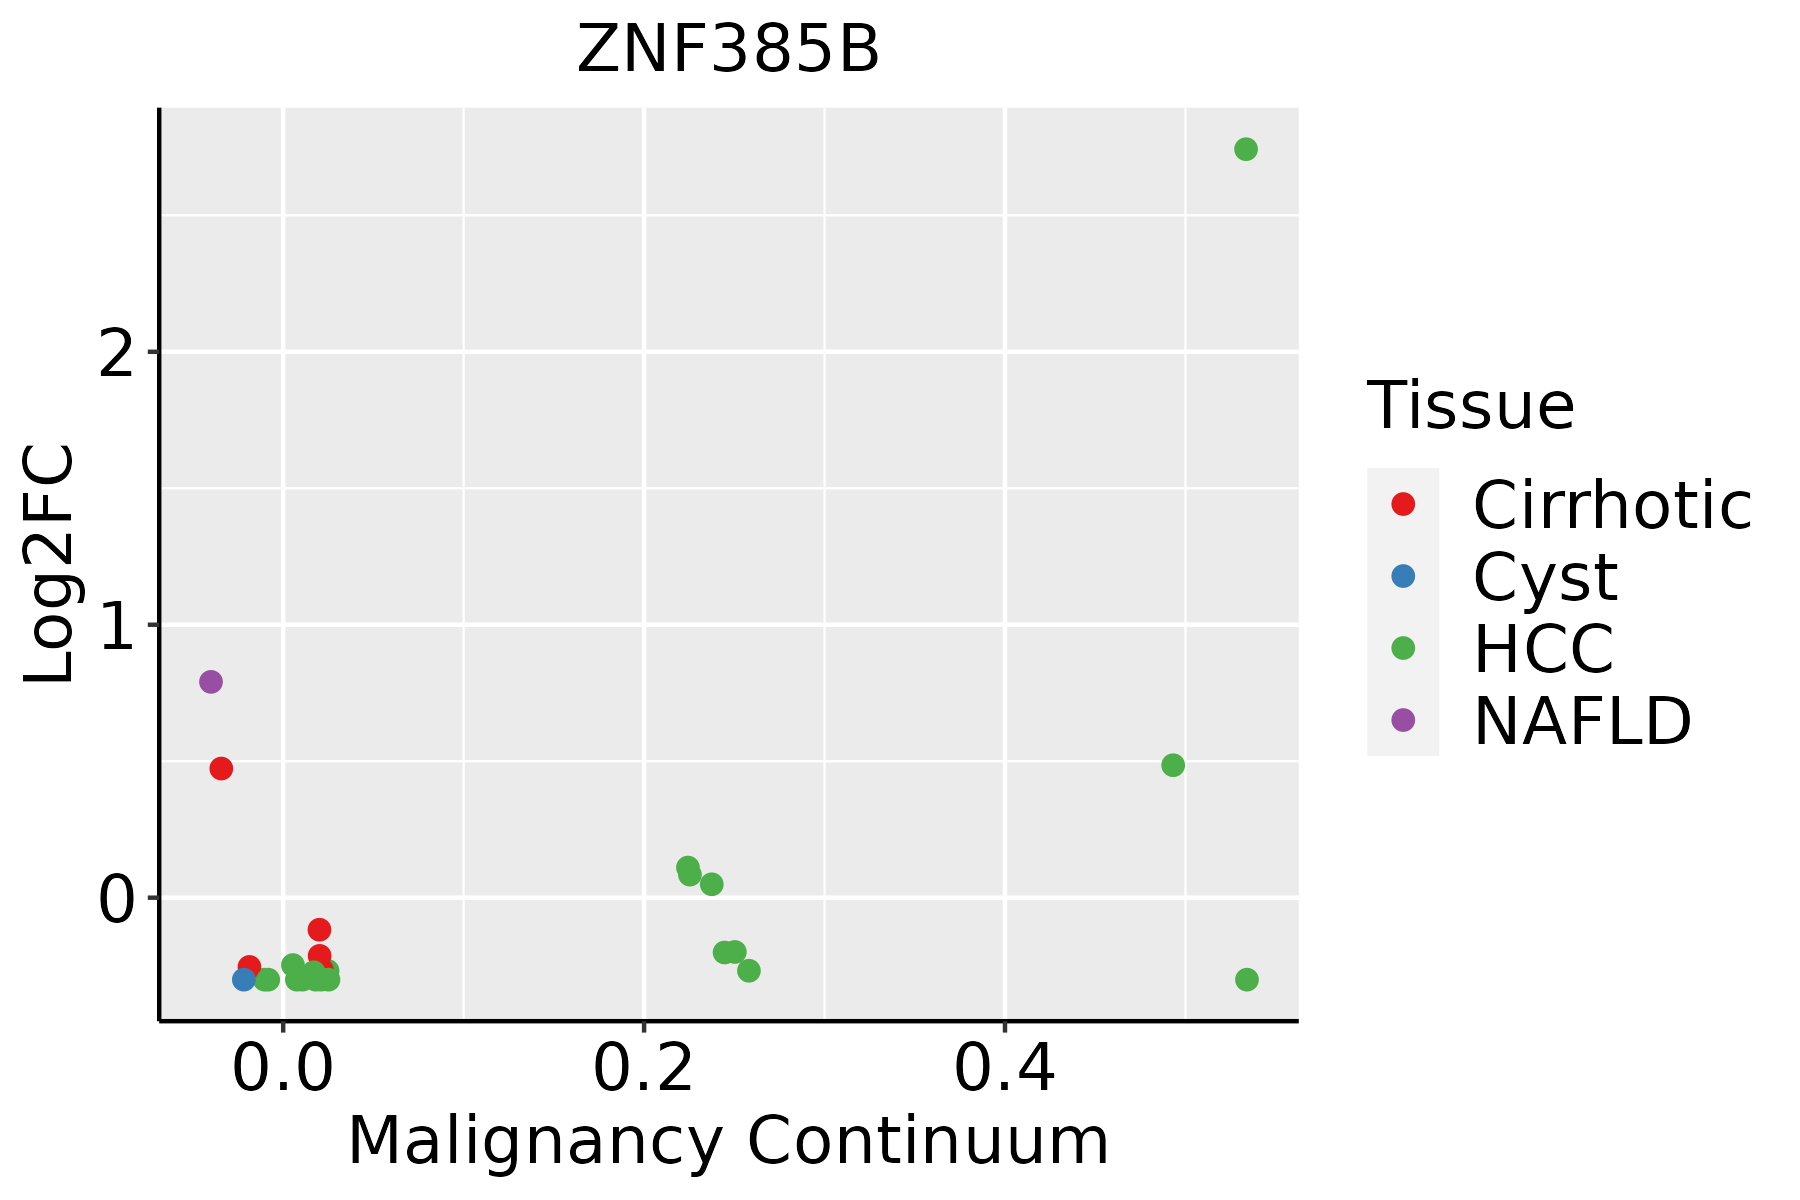 | HCC: Hepatocellular carcinoma |
| NAFLD: Non-alcoholic fatty liver disease | ||
| Lung | 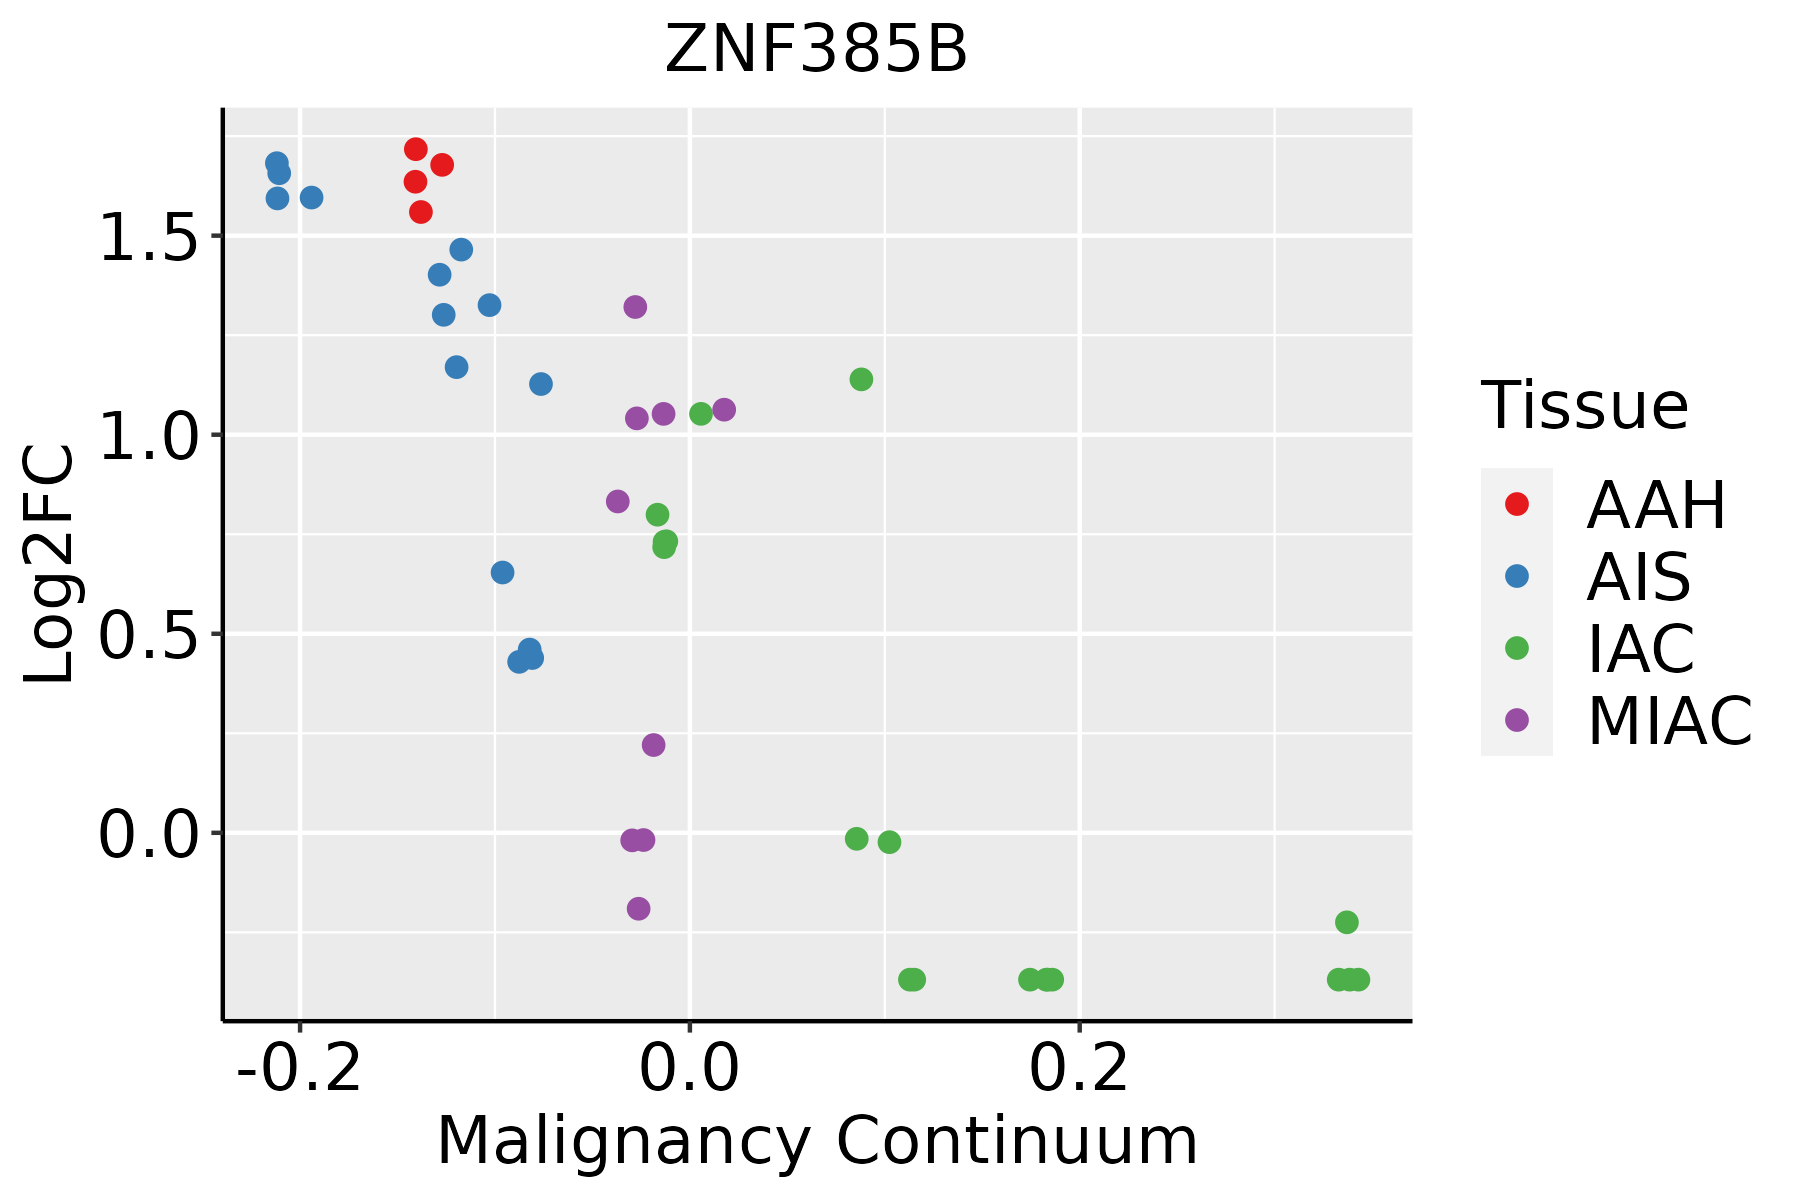 | AAH: Atypical adenomatous hyperplasia |
| AIS: Adenocarcinoma in situ | ||
| IAC: Invasive lung adenocarcinoma | ||
| MIA: Minimally invasive adenocarcinoma |
| ∗log2FC in expression of this searched gene in stem-like cells from each diseased tissue sample relative to stem-like cells in normal samples in each tissue plotted against the malignancy continuum. Samples are colored based on if they are from different disease stage. |
Top |
Malignant transformation related pathway analysis |
| Find out the enriched GO biological processes and KEGG pathways involved in transition from healthy to precancer to cancer |
| Tissue | Disease Stage | Enriched GO biological Processes |
| Colorectum | AD |  |
| Colorectum | SER |  |
| Colorectum | MSS |  |
| Colorectum | MSI-H |  |
| Colorectum | FAP |  |
| ∗Top 15 enriched GO BP terms are showed in the bar plot of each disease state in each tissue. Each row represents a significant GO biological process which is colored according to the -log10(p.adjust). |
| Page: 1 2 3 4 5 6 7 8 9 |
| GO ID | Tissue | Disease Stage | Description | Gene Ratio | Bg Ratio | pvalue | p.adjust | Count |
| GO:00723317 | Liver | NAFLD | signal transduction by p53 class mediator | 32/1882 | 163/18723 | 1.63e-04 | 2.99e-03 | 32 |
| GO:00971937 | Liver | NAFLD | intrinsic apoptotic signaling pathway | 44/1882 | 288/18723 | 3.24e-03 | 2.88e-02 | 44 |
| GO:009719312 | Liver | Cirrhotic | intrinsic apoptotic signaling pathway | 130/4634 | 288/18723 | 2.69e-14 | 2.45e-12 | 130 |
| GO:007233112 | Liver | Cirrhotic | signal transduction by p53 class mediator | 69/4634 | 163/18723 | 5.97e-07 | 1.30e-05 | 69 |
| GO:00723326 | Liver | Cirrhotic | intrinsic apoptotic signaling pathway by p53 class mediator | 38/4634 | 76/18723 | 1.75e-06 | 3.32e-05 | 38 |
| GO:009719322 | Liver | HCC | intrinsic apoptotic signaling pathway | 184/7958 | 288/18723 | 1.50e-13 | 8.32e-12 | 184 |
| GO:007233122 | Liver | HCC | signal transduction by p53 class mediator | 108/7958 | 163/18723 | 7.14e-10 | 2.23e-08 | 108 |
| GO:007233212 | Liver | HCC | intrinsic apoptotic signaling pathway by p53 class mediator | 51/7958 | 76/18723 | 1.27e-05 | 1.42e-04 | 51 |
| GO:00971938 | Lung | IAC | intrinsic apoptotic signaling pathway | 72/2061 | 288/18723 | 1.36e-11 | 4.83e-09 | 72 |
| GO:00723318 | Lung | IAC | signal transduction by p53 class mediator | 47/2061 | 163/18723 | 3.13e-10 | 7.15e-08 | 47 |
| GO:00723327 | Lung | IAC | intrinsic apoptotic signaling pathway by p53 class mediator | 25/2061 | 76/18723 | 2.76e-07 | 2.18e-05 | 25 |
| GO:007233113 | Lung | AIS | signal transduction by p53 class mediator | 44/1849 | 163/18723 | 3.66e-10 | 8.87e-08 | 44 |
| GO:009719313 | Lung | AIS | intrinsic apoptotic signaling pathway | 63/1849 | 288/18723 | 1.02e-09 | 2.12e-07 | 63 |
| GO:007233213 | Lung | AIS | intrinsic apoptotic signaling pathway by p53 class mediator | 22/1849 | 76/18723 | 2.53e-06 | 1.42e-04 | 22 |
| GO:007233123 | Lung | AAH | signal transduction by p53 class mediator | 18/613 | 163/18723 | 6.85e-06 | 1.74e-03 | 18 |
| GO:009719323 | Lung | AAH | intrinsic apoptotic signaling pathway | 21/613 | 288/18723 | 5.55e-04 | 2.23e-02 | 21 |
| GO:007233133 | Lung | MIAC | signal transduction by p53 class mediator | 28/967 | 163/18723 | 1.91e-08 | 9.78e-06 | 28 |
| GO:007233223 | Lung | MIAC | intrinsic apoptotic signaling pathway by p53 class mediator | 15/967 | 76/18723 | 6.55e-06 | 6.29e-04 | 15 |
| GO:009719333 | Lung | MIAC | intrinsic apoptotic signaling pathway | 29/967 | 288/18723 | 4.72e-04 | 1.29e-02 | 29 |
| Page: 1 |
| Pathway ID | Tissue | Disease Stage | Description | Gene Ratio | Bg Ratio | pvalue | p.adjust | qvalue | Count |
| Page: 1 |
Top |
Cell-cell communication analysis |
| Identification of potential cell-cell interactions between two cell types and their ligand-receptor pairs for different disease states |
| Ligand | Receptor | LRpair | Pathway | Tissue | Disease Stage |
| Page: 1 |
Top |
Single-cell gene regulatory network inference analysis |
| Find out the significant the regulons (TFs) and the target genes of each regulon across cell types for different disease states |
| TF | Cell Type | Tissue | Disease Stage | Target Gene | RSS | Regulon Activity |
| ∗The dot plots of a searched regulon are shown for all cell subpopulations in each disease state of each tissue based on the regulon specific score inferred using pySCENIC and by calculating the average expression. |
| Page: 1 |
Top |
Somatic mutation of malignant transformation related genes |
| Annotation of somatic variants for genes involved in malignant transformation |
| Hugo Symbol | Variant Class | Variant Classification | dbSNP RS | HGVSc | HGVSp | HGVSp Short | SWISSPROT | BIOTYPE | SIFT | PolyPhen | Tumor Sample Barcode | Tissue | Histology | Sex | Age | Stage | Therapy Types | Drugs | Outcome |
| ZNF385B | SNV | Missense_Mutation | rs753184978 | c.293N>A | p.Arg98His | p.R98H | Q569K4 | protein_coding | tolerated(0.15) | probably_damaging(0.987) | TCGA-3C-AALJ-01 | Breast | breast invasive carcinoma | Female | <65 | I/II | Chemotherapy | doxorubicin | SD |
| ZNF385B | SNV | Missense_Mutation | novel | c.776C>A | p.Ala259Asp | p.A259D | Q569K4 | protein_coding | tolerated(0.3) | benign(0) | TCGA-A7-A26F-01 | Breast | breast invasive carcinoma | Female | <65 | I/II | Chemotherapy | taxotere | SD |
| ZNF385B | SNV | Missense_Mutation | c.829G>C | p.Glu277Gln | p.E277Q | Q569K4 | protein_coding | deleterious(0.02) | probably_damaging(0.994) | TCGA-LL-A73Y-01 | Breast | breast invasive carcinoma | Female | >=65 | I/II | Chemotherapy | taxotere | SD | |
| ZNF385B | deletion | Frame_Shift_Del | novel | c.955delG | p.Ala319LeufsTer14 | p.A319Lfs*14 | Q569K4 | protein_coding | TCGA-D8-A27V-01 | Breast | breast invasive carcinoma | Female | <65 | I/II | Hormone Therapy | tamoxiphen | SD | ||
| ZNF385B | deletion | Frame_Shift_Del | novel | c.812delG | p.Gly271ValfsTer24 | p.G271Vfs*24 | Q569K4 | protein_coding | TCGA-D8-A27V-01 | Breast | breast invasive carcinoma | Female | <65 | I/II | Hormone Therapy | tamoxiphen | SD | ||
| ZNF385B | deletion | Frame_Shift_Del | novel | c.190delC | p.Gln64SerfsTer2 | p.Q64Sfs*2 | Q569K4 | protein_coding | TCGA-D8-A27V-01 | Breast | breast invasive carcinoma | Female | <65 | I/II | Hormone Therapy | tamoxiphen | SD | ||
| ZNF385B | deletion | Frame_Shift_Del | novel | c.1007delN | p.Asn336MetfsTer46 | p.N336Mfs*46 | Q569K4 | protein_coding | TCGA-EW-A2FV-01 | Breast | breast invasive carcinoma | Female | <65 | III/IV | Chemotherapy | docetaxel | SD | ||
| ZNF385B | deletion | Frame_Shift_Del | novel | c.840delN | p.Ala281ProfsTer14 | p.A281Pfs*14 | Q569K4 | protein_coding | TCGA-EA-A3HU-01 | Cervix | cervical & endocervical cancer | Female | <65 | I/II | Unknown | Unknown | SD | ||
| ZNF385B | SNV | Missense_Mutation | rs200150920 | c.1177N>T | p.Arg393Trp | p.R393W | Q569K4 | protein_coding | deleterious(0) | probably_damaging(0.998) | TCGA-AA-3952-01 | Colorectum | colon adenocarcinoma | Male | >=65 | III/IV | Unknown | Unknown | PD |
| ZNF385B | SNV | Missense_Mutation | c.488N>T | p.Gln163Leu | p.Q163L | Q569K4 | protein_coding | deleterious(0.03) | probably_damaging(0.994) | TCGA-AD-6899-01 | Colorectum | colon adenocarcinoma | Male | >=65 | III/IV | Unknown | Unknown | SD |
| Page: 1 2 3 4 5 6 7 8 |
Top |
Related drugs of malignant transformation related genes |
| Identification of chemicals and drugs interact with genes involved in malignant transfromation |
| (DGIdb 4.0) |
| Entrez ID | Symbol | Category | Interaction Types | Drug Claim Name | Drug Name | PMIDs |
| Page: 1 |

Copyright 2023-Present -The University of Texas Health Science Center at Houston |