
|
|||||
|
 | |
| |
| |
| |
| |
| |
|
Gene: ZNF385A |
Gene summary for ZNF385A |
| Gene information | Species | Human | Gene symbol | ZNF385A | Gene ID | 25946 |
| Gene name | zinc finger protein 385A | |
| Gene Alias | HZF | |
| Cytomap | 12q13.13 | |
| Gene Type | protein-coding | GO ID | GO:0001501 | UniProtAcc | Q96PM9 |
Top |
Malignant transformation analysis |
| Identification of the aberrant gene expression in precancerous and cancerous lesions by comparing the gene expression of stem-like cells in diseased tissues with normal stem cells |
| Entrez ID | Symbol | Replicates | Species | Organ | Tissue | Adj P-value | Log2FC | Malignancy |
| 25946 | ZNF385A | LZE2T | Human | Esophagus | ESCC | 1.16e-04 | 4.44e-01 | 0.082 |
| 25946 | ZNF385A | LZE4T | Human | Esophagus | ESCC | 4.49e-14 | 5.07e-01 | 0.0811 |
| 25946 | ZNF385A | LZE7T | Human | Esophagus | ESCC | 1.19e-04 | 3.13e-01 | 0.0667 |
| 25946 | ZNF385A | LZE8T | Human | Esophagus | ESCC | 1.07e-10 | 3.91e-01 | 0.067 |
| 25946 | ZNF385A | LZE20T | Human | Esophagus | ESCC | 7.78e-07 | 2.81e-01 | 0.0662 |
| 25946 | ZNF385A | LZE21D1 | Human | Esophagus | HGIN | 5.91e-03 | 2.60e-01 | 0.0632 |
| 25946 | ZNF385A | LZE22D1 | Human | Esophagus | HGIN | 1.52e-02 | 3.06e-01 | 0.0595 |
| 25946 | ZNF385A | LZE22T | Human | Esophagus | ESCC | 1.42e-06 | 8.04e-01 | 0.068 |
| 25946 | ZNF385A | LZE24T | Human | Esophagus | ESCC | 2.14e-31 | 1.09e+00 | 0.0596 |
| 25946 | ZNF385A | LZE21T | Human | Esophagus | ESCC | 1.25e-09 | 6.55e-01 | 0.0655 |
| 25946 | ZNF385A | P1T-E | Human | Esophagus | ESCC | 1.37e-10 | 8.04e-01 | 0.0875 |
| 25946 | ZNF385A | P2T-E | Human | Esophagus | ESCC | 1.74e-51 | 1.10e+00 | 0.1177 |
| 25946 | ZNF385A | P4T-E | Human | Esophagus | ESCC | 3.38e-23 | 6.21e-01 | 0.1323 |
| 25946 | ZNF385A | P5T-E | Human | Esophagus | ESCC | 1.35e-30 | 7.67e-01 | 0.1327 |
| 25946 | ZNF385A | P8T-E | Human | Esophagus | ESCC | 2.32e-24 | 6.47e-01 | 0.0889 |
| 25946 | ZNF385A | P9T-E | Human | Esophagus | ESCC | 8.91e-29 | 7.21e-01 | 0.1131 |
| 25946 | ZNF385A | P10T-E | Human | Esophagus | ESCC | 3.68e-42 | 8.30e-01 | 0.116 |
| 25946 | ZNF385A | P11T-E | Human | Esophagus | ESCC | 1.52e-26 | 9.03e-01 | 0.1426 |
| 25946 | ZNF385A | P12T-E | Human | Esophagus | ESCC | 1.84e-72 | 1.64e+00 | 0.1122 |
| 25946 | ZNF385A | P15T-E | Human | Esophagus | ESCC | 1.24e-63 | 1.42e+00 | 0.1149 |
| Page: 1 2 3 4 5 6 |
| Tissue | Expression Dynamics | Abbreviation |
| Esophagus | 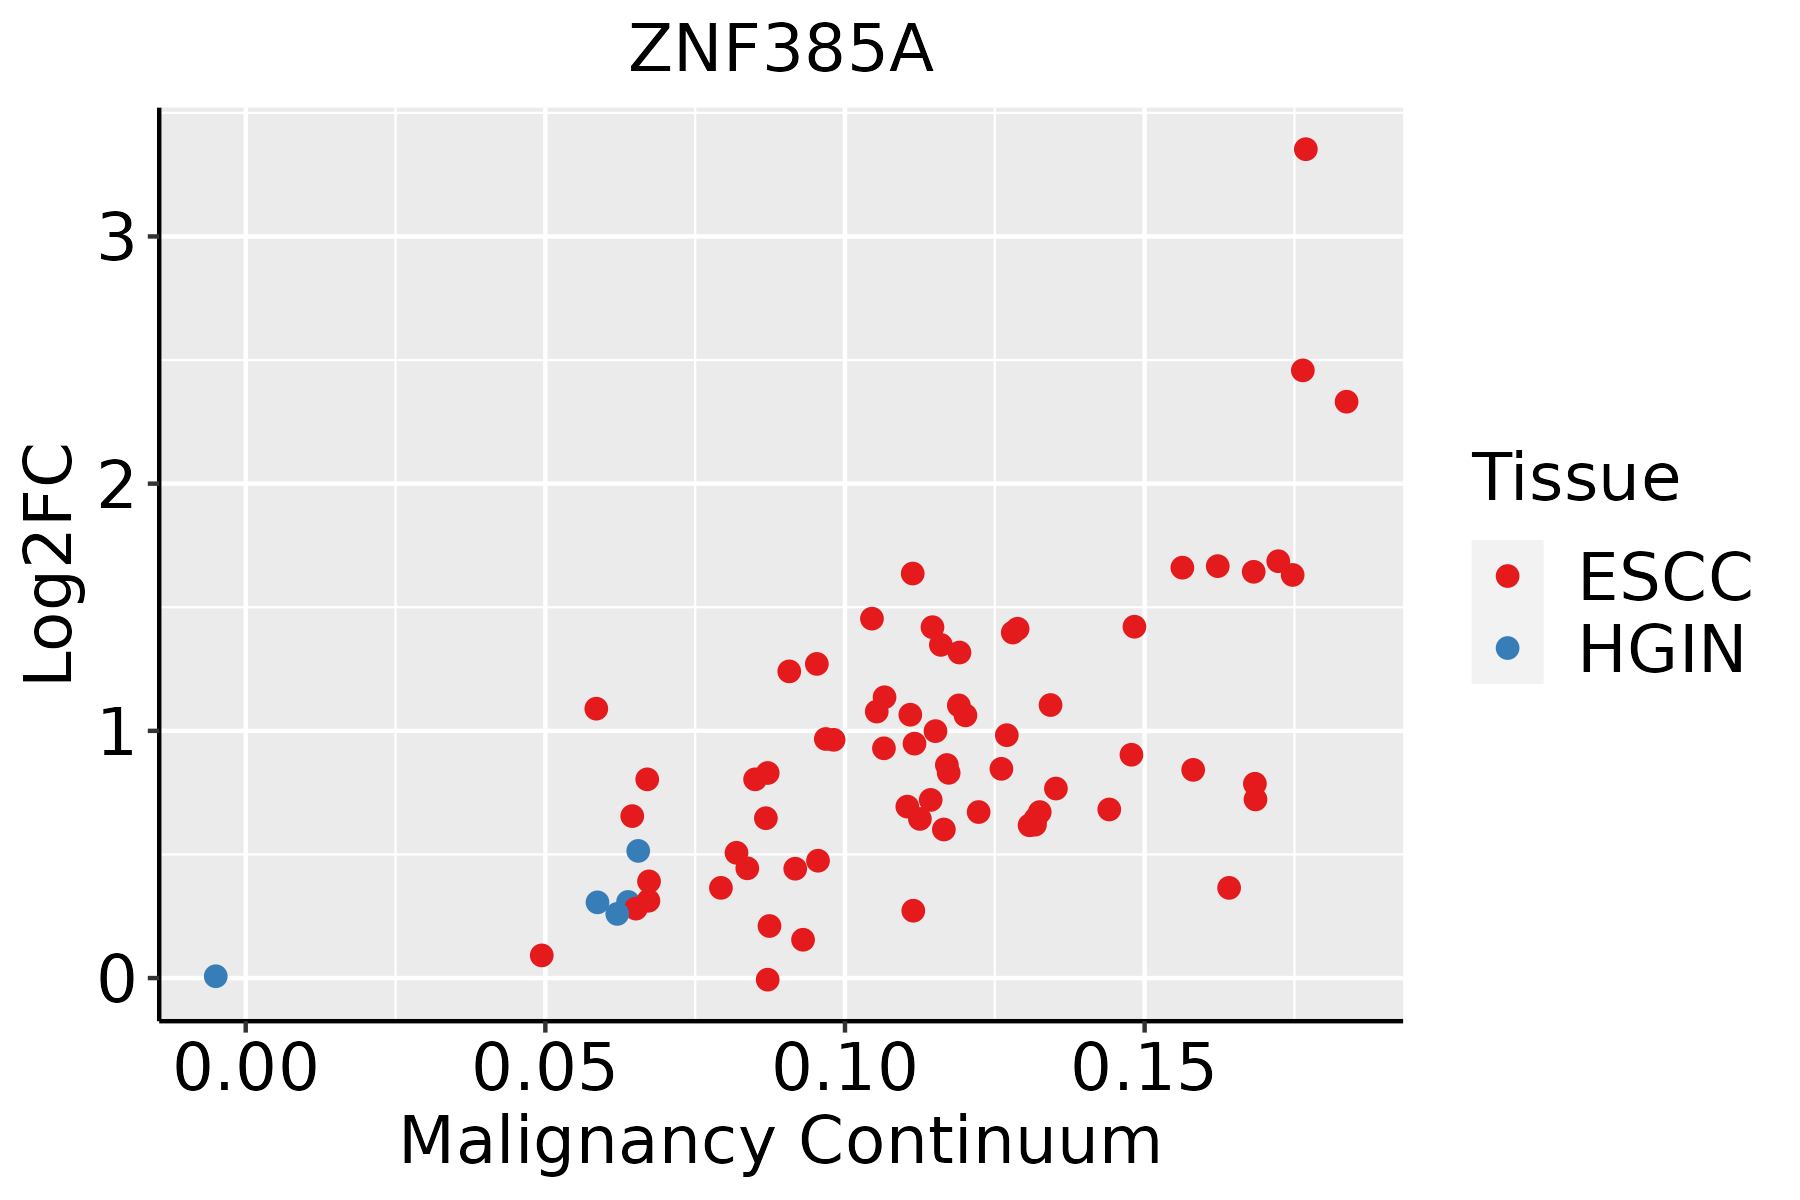 | ESCC: Esophageal squamous cell carcinoma |
| HGIN: High-grade intraepithelial neoplasias | ||
| LGIN: Low-grade intraepithelial neoplasias | ||
| Liver | 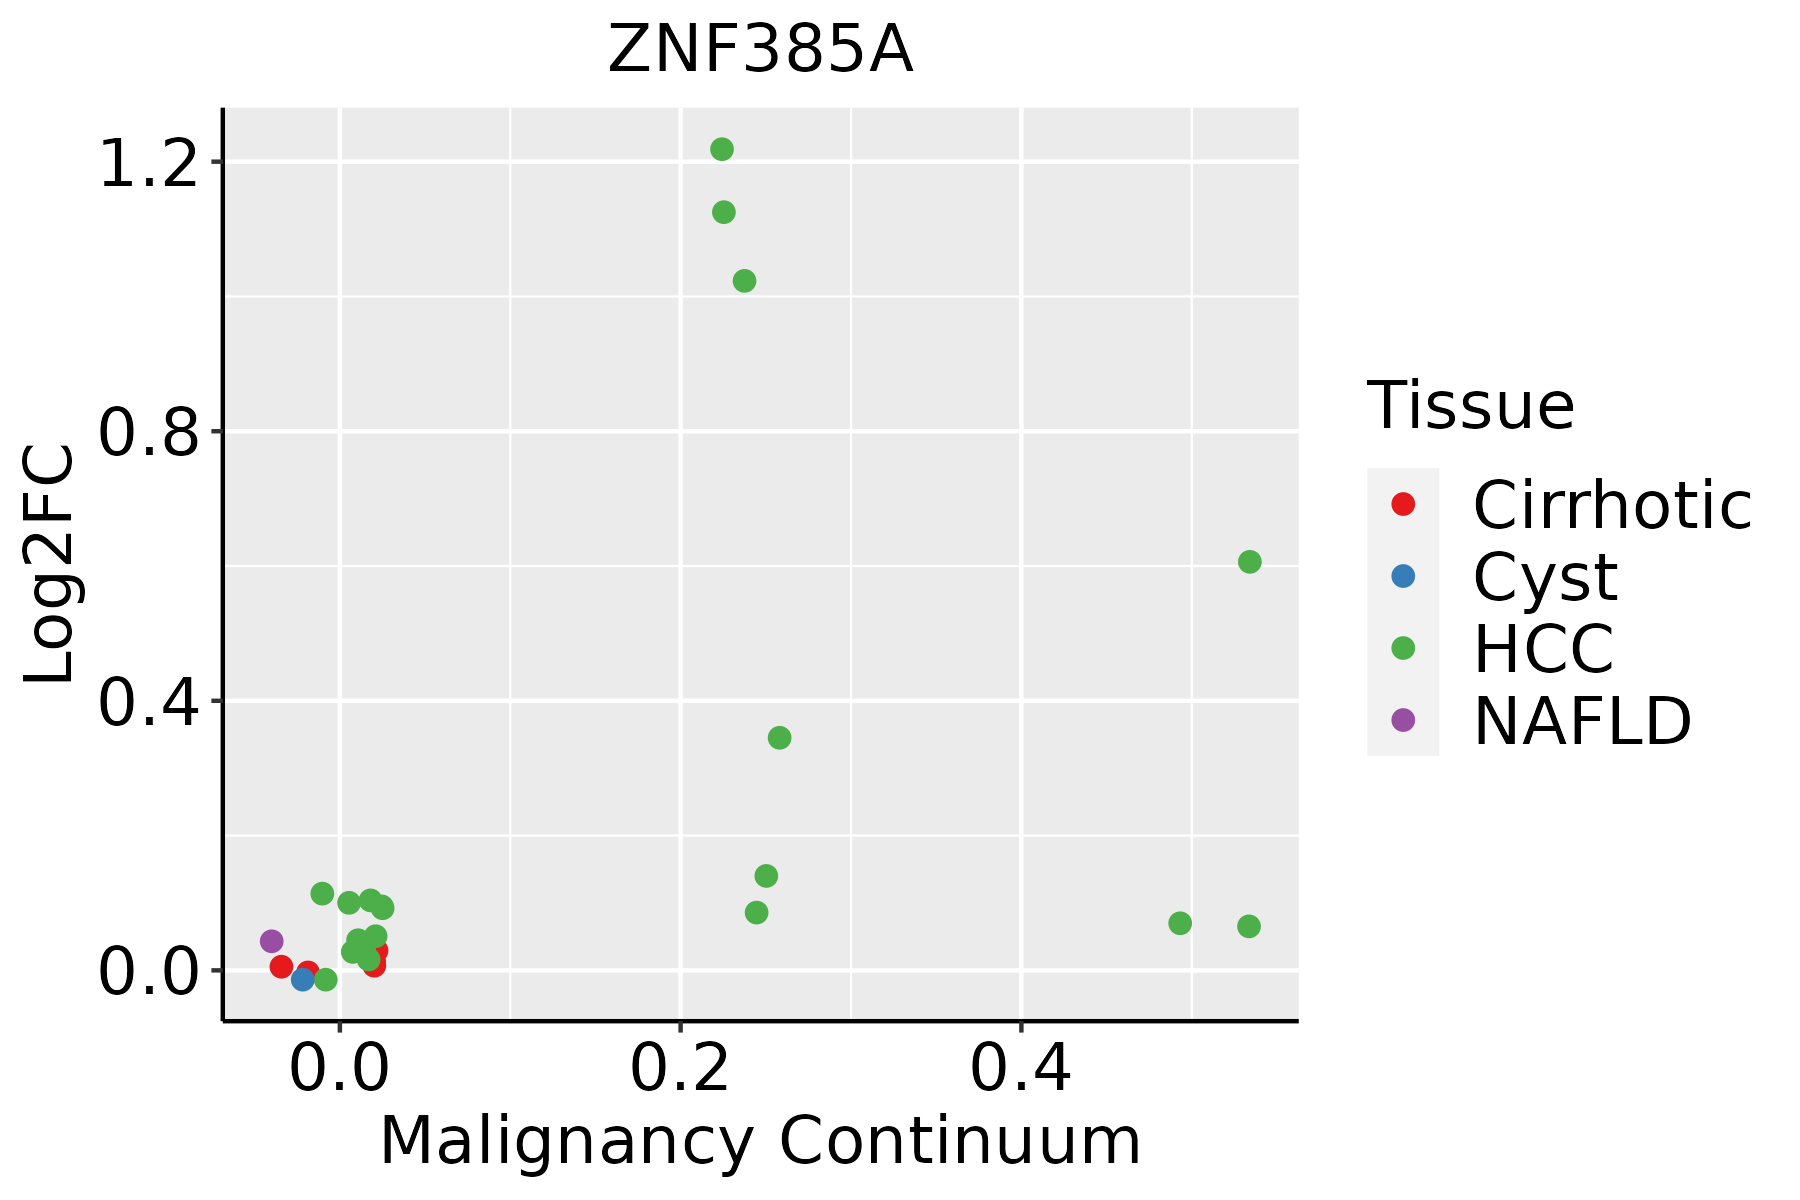 | HCC: Hepatocellular carcinoma |
| NAFLD: Non-alcoholic fatty liver disease | ||
| Oral Cavity |  | EOLP: Erosive Oral lichen planus |
| LP: leukoplakia | ||
| NEOLP: Non-erosive oral lichen planus | ||
| OSCC: Oral squamous cell carcinoma | ||
| Skin | 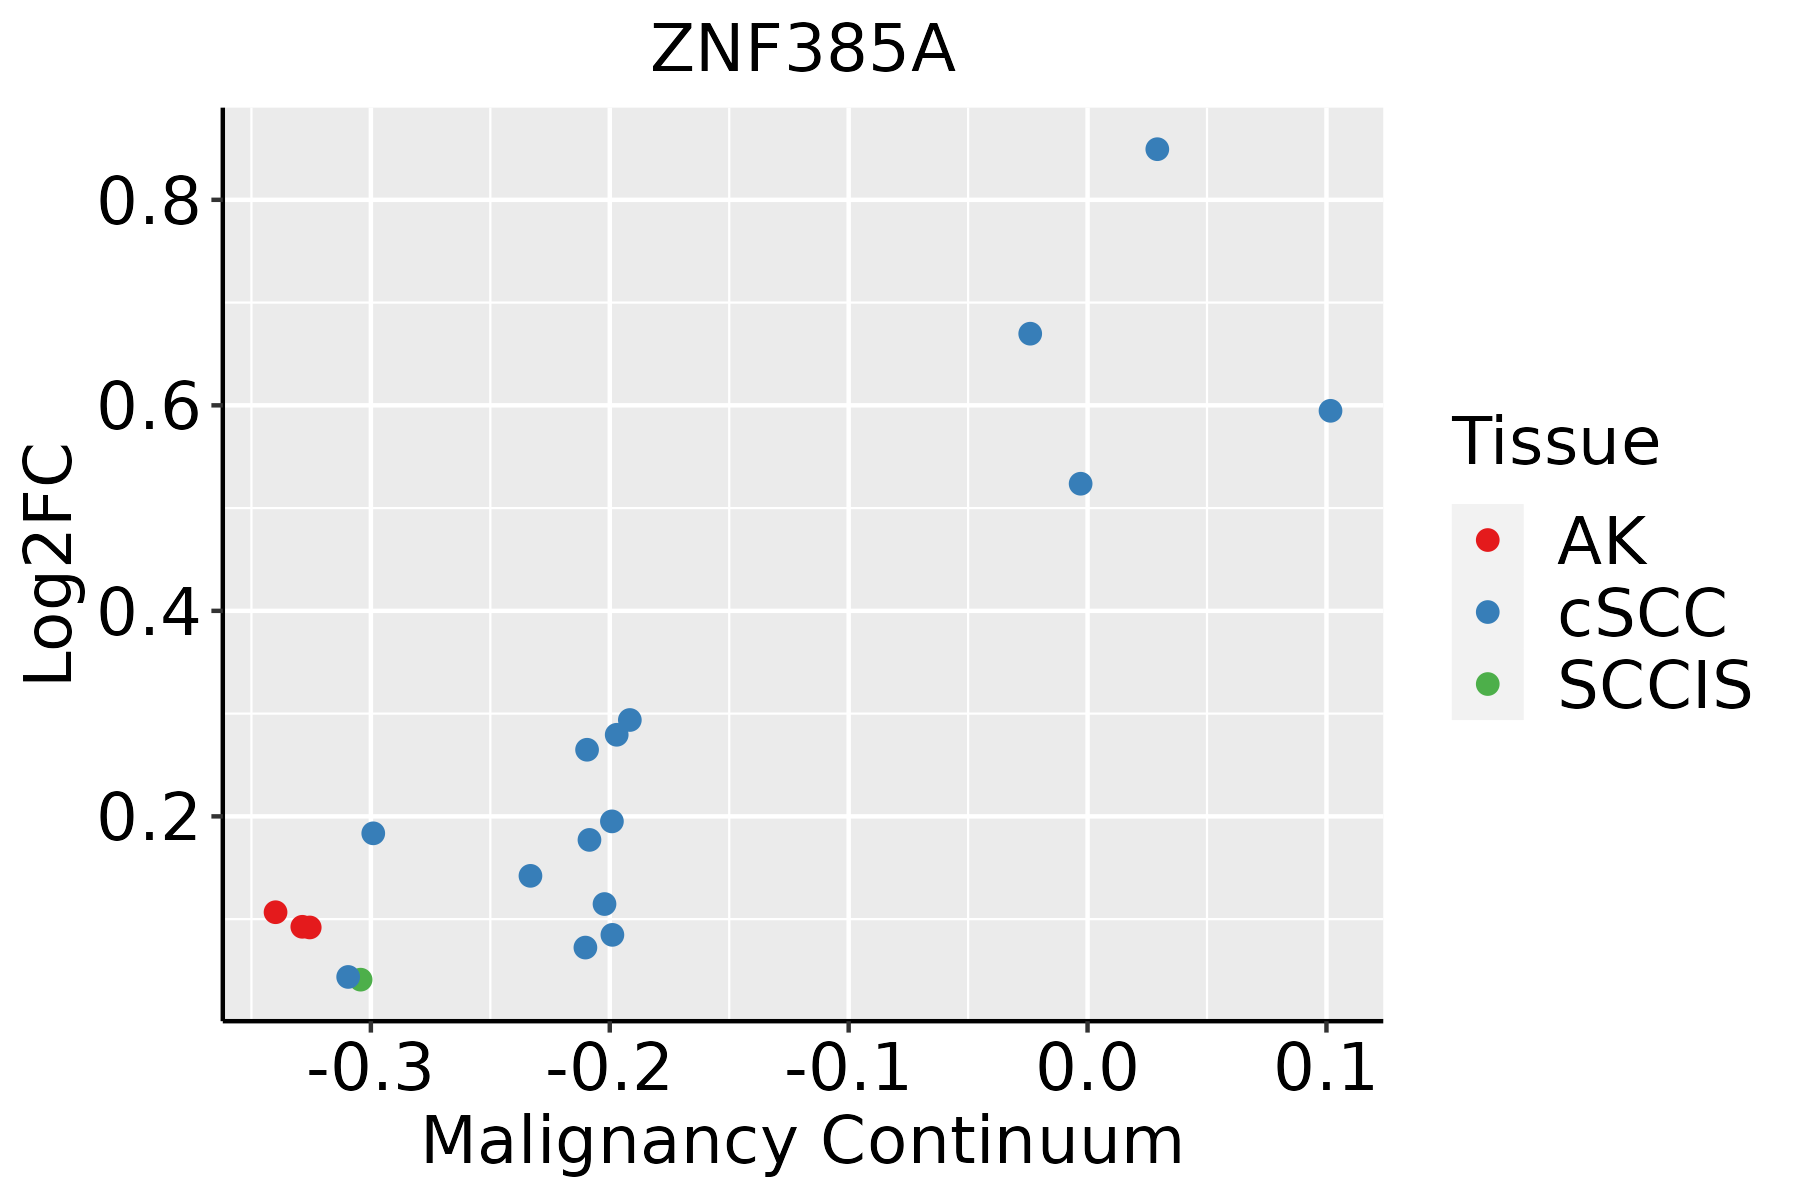 | AK: Actinic keratosis |
| cSCC: Cutaneous squamous cell carcinoma | ||
| SCCIS:squamous cell carcinoma in situ | ||
| Thyroid | 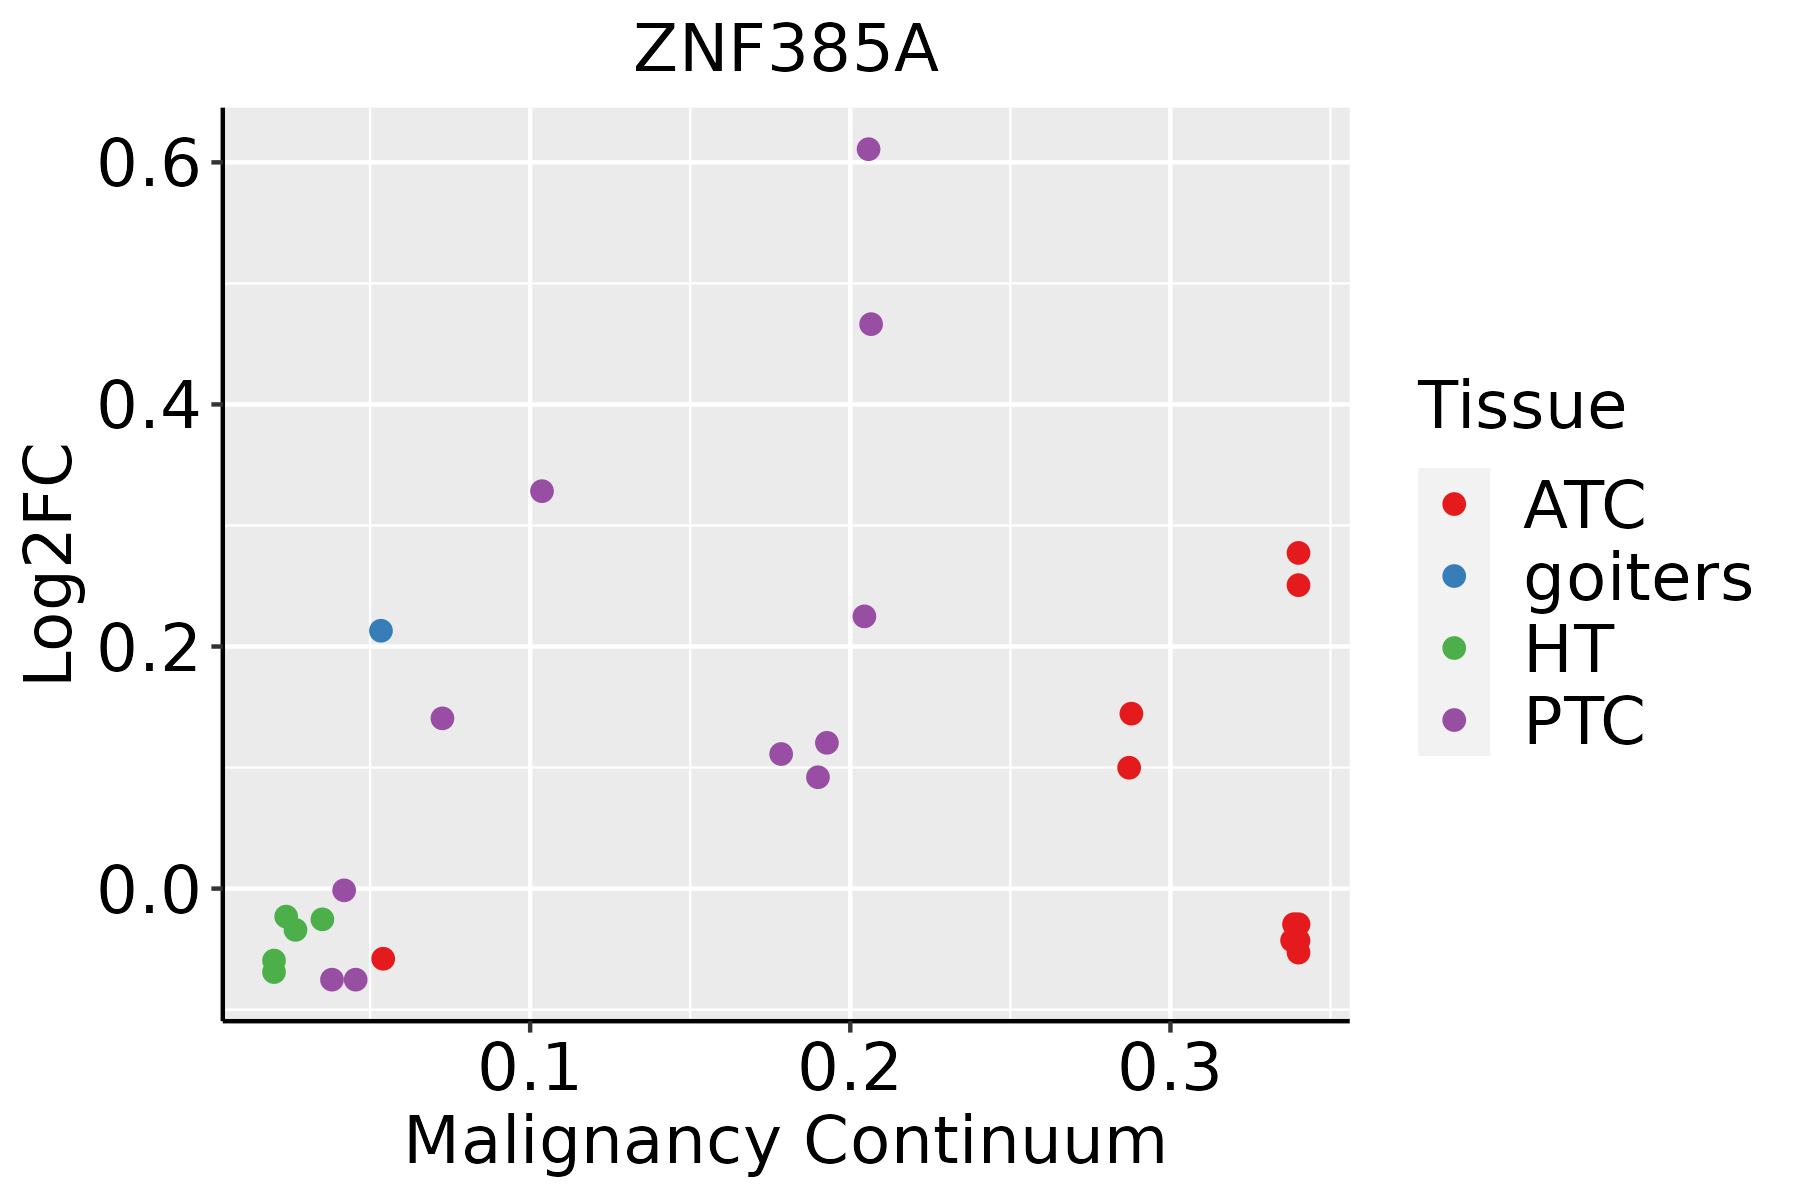 | ATC: Anaplastic thyroid cancer |
| HT: Hashimoto's thyroiditis | ||
| PTC: Papillary thyroid cancer |
| ∗log2FC in expression of this searched gene in stem-like cells from each diseased tissue sample relative to stem-like cells in normal samples in each tissue plotted against the malignancy continuum. Samples are colored based on if they are from different disease stage. |
Top |
Malignant transformation related pathway analysis |
| Find out the enriched GO biological processes and KEGG pathways involved in transition from healthy to precancer to cancer |
| Tissue | Disease Stage | Enriched GO biological Processes |
| Colorectum | AD |  |
| Colorectum | SER |  |
| Colorectum | MSS |  |
| Colorectum | MSI-H |  |
| Colorectum | FAP |  |
| ∗Top 15 enriched GO BP terms are showed in the bar plot of each disease state in each tissue. Each row represents a significant GO biological process which is colored according to the -log10(p.adjust). |
| Page: 1 2 3 4 5 6 7 8 9 |
| GO ID | Tissue | Disease Stage | Description | Gene Ratio | Bg Ratio | pvalue | p.adjust | Count |
| GO:000218127 | Esophagus | HGIN | cytoplasmic translation | 108/2587 | 148/18723 | 1.70e-60 | 1.02e-56 | 108 |
| GO:000641727 | Esophagus | HGIN | regulation of translation | 139/2587 | 468/18723 | 1.46e-19 | 7.98e-17 | 139 |
| GO:009719327 | Esophagus | HGIN | intrinsic apoptotic signaling pathway | 90/2587 | 288/18723 | 1.50e-14 | 2.80e-12 | 90 |
| GO:200124227 | Esophagus | HGIN | regulation of intrinsic apoptotic signaling pathway | 58/2587 | 164/18723 | 2.57e-12 | 3.58e-10 | 58 |
| GO:000640320 | Esophagus | HGIN | RNA localization | 66/2587 | 201/18723 | 4.06e-12 | 5.41e-10 | 66 |
| GO:200123327 | Esophagus | HGIN | regulation of apoptotic signaling pathway | 97/2587 | 356/18723 | 1.36e-11 | 1.57e-09 | 97 |
| GO:007233127 | Esophagus | HGIN | signal transduction by p53 class mediator | 49/2587 | 163/18723 | 5.71e-08 | 3.06e-06 | 49 |
| GO:200123427 | Esophagus | HGIN | negative regulation of apoptotic signaling pathway | 59/2587 | 224/18723 | 4.68e-07 | 2.07e-05 | 59 |
| GO:200124325 | Esophagus | HGIN | negative regulation of intrinsic apoptotic signaling pathway | 33/2587 | 98/18723 | 4.73e-07 | 2.07e-05 | 33 |
| GO:007233220 | Esophagus | HGIN | intrinsic apoptotic signaling pathway by p53 class mediator | 26/2587 | 76/18723 | 5.43e-06 | 1.73e-04 | 26 |
| GO:190179827 | Esophagus | HGIN | positive regulation of signal transduction by p53 class mediator | 13/2587 | 25/18723 | 6.62e-06 | 2.07e-04 | 13 |
| GO:003009927 | Esophagus | HGIN | myeloid cell differentiation | 83/2587 | 381/18723 | 1.26e-05 | 3.52e-04 | 83 |
| GO:003033020 | Esophagus | HGIN | DNA damage response, signal transduction by p53 class mediator | 24/2587 | 72/18723 | 2.03e-05 | 5.43e-04 | 24 |
| GO:200102019 | Esophagus | HGIN | regulation of response to DNA damage stimulus | 52/2587 | 219/18723 | 5.00e-05 | 1.19e-03 | 52 |
| GO:000863020 | Esophagus | HGIN | intrinsic apoptotic signaling pathway in response to DNA damage | 28/2587 | 99/18723 | 1.24e-04 | 2.54e-03 | 28 |
| GO:190179627 | Esophagus | HGIN | regulation of signal transduction by p53 class mediator | 26/2587 | 93/18723 | 2.60e-04 | 4.55e-03 | 26 |
| GO:004277120 | Esophagus | HGIN | intrinsic apoptotic signaling pathway in response to DNA damage by p53 class mediator | 15/2587 | 43/18723 | 4.06e-04 | 6.15e-03 | 15 |
| GO:00427708 | Esophagus | HGIN | signal transduction in response to DNA damage | 39/2587 | 172/18723 | 1.07e-03 | 1.32e-02 | 39 |
| GO:190225320 | Esophagus | HGIN | regulation of intrinsic apoptotic signaling pathway by p53 class mediator | 11/2587 | 29/18723 | 1.08e-03 | 1.32e-02 | 11 |
| GO:00435168 | Esophagus | HGIN | regulation of DNA damage response, signal transduction by p53 class mediator | 11/2587 | 34/18723 | 4.61e-03 | 3.96e-02 | 11 |
| Page: 1 2 3 4 5 6 7 8 9 10 11 12 |
| Pathway ID | Tissue | Disease Stage | Description | Gene Ratio | Bg Ratio | pvalue | p.adjust | qvalue | Count |
| hsa0411510 | Esophagus | HGIN | p53 signaling pathway | 21/1383 | 74/8465 | 6.25e-03 | 4.25e-02 | 3.37e-02 | 21 |
| hsa0411515 | Esophagus | HGIN | p53 signaling pathway | 21/1383 | 74/8465 | 6.25e-03 | 4.25e-02 | 3.37e-02 | 21 |
| hsa0411524 | Esophagus | ESCC | p53 signaling pathway | 65/4205 | 74/8465 | 3.88e-12 | 6.50e-11 | 3.33e-11 | 65 |
| hsa0411534 | Esophagus | ESCC | p53 signaling pathway | 65/4205 | 74/8465 | 3.88e-12 | 6.50e-11 | 3.33e-11 | 65 |
| hsa041159 | Oral cavity | OSCC | p53 signaling pathway | 57/3704 | 74/8465 | 4.99e-09 | 5.07e-08 | 2.58e-08 | 57 |
| hsa0411514 | Oral cavity | OSCC | p53 signaling pathway | 57/3704 | 74/8465 | 4.99e-09 | 5.07e-08 | 2.58e-08 | 57 |
| hsa0411523 | Oral cavity | LP | p53 signaling pathway | 38/2418 | 74/8465 | 2.82e-05 | 1.92e-04 | 1.24e-04 | 38 |
| hsa0411533 | Oral cavity | LP | p53 signaling pathway | 38/2418 | 74/8465 | 2.82e-05 | 1.92e-04 | 1.24e-04 | 38 |
| Page: 1 |
Top |
Cell-cell communication analysis |
| Identification of potential cell-cell interactions between two cell types and their ligand-receptor pairs for different disease states |
| Ligand | Receptor | LRpair | Pathway | Tissue | Disease Stage |
| Page: 1 |
Top |
Single-cell gene regulatory network inference analysis |
| Find out the significant the regulons (TFs) and the target genes of each regulon across cell types for different disease states |
| TF | Cell Type | Tissue | Disease Stage | Target Gene | RSS | Regulon Activity |
| ∗The dot plots of a searched regulon are shown for all cell subpopulations in each disease state of each tissue based on the regulon specific score inferred using pySCENIC and by calculating the average expression. |
| Page: 1 |
Top |
Somatic mutation of malignant transformation related genes |
| Annotation of somatic variants for genes involved in malignant transformation |
| Hugo Symbol | Variant Class | Variant Classification | dbSNP RS | HGVSc | HGVSp | HGVSp Short | SWISSPROT | BIOTYPE | SIFT | PolyPhen | Tumor Sample Barcode | Tissue | Histology | Sex | Age | Stage | Therapy Types | Drugs | Outcome |
| ZNF385A | SNV | Missense_Mutation | novel | c.877N>A | p.Pro293Thr | p.P293T | Q96PM9 | protein_coding | deleterious(0) | probably_damaging(0.999) | TCGA-E2-A1IN-01 | Breast | breast invasive carcinoma | Female | <65 | I/II | Hormone Therapy | arimidex | SD |
| ZNF385A | SNV | Missense_Mutation | novel | c.161A>G | p.Gln54Arg | p.Q54R | Q96PM9 | protein_coding | deleterious(0) | possibly_damaging(0.802) | TCGA-OL-A66J-01 | Breast | breast invasive carcinoma | Female | >=65 | I/II | Unknown | Unknown | SD |
| ZNF385A | SNV | Missense_Mutation | c.692N>T | p.Ala231Val | p.A231V | Q96PM9 | protein_coding | deleterious(0) | probably_damaging(0.999) | TCGA-EA-A1QT-01 | Cervix | cervical & endocervical cancer | Female | <65 | I/II | Unknown | Unknown | SD | |
| ZNF385A | SNV | Missense_Mutation | novel | c.299N>C | p.Arg100Pro | p.R100P | Q96PM9 | protein_coding | deleterious(0) | probably_damaging(0.999) | TCGA-VS-A9V4-01 | Cervix | cervical & endocervical cancer | Female | <65 | I/II | Chemotherapy | cisplatin | PD |
| ZNF385A | SNV | Missense_Mutation | novel | c.89N>C | p.Ile30Thr | p.I30T | Q96PM9 | protein_coding | deleterious(0) | benign(0.264) | TCGA-A6-5661-01 | Colorectum | colon adenocarcinoma | Female | >=65 | I/II | Unknown | Unknown | SD |
| ZNF385A | SNV | Missense_Mutation | c.220A>G | p.Ile74Val | p.I74V | Q96PM9 | protein_coding | tolerated(0.08) | probably_damaging(0.99) | TCGA-AA-3663-01 | Colorectum | colon adenocarcinoma | Male | <65 | I/II | Unknown | Unknown | SD | |
| ZNF385A | SNV | Missense_Mutation | c.238N>A | p.Gln80Lys | p.Q80K | Q96PM9 | protein_coding | deleterious(0.03) | probably_damaging(0.99) | TCGA-AA-3977-01 | Colorectum | colon adenocarcinoma | Male | >=65 | I/II | Unknown | Unknown | SD | |
| ZNF385A | SNV | Missense_Mutation | c.465N>T | p.Glu155Asp | p.E155D | Q96PM9 | protein_coding | tolerated(0.42) | benign(0.006) | TCGA-AA-A00N-01 | Colorectum | colon adenocarcinoma | Male | >=65 | I/II | Unknown | Unknown | PD | |
| ZNF385A | SNV | Missense_Mutation | novel | c.907N>A | p.Ser303Thr | p.S303T | Q96PM9 | protein_coding | tolerated(0.8) | benign(0.034) | TCGA-AA-A010-01 | Colorectum | colon adenocarcinoma | Female | <65 | I/II | Chemotherapy | folinic | CR |
| ZNF385A | SNV | Missense_Mutation | c.736C>T | p.Pro246Ser | p.P246S | Q96PM9 | protein_coding | tolerated(1) | benign(0.281) | TCGA-AA-A01P-01 | Colorectum | colon adenocarcinoma | Female | >=65 | III/IV | Unknown | Unknown | PD |
| Page: 1 2 3 4 |
Top |
Related drugs of malignant transformation related genes |
| Identification of chemicals and drugs interact with genes involved in malignant transfromation |
| (DGIdb 4.0) |
| Entrez ID | Symbol | Category | Interaction Types | Drug Claim Name | Drug Name | PMIDs |
| Page: 1 |

Copyright 2023-Present -The University of Texas Health Science Center at Houston |