
|
|||||
|
 | |
| |
| |
| |
| |
| |
|
Gene: ZNF384 |
Gene summary for ZNF384 |
| Gene information | Species | Human | Gene symbol | ZNF384 | Gene ID | 171017 |
| Gene name | zinc finger protein 384 | |
| Gene Alias | CAGH1 | |
| Cytomap | 12p13.31 | |
| Gene Type | protein-coding | GO ID | GO:0006139 | UniProtAcc | Q8TF68 |
Top |
Malignant transformation analysis |
| Identification of the aberrant gene expression in precancerous and cancerous lesions by comparing the gene expression of stem-like cells in diseased tissues with normal stem cells |
| Entrez ID | Symbol | Replicates | Species | Organ | Tissue | Adj P-value | Log2FC | Malignancy |
| 171017 | ZNF384 | LZE8T | Human | Esophagus | ESCC | 1.43e-05 | 1.58e-01 | 0.067 |
| 171017 | ZNF384 | LZE24T | Human | Esophagus | ESCC | 1.92e-10 | 1.54e-01 | 0.0596 |
| 171017 | ZNF384 | P1T-E | Human | Esophagus | ESCC | 6.43e-08 | 2.13e-01 | 0.0875 |
| 171017 | ZNF384 | P2T-E | Human | Esophagus | ESCC | 1.44e-13 | 1.70e-01 | 0.1177 |
| 171017 | ZNF384 | P4T-E | Human | Esophagus | ESCC | 7.08e-07 | 1.38e-01 | 0.1323 |
| 171017 | ZNF384 | P5T-E | Human | Esophagus | ESCC | 5.16e-04 | 7.51e-02 | 0.1327 |
| 171017 | ZNF384 | P8T-E | Human | Esophagus | ESCC | 1.67e-18 | 3.80e-01 | 0.0889 |
| 171017 | ZNF384 | P9T-E | Human | Esophagus | ESCC | 8.71e-15 | 1.69e-01 | 0.1131 |
| 171017 | ZNF384 | P10T-E | Human | Esophagus | ESCC | 2.39e-15 | 2.06e-01 | 0.116 |
| 171017 | ZNF384 | P11T-E | Human | Esophagus | ESCC | 5.42e-06 | 1.43e-01 | 0.1426 |
| 171017 | ZNF384 | P12T-E | Human | Esophagus | ESCC | 4.08e-09 | 2.67e-01 | 0.1122 |
| 171017 | ZNF384 | P15T-E | Human | Esophagus | ESCC | 5.84e-09 | 1.44e-01 | 0.1149 |
| 171017 | ZNF384 | P16T-E | Human | Esophagus | ESCC | 1.60e-42 | 7.38e-01 | 0.1153 |
| 171017 | ZNF384 | P17T-E | Human | Esophagus | ESCC | 6.38e-05 | 2.50e-01 | 0.1278 |
| 171017 | ZNF384 | P20T-E | Human | Esophagus | ESCC | 2.41e-13 | 2.15e-01 | 0.1124 |
| 171017 | ZNF384 | P21T-E | Human | Esophagus | ESCC | 1.59e-14 | 1.42e-01 | 0.1617 |
| 171017 | ZNF384 | P22T-E | Human | Esophagus | ESCC | 4.99e-18 | 2.86e-01 | 0.1236 |
| 171017 | ZNF384 | P23T-E | Human | Esophagus | ESCC | 2.27e-09 | 1.64e-01 | 0.108 |
| 171017 | ZNF384 | P24T-E | Human | Esophagus | ESCC | 7.43e-14 | 1.37e-01 | 0.1287 |
| 171017 | ZNF384 | P26T-E | Human | Esophagus | ESCC | 2.34e-13 | 2.09e-01 | 0.1276 |
| Page: 1 2 3 4 |
| Tissue | Expression Dynamics | Abbreviation |
| Esophagus | 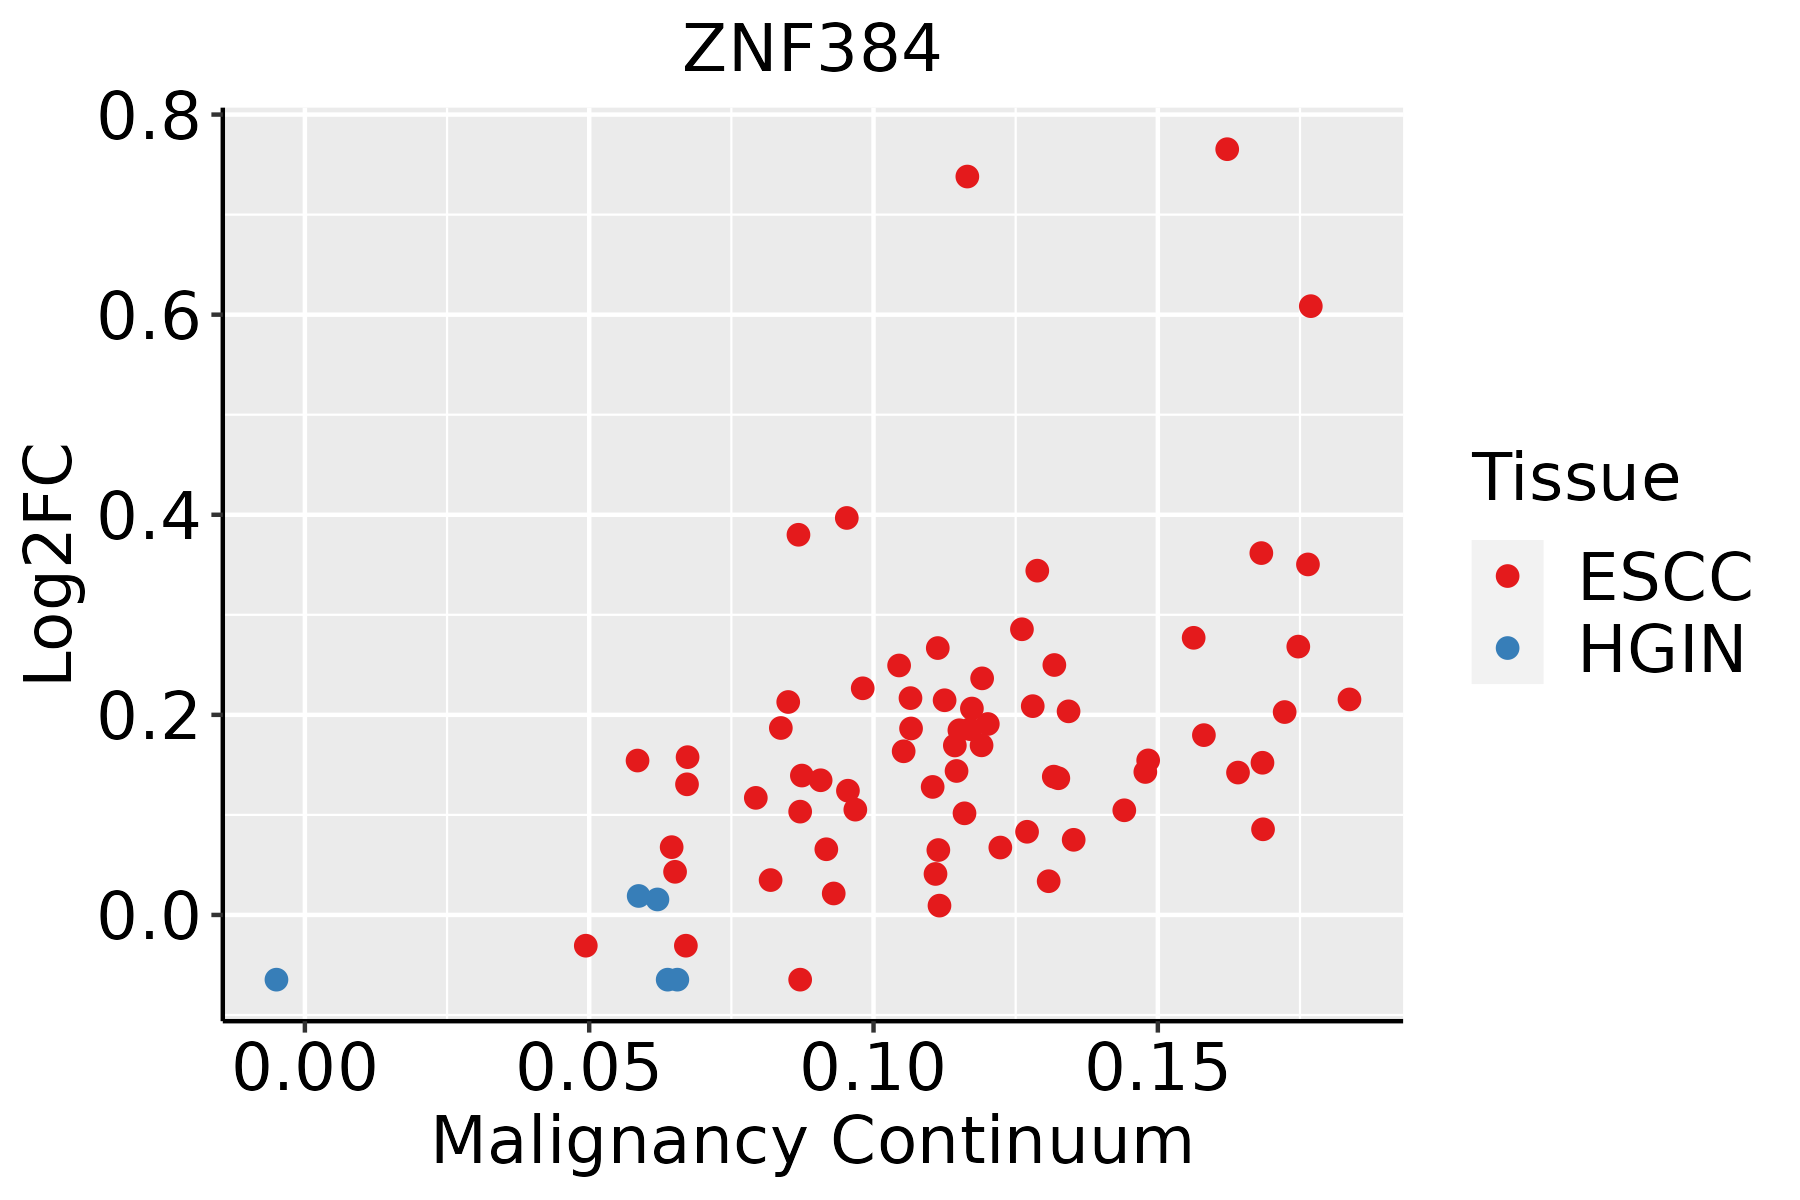 | ESCC: Esophageal squamous cell carcinoma |
| HGIN: High-grade intraepithelial neoplasias | ||
| LGIN: Low-grade intraepithelial neoplasias | ||
| Liver | 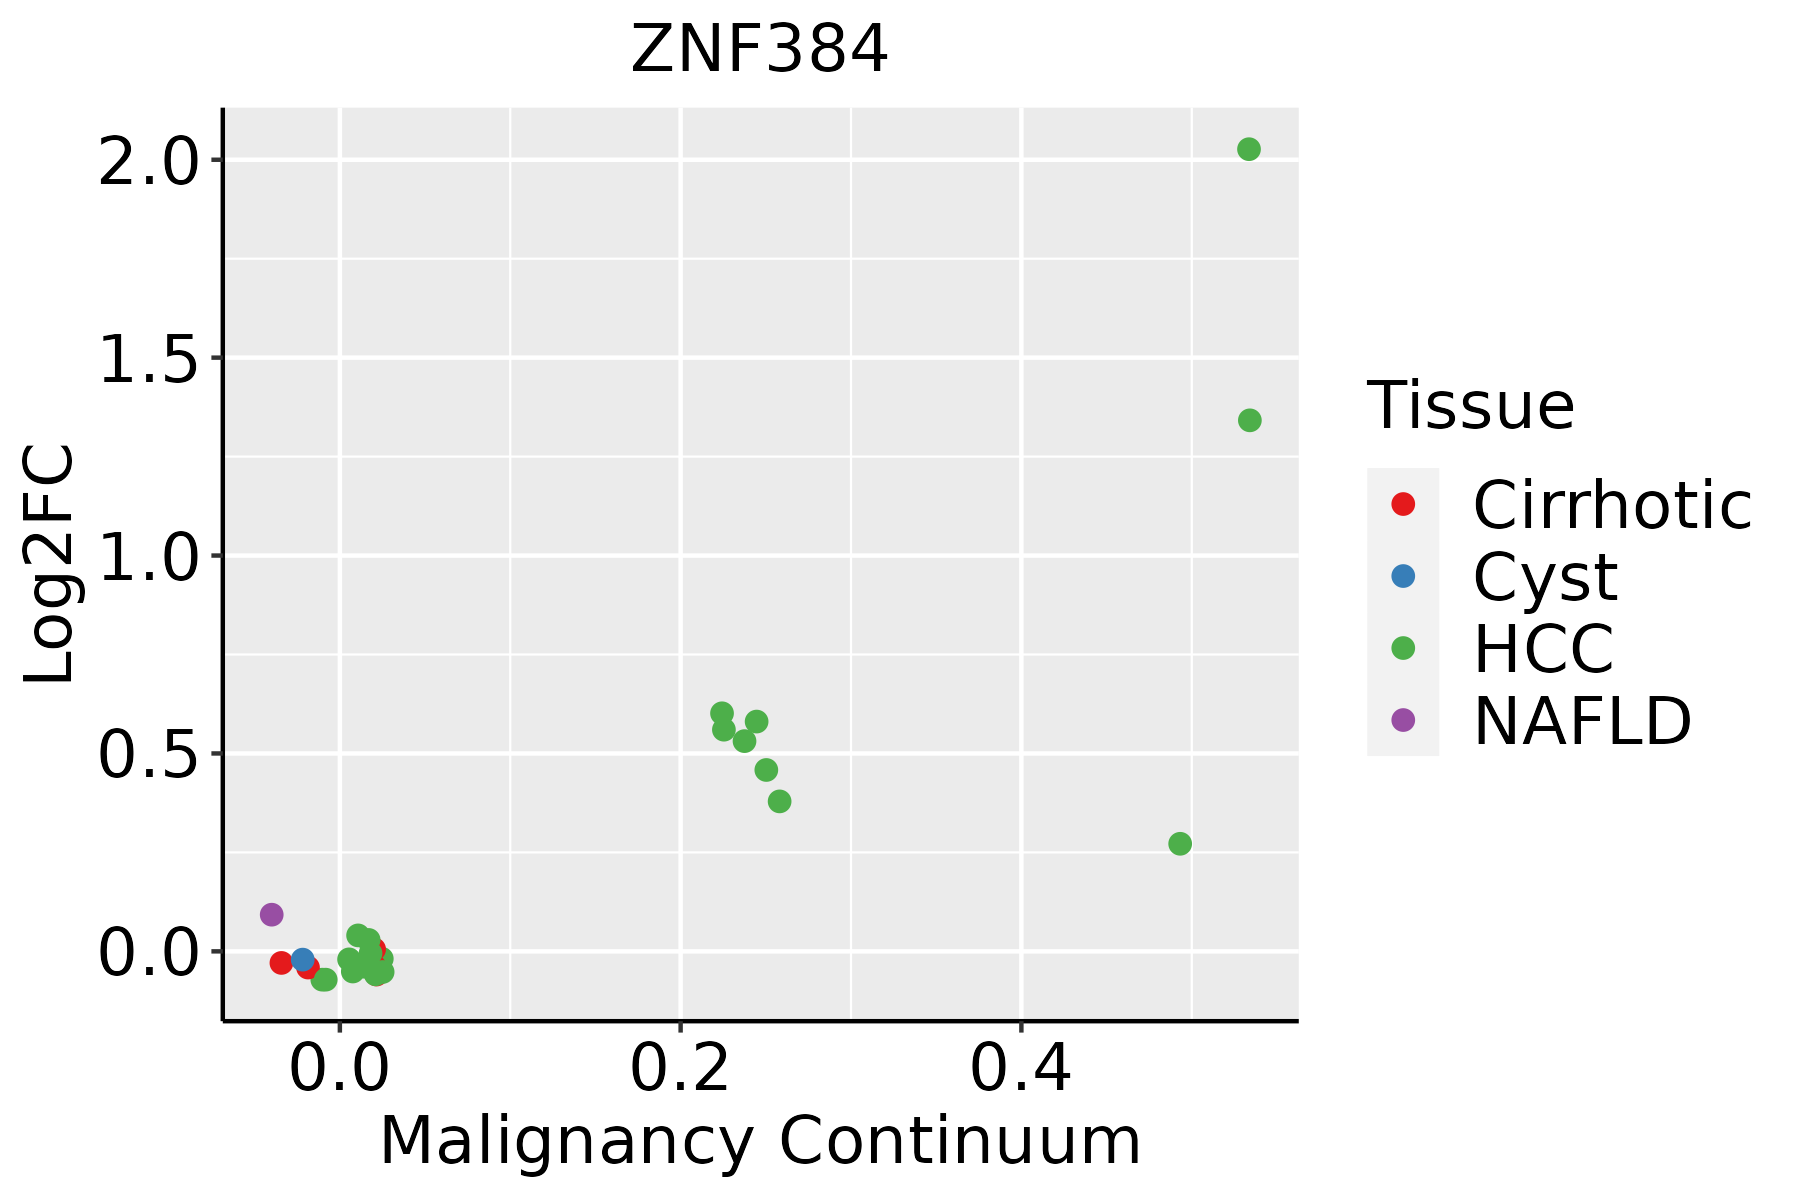 | HCC: Hepatocellular carcinoma |
| NAFLD: Non-alcoholic fatty liver disease | ||
| Oral Cavity |  | EOLP: Erosive Oral lichen planus |
| LP: leukoplakia | ||
| NEOLP: Non-erosive oral lichen planus | ||
| OSCC: Oral squamous cell carcinoma |
| ∗log2FC in expression of this searched gene in stem-like cells from each diseased tissue sample relative to stem-like cells in normal samples in each tissue plotted against the malignancy continuum. Samples are colored based on if they are from different disease stage. |
Top |
Malignant transformation related pathway analysis |
| Find out the enriched GO biological processes and KEGG pathways involved in transition from healthy to precancer to cancer |
| Tissue | Disease Stage | Enriched GO biological Processes |
| Colorectum | AD |  |
| Colorectum | SER |  |
| Colorectum | MSS |  |
| Colorectum | MSI-H |  |
| Colorectum | FAP |  |
| ∗Top 15 enriched GO BP terms are showed in the bar plot of each disease state in each tissue. Each row represents a significant GO biological process which is colored according to the -log10(p.adjust). |
| Page: 1 2 3 4 5 6 7 8 9 |
| GO ID | Tissue | Disease Stage | Description | Gene Ratio | Bg Ratio | pvalue | p.adjust | Count |
| Page: 1 |
| Pathway ID | Tissue | Disease Stage | Description | Gene Ratio | Bg Ratio | pvalue | p.adjust | qvalue | Count |
| Page: 1 |
Top |
Cell-cell communication analysis |
| Identification of potential cell-cell interactions between two cell types and their ligand-receptor pairs for different disease states |
| Ligand | Receptor | LRpair | Pathway | Tissue | Disease Stage |
| Page: 1 |
Top |
Single-cell gene regulatory network inference analysis |
| Find out the significant the regulons (TFs) and the target genes of each regulon across cell types for different disease states |
| TF | Cell Type | Tissue | Disease Stage | Target Gene | RSS | Regulon Activity |
| ZNF384 | BAS | Breast | DCIS | FDCSP,SENP1,REEP1, etc. | 1.15e-01 |  |
| ZNF384 | CHO | Liver | Healthy | PDE3A,AC068051.1,LCN12, etc. | 3.37e-01 |  |
| ZNF384 | GRA | Oral cavity | ADJ | GPR160,PLA2G4F,CEACAM6, etc. | 3.18e-01 |  |
| ZNF384 | ERY | Pancreas | Healthy | ASIP,CAB39L,NRGN, etc. | -2.22e-16 |  |
| ZNF384 | APCAF | Pancreas | Healthy | ASIP,CAB39L,NRGN, etc. | -2.22e-16 | |
| ZNF384 | CAF | Pancreas | PanIN | ASIP,CAB39L,NRGN, etc. | -2.22e-16 |  |
| ZNF384 | MEGA | Pancreas | PDAC | ASIP,CAB39L,NRGN, etc. | 0.00e+00 |  |
| ZNF384 | LYMEND | Pancreas | PDAC | ASIP,CAB39L,NRGN, etc. | 1.29e-04 | |
| ∗The dot plots of a searched regulon are shown for all cell subpopulations in each disease state of each tissue based on the regulon specific score inferred using pySCENIC and by calculating the average expression. |
| Page: 1 |
Top |
Somatic mutation of malignant transformation related genes |
| Annotation of somatic variants for genes involved in malignant transformation |
| Hugo Symbol | Variant Class | Variant Classification | dbSNP RS | HGVSc | HGVSp | HGVSp Short | SWISSPROT | BIOTYPE | SIFT | PolyPhen | Tumor Sample Barcode | Tissue | Histology | Sex | Age | Stage | Therapy Types | Drugs | Outcome |
| ZNF384 | SNV | Missense_Mutation | novel | c.1327A>G | p.Thr443Ala | p.T443A | Q8TF68 | protein_coding | deleterious(0.02) | probably_damaging(0.996) | TCGA-B6-A0WY-01 | Breast | breast invasive carcinoma | Female | <65 | III/IV | Unknown | Unknown | PD |
| ZNF384 | insertion | Nonsense_Mutation | novel | c.401_402insCCTACAGTTGTA | p.Ala134_Ser135insLeuGlnLeuTer | p.A134_S135insLQL* | Q8TF68 | protein_coding | TCGA-A2-A0EQ-01 | Breast | breast invasive carcinoma | Female | <65 | I/II | Chemotherapy | adriamycin | SD | ||
| ZNF384 | insertion | Frame_Shift_Ins | novel | c.399_400insTCCGTATACACTCAGGGGCTAA | p.Ala134SerfsTer37 | p.A134Sfs*37 | Q8TF68 | protein_coding | TCGA-A2-A0EQ-01 | Breast | breast invasive carcinoma | Female | <65 | I/II | Chemotherapy | adriamycin | SD | ||
| ZNF384 | SNV | Missense_Mutation | c.1271N>T | p.Thr424Met | p.T424M | Q8TF68 | protein_coding | deleterious(0) | probably_damaging(1) | TCGA-2W-A8YY-01 | Cervix | cervical & endocervical cancer | Female | <65 | I/II | Chemotherapy | cisplatin | CR | |
| ZNF384 | SNV | Missense_Mutation | novel | c.1570N>G | p.Pro524Ala | p.P524A | Q8TF68 | protein_coding | tolerated(0.09) | benign(0.003) | TCGA-VS-A9V3-01 | Cervix | cervical & endocervical cancer | Female | <65 | I/II | Chemotherapy | cisplatin | PD |
| ZNF384 | SNV | Missense_Mutation | c.1096N>G | p.Ile366Val | p.I366V | Q8TF68 | protein_coding | deleterious(0.05) | probably_damaging(0.986) | TCGA-AA-3811-01 | Colorectum | colon adenocarcinoma | Female | >=65 | III/IV | Unknown | Unknown | PD | |
| ZNF384 | SNV | Missense_Mutation | novel | c.1412C>T | p.Ala471Val | p.A471V | Q8TF68 | protein_coding | tolerated(0.07) | benign(0.012) | TCGA-AD-6889-01 | Colorectum | colon adenocarcinoma | Male | >=65 | I/II | Chemotherapy | xeloda | PD |
| ZNF384 | SNV | Missense_Mutation | novel | c.763N>A | p.Pro255Thr | p.P255T | Q8TF68 | protein_coding | deleterious(0) | probably_damaging(0.974) | TCGA-AZ-4315-01 | Colorectum | colon adenocarcinoma | Male | <65 | I/II | Unknown | Unknown | SD |
| ZNF384 | SNV | Missense_Mutation | c.245N>T | p.Ala82Val | p.A82V | Q8TF68 | protein_coding | tolerated(0.08) | possibly_damaging(0.829) | TCGA-CK-4950-01 | Colorectum | colon adenocarcinoma | Female | >=65 | III/IV | Chemotherapy | folfox | SD | |
| ZNF384 | SNV | Missense_Mutation | c.245N>T | p.Ala82Val | p.A82V | Q8TF68 | protein_coding | tolerated(0.08) | possibly_damaging(0.829) | TCGA-D5-6540-01 | Colorectum | colon adenocarcinoma | Male | >=65 | I/II | Unknown | Unknown | SD |
| Page: 1 2 3 4 5 |
Top |
Related drugs of malignant transformation related genes |
| Identification of chemicals and drugs interact with genes involved in malignant transfromation |
| (DGIdb 4.0) |
| Entrez ID | Symbol | Category | Interaction Types | Drug Claim Name | Drug Name | PMIDs |
| Page: 1 |

Copyright 2023-Present -The University of Texas Health Science Center at Houston |