
|
|||||
|
 | |
| |
| |
| |
| |
| |
|
Gene: ZNF37A |
Gene summary for ZNF37A |
| Gene information | Species | Human | Gene symbol | ZNF37A | Gene ID | 7587 |
| Gene name | zinc finger protein 37A | |
| Gene Alias | KOX21 | |
| Cytomap | 10p11.1 | |
| Gene Type | protein-coding | GO ID | GO:0006139 | UniProtAcc | P17032 |
Top |
Malignant transformation analysis |
| Identification of the aberrant gene expression in precancerous and cancerous lesions by comparing the gene expression of stem-like cells in diseased tissues with normal stem cells |
| Entrez ID | Symbol | Replicates | Species | Organ | Tissue | Adj P-value | Log2FC | Malignancy |
| 7587 | ZNF37A | LZE4T | Human | Esophagus | ESCC | 2.11e-09 | 2.69e-01 | 0.0811 |
| 7587 | ZNF37A | LZE24T | Human | Esophagus | ESCC | 6.48e-11 | 3.16e-01 | 0.0596 |
| 7587 | ZNF37A | P1T-E | Human | Esophagus | ESCC | 5.84e-04 | 1.84e-01 | 0.0875 |
| 7587 | ZNF37A | P2T-E | Human | Esophagus | ESCC | 1.63e-26 | 4.81e-01 | 0.1177 |
| 7587 | ZNF37A | P4T-E | Human | Esophagus | ESCC | 5.98e-10 | 1.96e-01 | 0.1323 |
| 7587 | ZNF37A | P5T-E | Human | Esophagus | ESCC | 2.19e-16 | 2.31e-01 | 0.1327 |
| 7587 | ZNF37A | P8T-E | Human | Esophagus | ESCC | 6.21e-15 | 2.61e-01 | 0.0889 |
| 7587 | ZNF37A | P9T-E | Human | Esophagus | ESCC | 4.13e-06 | 2.02e-01 | 0.1131 |
| 7587 | ZNF37A | P10T-E | Human | Esophagus | ESCC | 2.03e-26 | 3.53e-01 | 0.116 |
| 7587 | ZNF37A | P11T-E | Human | Esophagus | ESCC | 2.33e-12 | 3.10e-01 | 0.1426 |
| 7587 | ZNF37A | P12T-E | Human | Esophagus | ESCC | 4.99e-29 | 5.19e-01 | 0.1122 |
| 7587 | ZNF37A | P15T-E | Human | Esophagus | ESCC | 8.44e-10 | 1.64e-01 | 0.1149 |
| 7587 | ZNF37A | P16T-E | Human | Esophagus | ESCC | 7.07e-30 | 5.75e-01 | 0.1153 |
| 7587 | ZNF37A | P20T-E | Human | Esophagus | ESCC | 1.14e-11 | 1.94e-01 | 0.1124 |
| 7587 | ZNF37A | P21T-E | Human | Esophagus | ESCC | 8.42e-17 | 3.56e-01 | 0.1617 |
| 7587 | ZNF37A | P22T-E | Human | Esophagus | ESCC | 3.25e-14 | 2.67e-01 | 0.1236 |
| 7587 | ZNF37A | P23T-E | Human | Esophagus | ESCC | 2.40e-06 | 2.17e-01 | 0.108 |
| 7587 | ZNF37A | P24T-E | Human | Esophagus | ESCC | 4.20e-03 | 1.24e-01 | 0.1287 |
| 7587 | ZNF37A | P26T-E | Human | Esophagus | ESCC | 3.74e-18 | 3.25e-01 | 0.1276 |
| 7587 | ZNF37A | P27T-E | Human | Esophagus | ESCC | 3.62e-18 | 3.23e-01 | 0.1055 |
| Page: 1 2 3 4 5 |
| Tissue | Expression Dynamics | Abbreviation |
| Esophagus |  | ESCC: Esophageal squamous cell carcinoma |
| HGIN: High-grade intraepithelial neoplasias | ||
| LGIN: Low-grade intraepithelial neoplasias | ||
| Liver | 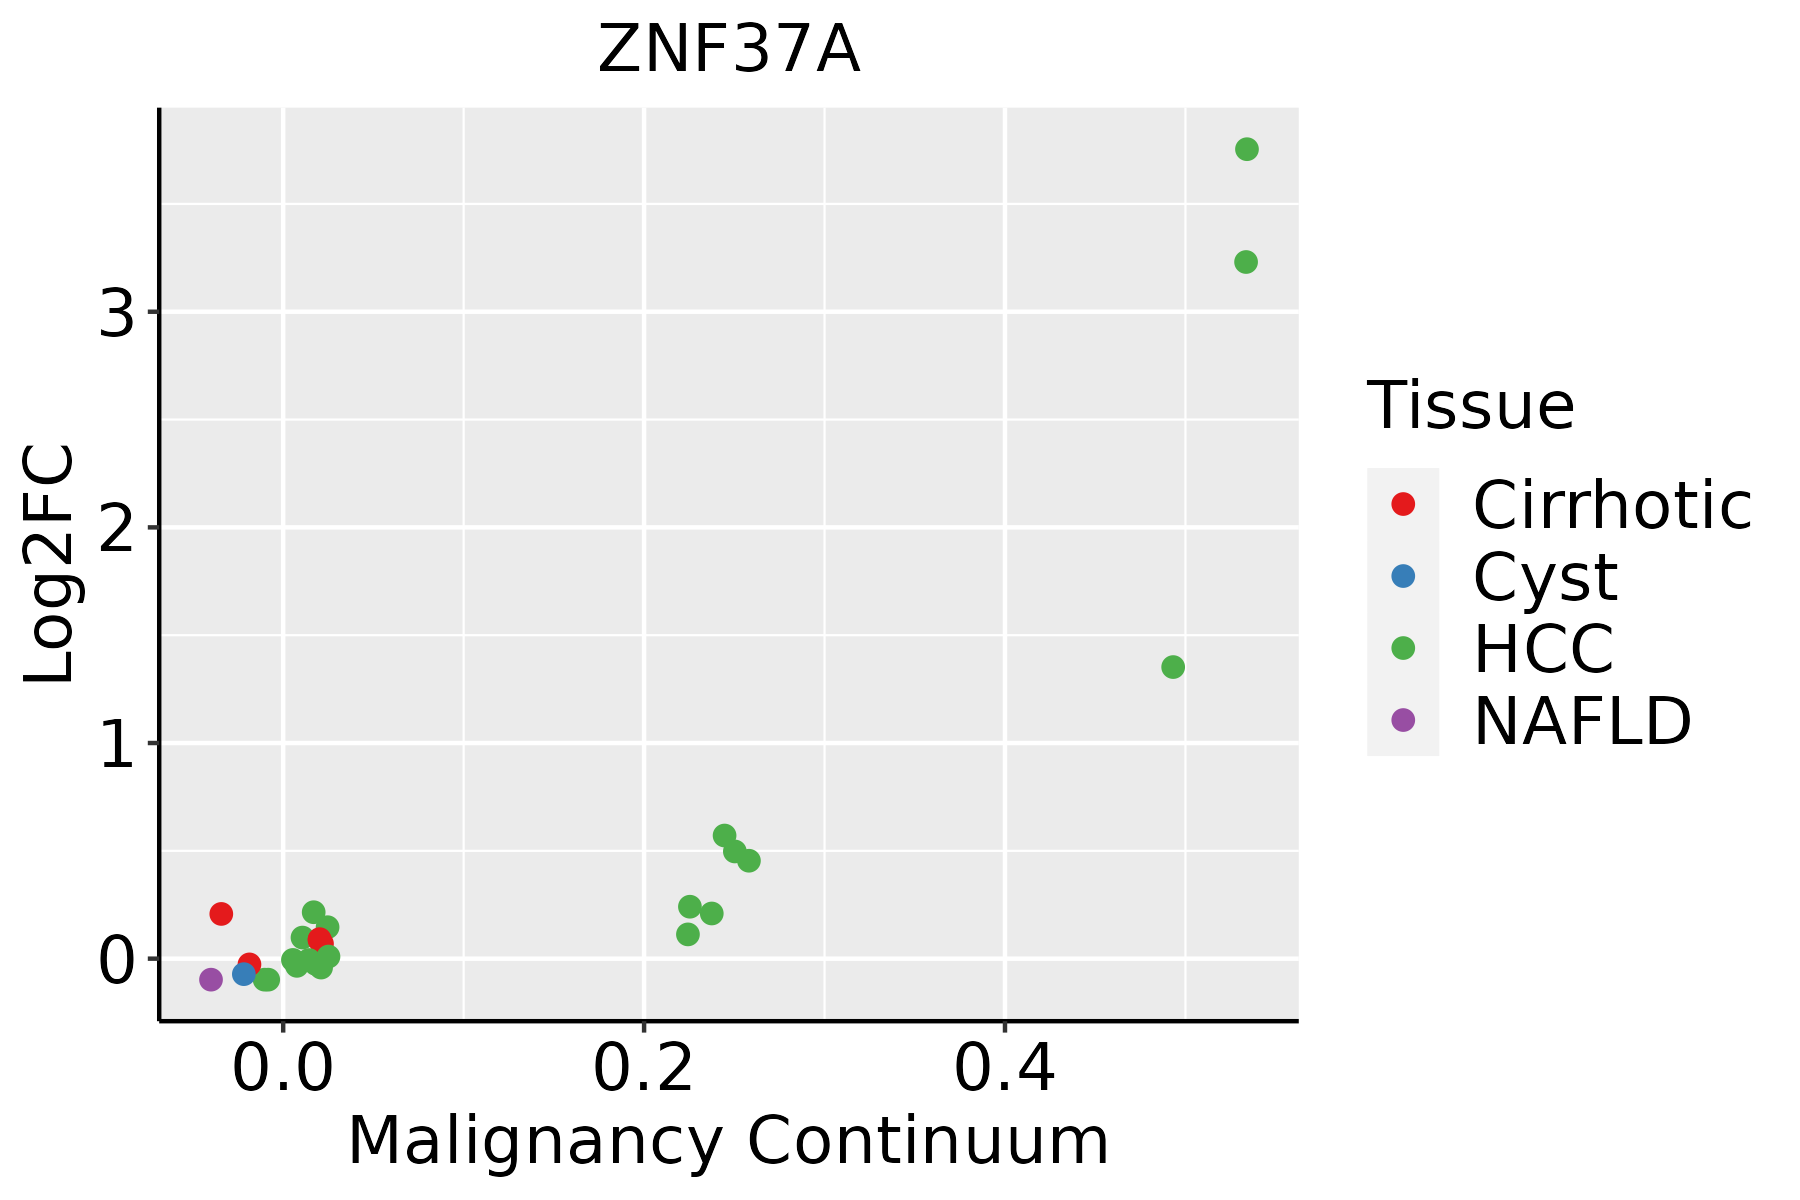 | HCC: Hepatocellular carcinoma |
| NAFLD: Non-alcoholic fatty liver disease | ||
| Prostate | 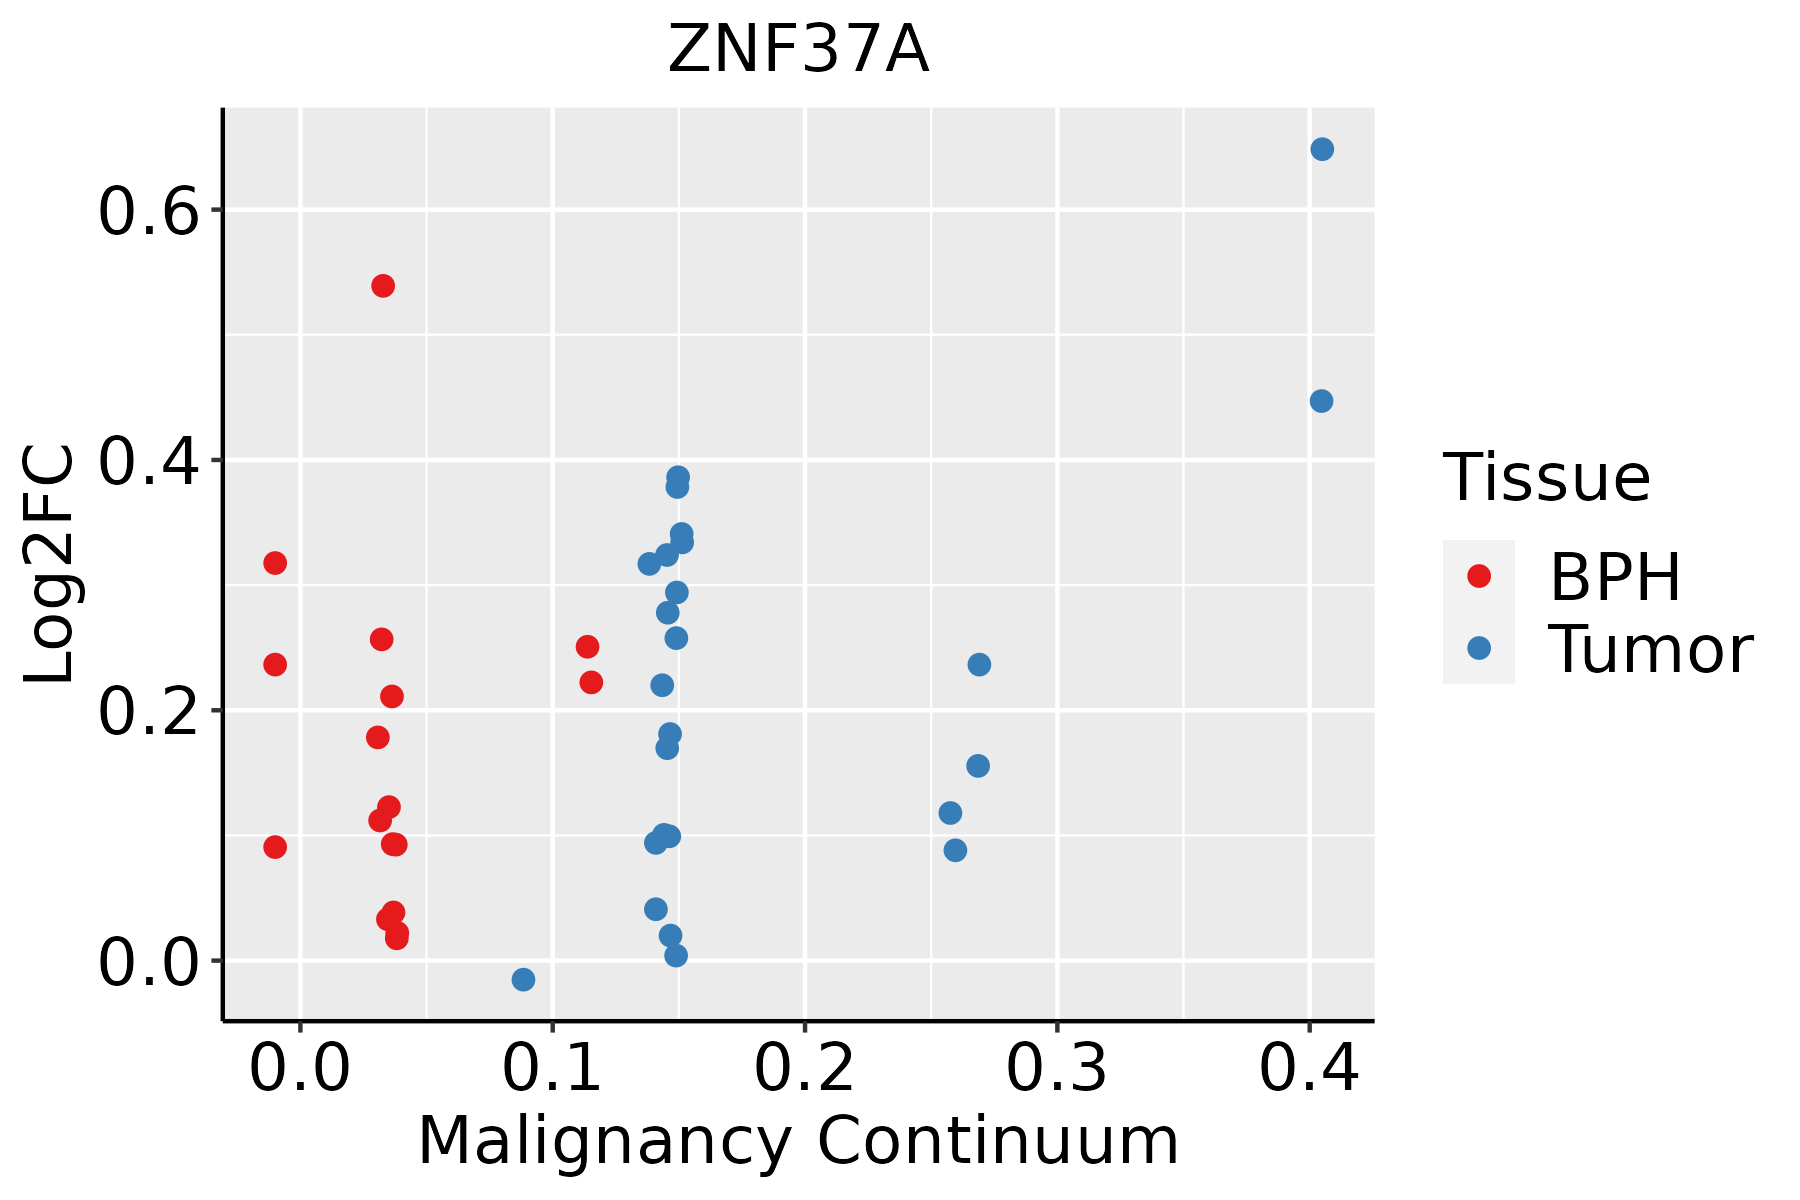 | BPH: Benign Prostatic Hyperplasia |
| Thyroid | 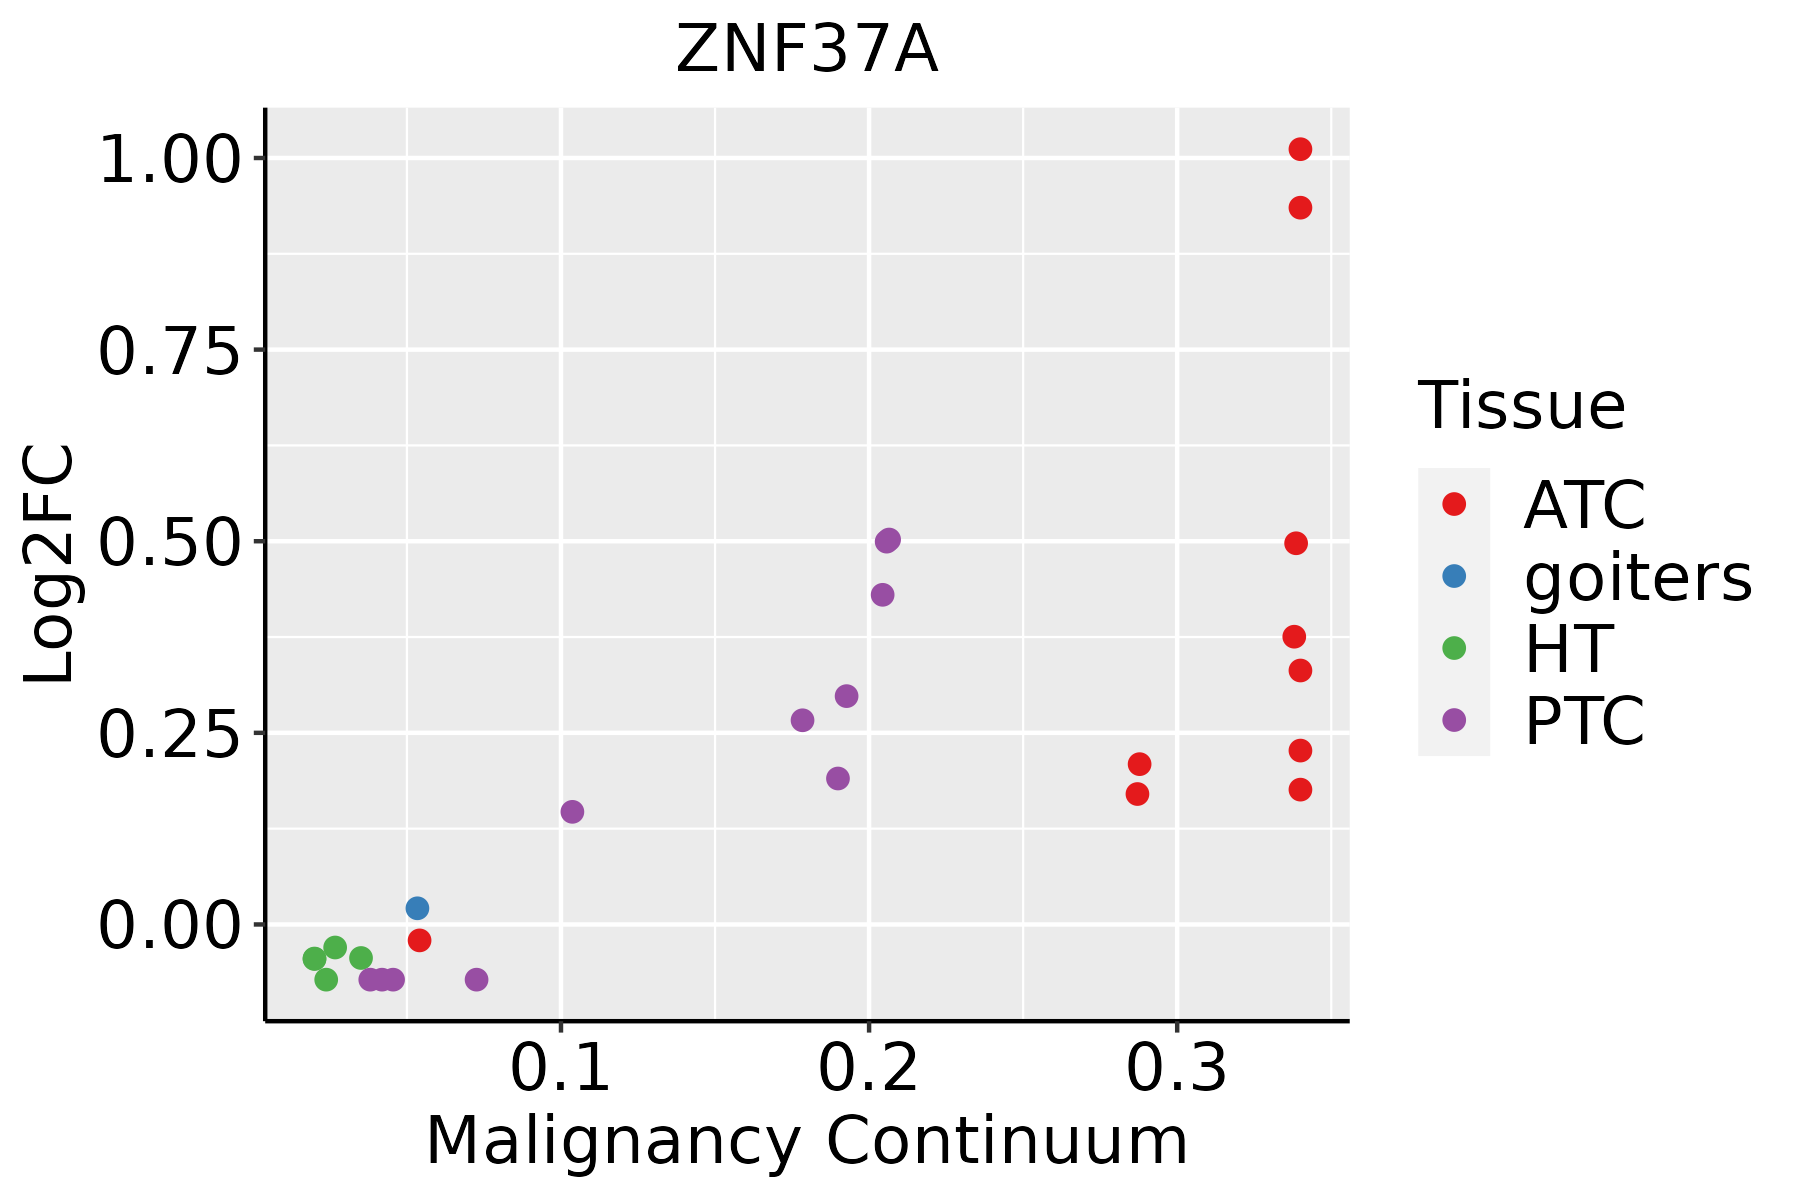 | ATC: Anaplastic thyroid cancer |
| HT: Hashimoto's thyroiditis | ||
| PTC: Papillary thyroid cancer |
| ∗log2FC in expression of this searched gene in stem-like cells from each diseased tissue sample relative to stem-like cells in normal samples in each tissue plotted against the malignancy continuum. Samples are colored based on if they are from different disease stage. |
Top |
Malignant transformation related pathway analysis |
| Find out the enriched GO biological processes and KEGG pathways involved in transition from healthy to precancer to cancer |
| Tissue | Disease Stage | Enriched GO biological Processes |
| Colorectum | AD |  |
| Colorectum | SER |  |
| Colorectum | MSS |  |
| Colorectum | MSI-H |  |
| Colorectum | FAP |  |
| ∗Top 15 enriched GO BP terms are showed in the bar plot of each disease state in each tissue. Each row represents a significant GO biological process which is colored according to the -log10(p.adjust). |
| Page: 1 2 3 4 5 6 7 8 9 |
| GO ID | Tissue | Disease Stage | Description | Gene Ratio | Bg Ratio | pvalue | p.adjust | Count |
| Page: 1 |
| Pathway ID | Tissue | Disease Stage | Description | Gene Ratio | Bg Ratio | pvalue | p.adjust | qvalue | Count |
| Page: 1 |
Top |
Cell-cell communication analysis |
| Identification of potential cell-cell interactions between two cell types and their ligand-receptor pairs for different disease states |
| Ligand | Receptor | LRpair | Pathway | Tissue | Disease Stage |
| Page: 1 |
Top |
Single-cell gene regulatory network inference analysis |
| Find out the significant the regulons (TFs) and the target genes of each regulon across cell types for different disease states |
| TF | Cell Type | Tissue | Disease Stage | Target Gene | RSS | Regulon Activity |
| ZNF37A | STM | Liver | Healthy | BABAM1,KDM4A,ATHL1, etc. | 6.41e-01 |  |
| ZNF37A | CD8TEFF | Oral cavity | ADJ | PHACTR4,PLB1,CRIM1, etc. | 1.39e-02 |  |
| ZNF37A | pDC | Oral cavity | ADJ | PHACTR4,PLB1,CRIM1, etc. | 5.35e-02 | |
| ZNF37A | pDC | Oral cavity | Healthy | PHACTR4,PLB1,CRIM1, etc. | 3.08e-02 |  |
| ZNF37A | pDC | Oral cavity | LP | PHACTR4,PLB1,CRIM1, etc. | 1.14e-01 |  |
| ZNF37A | pDC | Oral cavity | OSCC | PHACTR4,PLB1,CRIM1, etc. | 1.83e-01 |  |
| ZNF37A | ECM | Thyroid | ATC | MTRNR2L12,PLCG2,MTRNR2L8, etc. | 1.79e-01 |  |
| ∗The dot plots of a searched regulon are shown for all cell subpopulations in each disease state of each tissue based on the regulon specific score inferred using pySCENIC and by calculating the average expression. |
| Page: 1 |
Top |
Somatic mutation of malignant transformation related genes |
| Annotation of somatic variants for genes involved in malignant transformation |
| Hugo Symbol | Variant Class | Variant Classification | dbSNP RS | HGVSc | HGVSp | HGVSp Short | SWISSPROT | BIOTYPE | SIFT | PolyPhen | Tumor Sample Barcode | Tissue | Histology | Sex | Age | Stage | Therapy Types | Drugs | Outcome |
| ZNF37A | SNV | Missense_Mutation | c.956N>T | p.Arg319Ile | p.R319I | P17032 | protein_coding | deleterious(0) | benign(0.142) | TCGA-AN-A046-01 | Breast | breast invasive carcinoma | Female | >=65 | I/II | Unknown | Unknown | SD | |
| ZNF37A | SNV | Missense_Mutation | rs752891741 | c.1042N>G | p.Thr348Ala | p.T348A | P17032 | protein_coding | tolerated(0.07) | benign(0.055) | TCGA-DS-A7WF-01 | Cervix | cervical & endocervical cancer | Female | <65 | I/II | Chemotherapy | cisplatin | PD |
| ZNF37A | SNV | Missense_Mutation | rs371302765 | c.1430G>A | p.Arg477His | p.R477H | P17032 | protein_coding | tolerated(0.52) | benign(0.009) | TCGA-EK-A2RN-01 | Cervix | cervical & endocervical cancer | Female | <65 | I/II | Unknown | Unknown | SD |
| ZNF37A | SNV | Missense_Mutation | c.125N>A | p.Ser42Asn | p.S42N | P17032 | protein_coding | tolerated(0.22) | benign(0.298) | TCGA-AA-3811-01 | Colorectum | colon adenocarcinoma | Female | >=65 | III/IV | Unknown | Unknown | PD | |
| ZNF37A | SNV | Missense_Mutation | novel | c.1259N>C | p.Phe420Ser | p.F420S | P17032 | protein_coding | deleterious(0) | probably_damaging(0.988) | TCGA-AA-3842-01 | Colorectum | colon adenocarcinoma | Male | <65 | III/IV | Chemotherapy | folinic | PD |
| ZNF37A | SNV | Missense_Mutation | c.257N>T | p.Arg86Ile | p.R86I | P17032 | protein_coding | tolerated(0.2) | benign(0.041) | TCGA-AA-A00N-01 | Colorectum | colon adenocarcinoma | Male | >=65 | I/II | Unknown | Unknown | PD | |
| ZNF37A | SNV | Missense_Mutation | c.805N>C | p.Lys269Gln | p.K269Q | P17032 | protein_coding | deleterious(0) | benign(0.045) | TCGA-AA-A00N-01 | Colorectum | colon adenocarcinoma | Male | >=65 | I/II | Unknown | Unknown | PD | |
| ZNF37A | SNV | Missense_Mutation | c.1654N>C | p.Asn552His | p.N552H | P17032 | protein_coding | tolerated(0.16) | benign(0) | TCGA-AA-A010-01 | Colorectum | colon adenocarcinoma | Female | <65 | I/II | Chemotherapy | folinic | CR | |
| ZNF37A | SNV | Missense_Mutation | rs747587314 | c.553N>T | p.Met185Leu | p.M185L | P17032 | protein_coding | tolerated(0.44) | benign(0) | TCGA-AA-A02R-01 | Colorectum | colon adenocarcinoma | Female | >=65 | I/II | Unknown | Unknown | PD |
| ZNF37A | SNV | Missense_Mutation | c.956G>T | p.Arg319Ile | p.R319I | P17032 | protein_coding | deleterious(0) | benign(0.142) | TCGA-AZ-4315-01 | Colorectum | colon adenocarcinoma | Male | <65 | I/II | Unknown | Unknown | SD |
| Page: 1 2 3 4 5 6 7 8 9 |
Top |
Related drugs of malignant transformation related genes |
| Identification of chemicals and drugs interact with genes involved in malignant transfromation |
| (DGIdb 4.0) |
| Entrez ID | Symbol | Category | Interaction Types | Drug Claim Name | Drug Name | PMIDs |
| Page: 1 |

Copyright 2023-Present -The University of Texas Health Science Center at Houston |