
|
|||||
|
 | |
| |
| |
| |
| |
| |
|
Gene: ZNF358 |
Gene summary for ZNF358 |
| Gene information | Species | Human | Gene symbol | ZNF358 | Gene ID | 140467 |
| Gene name | zinc finger protein 358 | |
| Gene Alias | ZFEND | |
| Cytomap | 19p13.2 | |
| Gene Type | protein-coding | GO ID | GO:0006139 | UniProtAcc | Q9NW07 |
Top |
Malignant transformation analysis |
| Identification of the aberrant gene expression in precancerous and cancerous lesions by comparing the gene expression of stem-like cells in diseased tissues with normal stem cells |
| Entrez ID | Symbol | Replicates | Species | Organ | Tissue | Adj P-value | Log2FC | Malignancy |
| 140467 | ZNF358 | HCC1_Meng | Human | Liver | HCC | 4.24e-57 | 8.10e-02 | 0.0246 |
| 140467 | ZNF358 | HCC2_Meng | Human | Liver | HCC | 6.05e-20 | 1.31e-01 | 0.0107 |
| 140467 | ZNF358 | cirrhotic2 | Human | Liver | Cirrhotic | 1.97e-02 | 9.78e-02 | 0.0201 |
| 140467 | ZNF358 | HCC1 | Human | Liver | HCC | 1.50e-14 | 3.87e+00 | 0.5336 |
| 140467 | ZNF358 | HCC2 | Human | Liver | HCC | 7.18e-09 | 2.57e+00 | 0.5341 |
| 140467 | ZNF358 | S015 | Human | Liver | HCC | 1.65e-04 | 3.47e-01 | 0.2375 |
| 140467 | ZNF358 | S016 | Human | Liver | HCC | 5.81e-06 | 2.70e-01 | 0.2243 |
| 140467 | ZNF358 | S027 | Human | Liver | HCC | 2.62e-05 | 5.76e-01 | 0.2446 |
| 140467 | ZNF358 | S028 | Human | Liver | HCC | 9.37e-10 | 4.77e-01 | 0.2503 |
| 140467 | ZNF358 | S029 | Human | Liver | HCC | 1.12e-04 | 3.26e-01 | 0.2581 |
| 140467 | ZNF358 | C21 | Human | Oral cavity | OSCC | 8.25e-14 | 4.39e-01 | 0.2678 |
| 140467 | ZNF358 | C30 | Human | Oral cavity | OSCC | 3.19e-09 | 5.65e-01 | 0.3055 |
| 140467 | ZNF358 | C38 | Human | Oral cavity | OSCC | 4.03e-06 | 6.71e-01 | 0.172 |
| 140467 | ZNF358 | C43 | Human | Oral cavity | OSCC | 4.91e-11 | 1.74e-01 | 0.1704 |
| 140467 | ZNF358 | C08 | Human | Oral cavity | OSCC | 3.89e-34 | 7.12e-01 | 0.1919 |
| 140467 | ZNF358 | C09 | Human | Oral cavity | OSCC | 5.46e-05 | 3.05e-01 | 0.1431 |
| 140467 | ZNF358 | SYSMH1 | Human | Oral cavity | OSCC | 4.90e-06 | 2.59e-01 | 0.1127 |
| 140467 | ZNF358 | SYSMH2 | Human | Oral cavity | OSCC | 4.17e-03 | 1.71e-01 | 0.2326 |
| 140467 | ZNF358 | SYSMH3 | Human | Oral cavity | OSCC | 3.98e-03 | 1.10e-01 | 0.2442 |
| 140467 | ZNF358 | SYSMH6 | Human | Oral cavity | OSCC | 2.15e-06 | 2.81e-01 | 0.1275 |
| Page: 1 2 |
| Tissue | Expression Dynamics | Abbreviation |
| Liver | 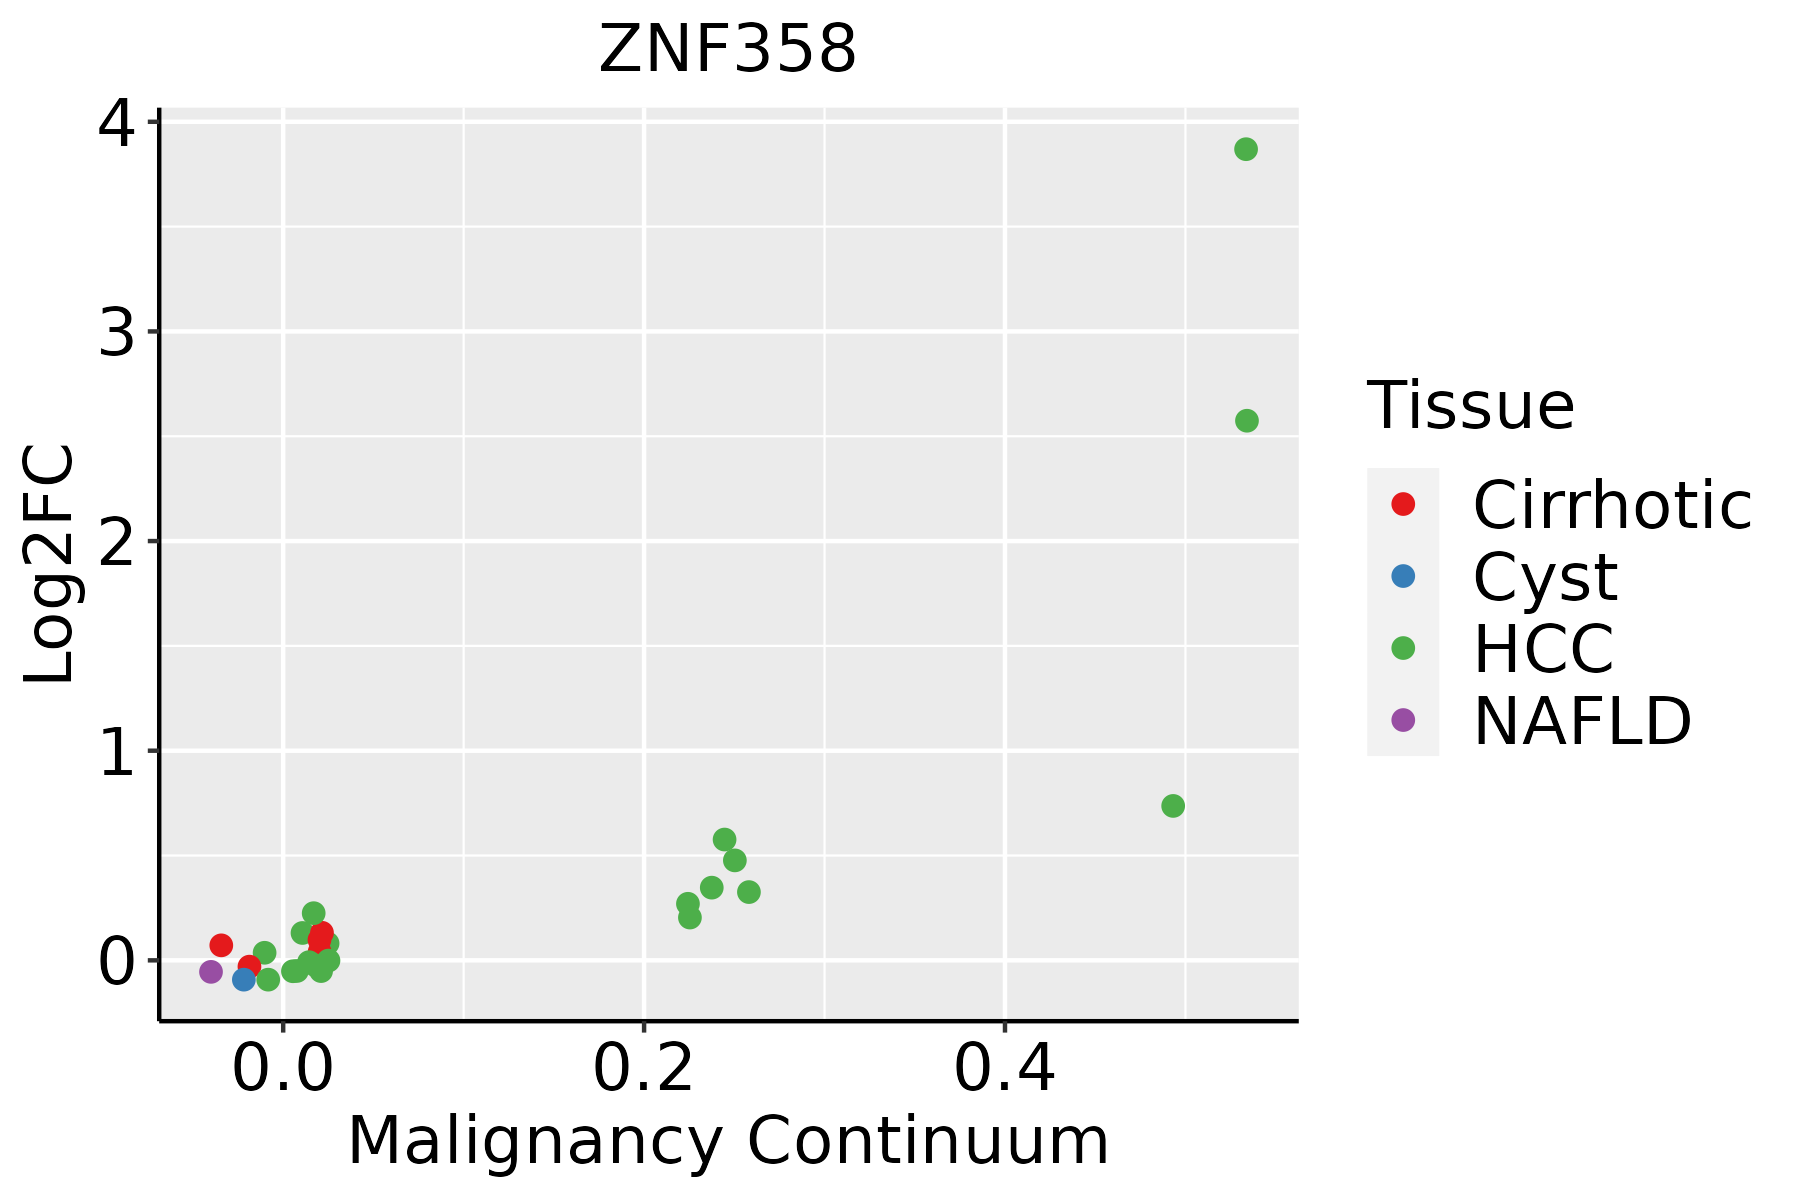 | HCC: Hepatocellular carcinoma |
| NAFLD: Non-alcoholic fatty liver disease | ||
| Oral Cavity | 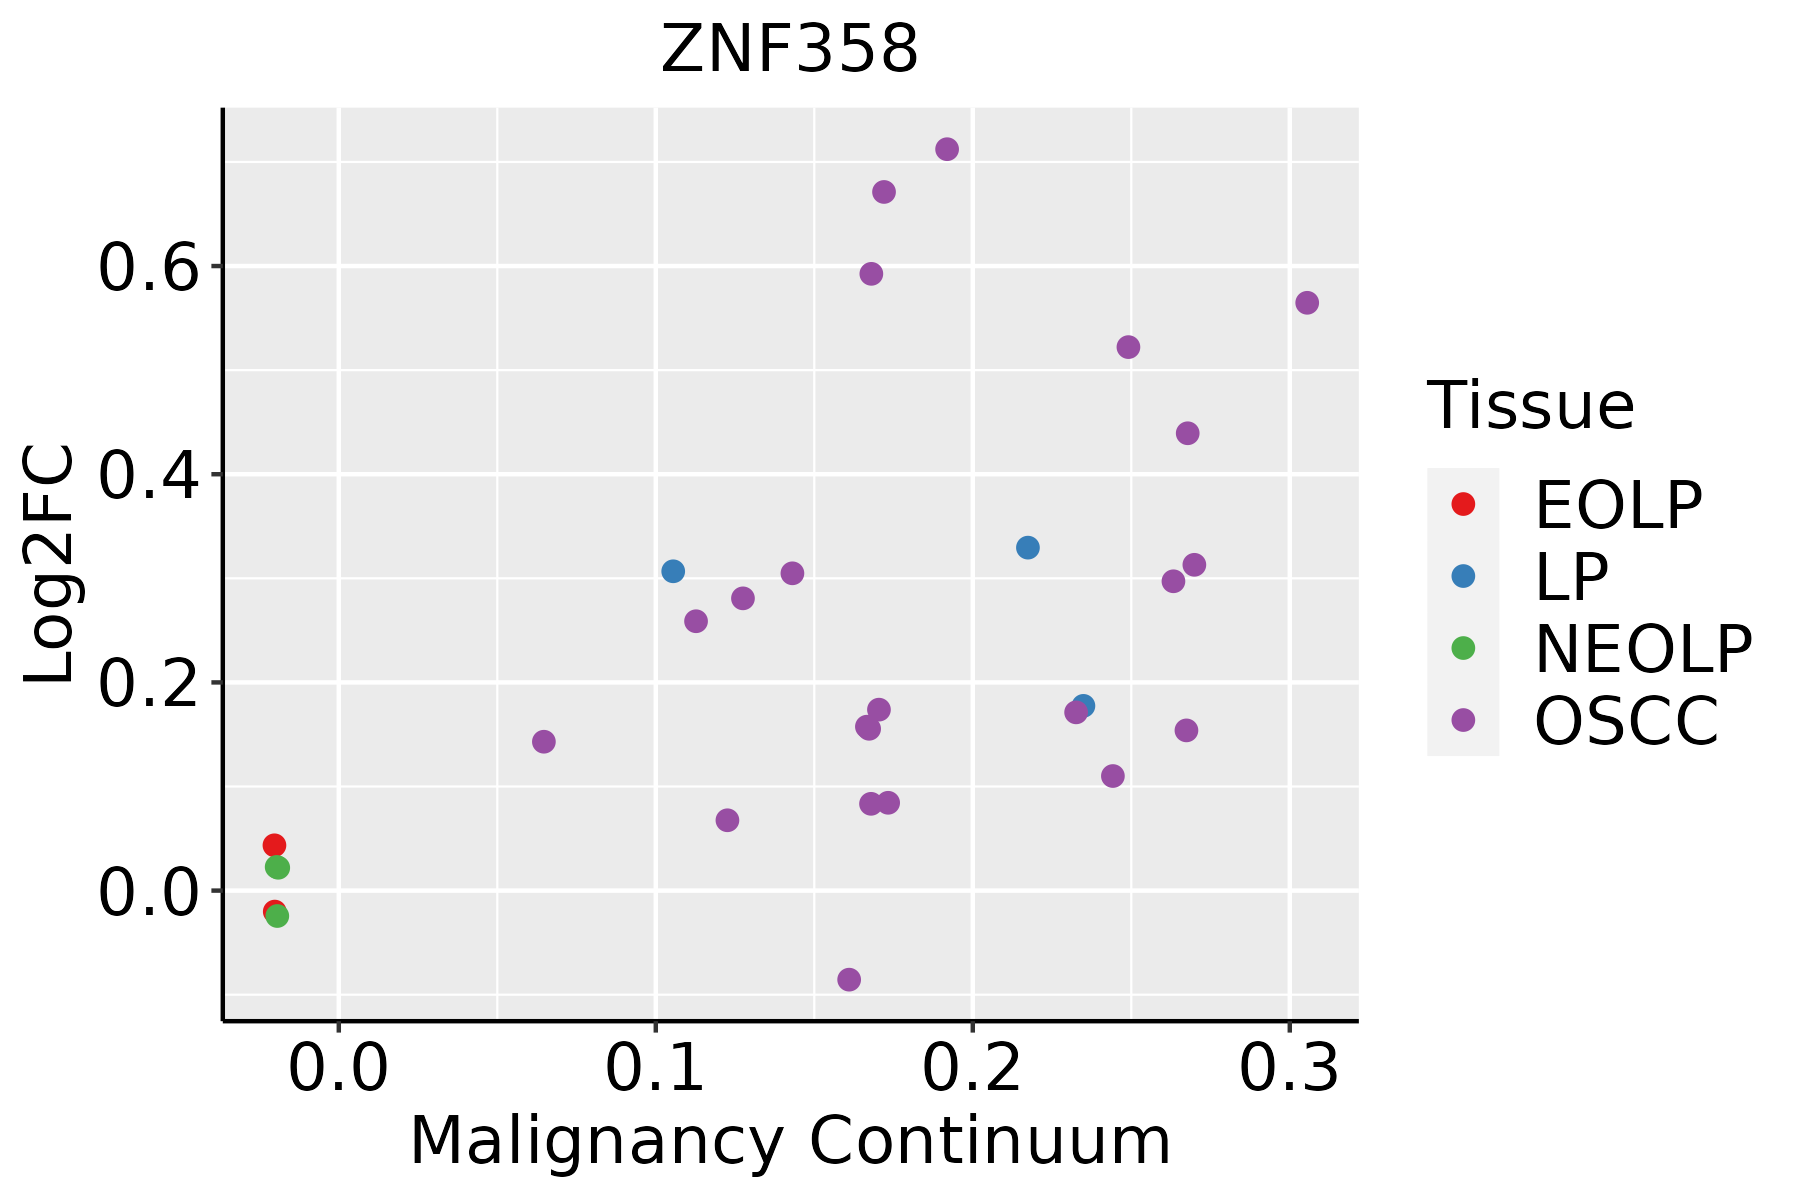 | EOLP: Erosive Oral lichen planus |
| LP: leukoplakia | ||
| NEOLP: Non-erosive oral lichen planus | ||
| OSCC: Oral squamous cell carcinoma | ||
| Thyroid | 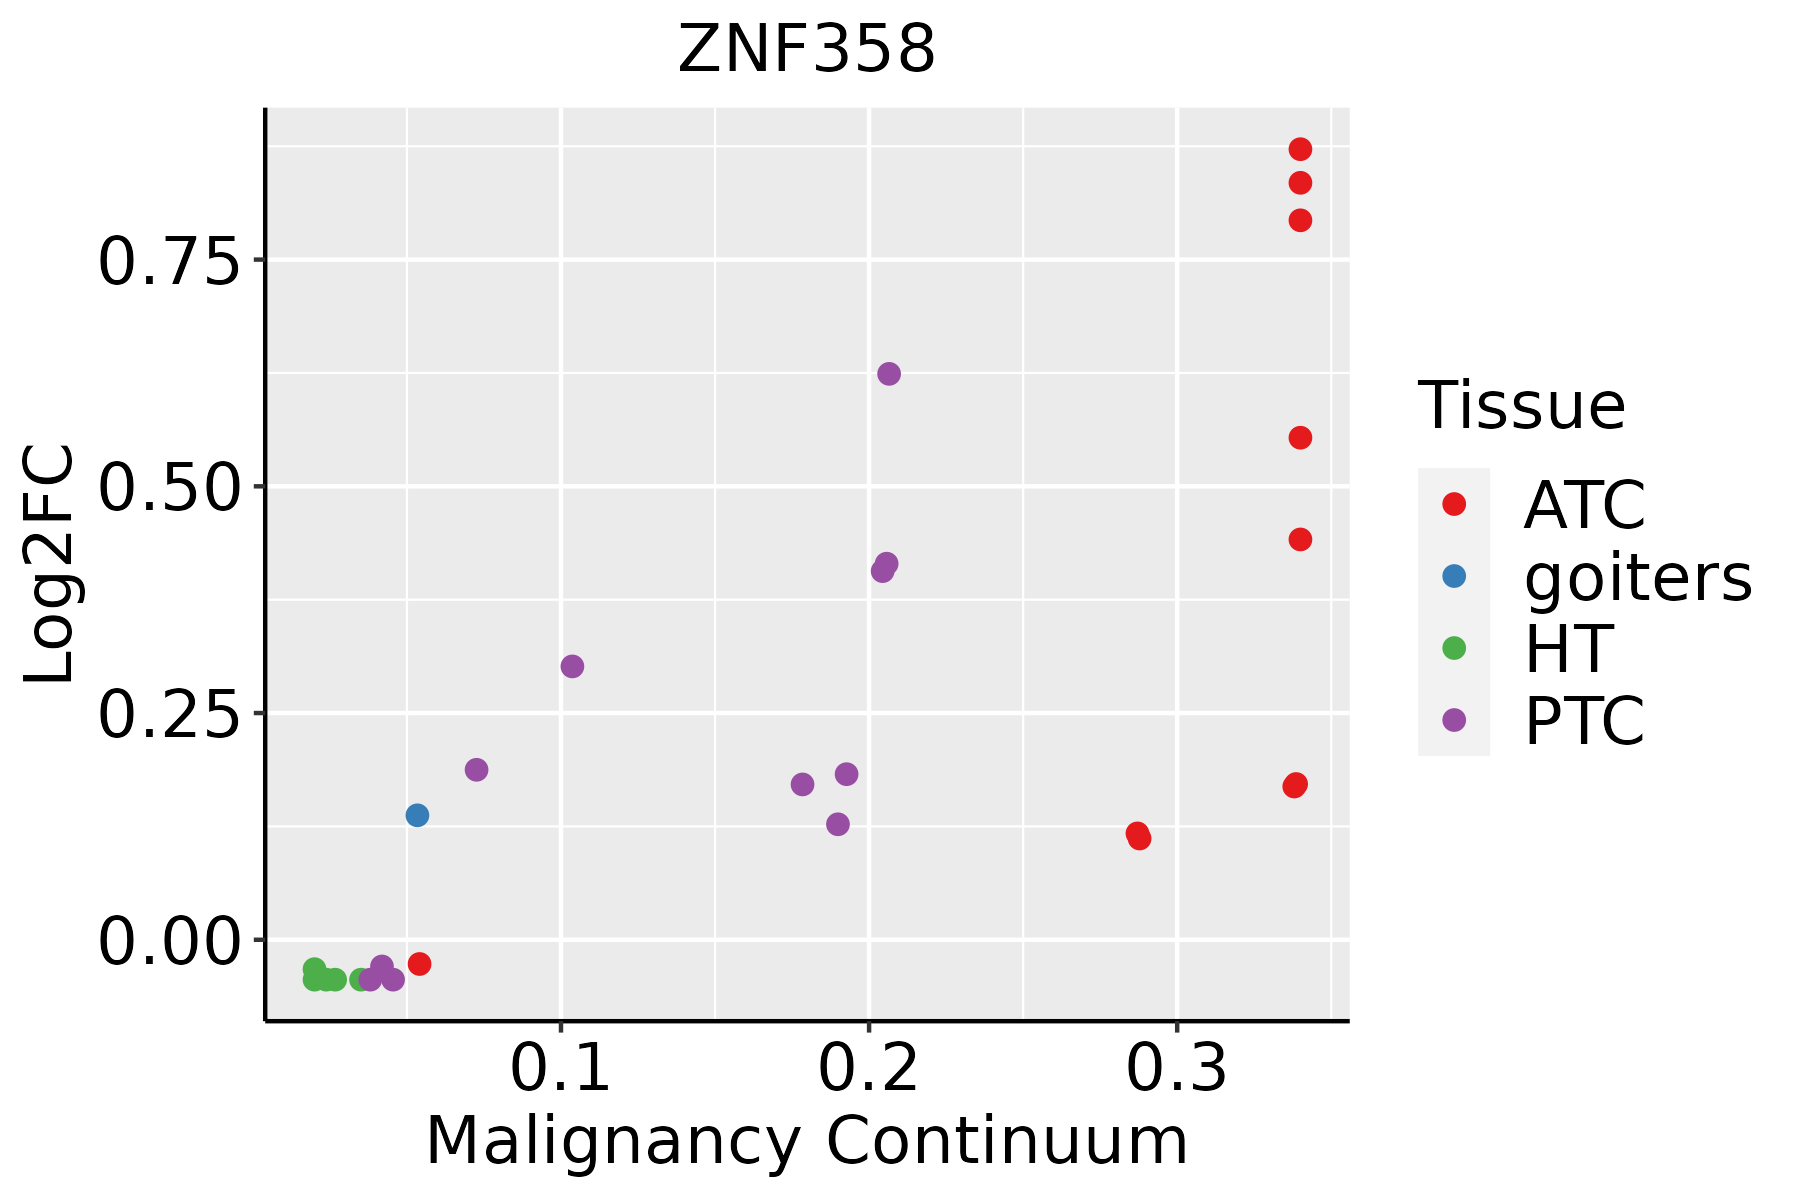 | ATC: Anaplastic thyroid cancer |
| HT: Hashimoto's thyroiditis | ||
| PTC: Papillary thyroid cancer |
| ∗log2FC in expression of this searched gene in stem-like cells from each diseased tissue sample relative to stem-like cells in normal samples in each tissue plotted against the malignancy continuum. Samples are colored based on if they are from different disease stage. |
Top |
Malignant transformation related pathway analysis |
| Find out the enriched GO biological processes and KEGG pathways involved in transition from healthy to precancer to cancer |
| Tissue | Disease Stage | Enriched GO biological Processes |
| Colorectum | AD |  |
| Colorectum | SER |  |
| Colorectum | MSS |  |
| Colorectum | MSI-H |  |
| Colorectum | FAP |  |
| ∗Top 15 enriched GO BP terms are showed in the bar plot of each disease state in each tissue. Each row represents a significant GO biological process which is colored according to the -log10(p.adjust). |
| Page: 1 2 3 4 5 6 7 8 9 |
| GO ID | Tissue | Disease Stage | Description | Gene Ratio | Bg Ratio | pvalue | p.adjust | Count |
| GO:001982711 | Liver | Cirrhotic | stem cell population maintenance | 48/4634 | 131/18723 | 1.58e-03 | 1.03e-02 | 48 |
| GO:009872711 | Liver | Cirrhotic | maintenance of cell number | 48/4634 | 134/18723 | 2.70e-03 | 1.58e-02 | 48 |
| GO:00987272 | Liver | HCC | maintenance of cell number | 77/7958 | 134/18723 | 3.32e-04 | 2.33e-03 | 77 |
| GO:00198272 | Liver | HCC | stem cell population maintenance | 75/7958 | 131/18723 | 4.58e-04 | 3.04e-03 | 75 |
| GO:00219154 | Liver | HCC | neural tube development | 82/7958 | 152/18723 | 2.83e-03 | 1.33e-02 | 82 |
| GO:00987277 | Oral cavity | OSCC | maintenance of cell number | 81/7305 | 134/18723 | 3.96e-07 | 5.90e-06 | 81 |
| GO:00198276 | Oral cavity | OSCC | stem cell population maintenance | 79/7305 | 131/18723 | 6.28e-07 | 8.96e-06 | 79 |
| GO:00219158 | Oral cavity | OSCC | neural tube development | 77/7305 | 152/18723 | 2.26e-03 | 1.00e-02 | 77 |
| GO:002191514 | Thyroid | PTC | neural tube development | 76/5968 | 152/18723 | 2.40e-06 | 3.17e-05 | 76 |
| GO:009872710 | Thyroid | PTC | maintenance of cell number | 63/5968 | 134/18723 | 1.73e-04 | 1.32e-03 | 63 |
| GO:00198279 | Thyroid | PTC | stem cell population maintenance | 61/5968 | 131/18723 | 3.01e-04 | 2.12e-03 | 61 |
| GO:002191515 | Thyroid | ATC | neural tube development | 80/6293 | 152/18723 | 9.87e-07 | 1.29e-05 | 80 |
| GO:009872722 | Thyroid | ATC | maintenance of cell number | 70/6293 | 134/18723 | 6.45e-06 | 6.69e-05 | 70 |
| GO:001982722 | Thyroid | ATC | stem cell population maintenance | 67/6293 | 131/18723 | 2.48e-05 | 2.16e-04 | 67 |
| GO:00351074 | Thyroid | ATC | appendage morphogenesis | 63/6293 | 138/18723 | 2.13e-03 | 1.00e-02 | 63 |
| GO:00351084 | Thyroid | ATC | limb morphogenesis | 63/6293 | 138/18723 | 2.13e-03 | 1.00e-02 | 63 |
| GO:00487368 | Thyroid | ATC | appendage development | 76/6293 | 172/18723 | 2.41e-03 | 1.12e-02 | 76 |
| GO:00601738 | Thyroid | ATC | limb development | 76/6293 | 172/18723 | 2.41e-03 | 1.12e-02 | 76 |
| GO:00303262 | Thyroid | ATC | embryonic limb morphogenesis | 52/6293 | 116/18723 | 7.67e-03 | 3.00e-02 | 52 |
| GO:00351132 | Thyroid | ATC | embryonic appendage morphogenesis | 52/6293 | 116/18723 | 7.67e-03 | 3.00e-02 | 52 |
| Page: 1 |
| Pathway ID | Tissue | Disease Stage | Description | Gene Ratio | Bg Ratio | pvalue | p.adjust | qvalue | Count |
| Page: 1 |
Top |
Cell-cell communication analysis |
| Identification of potential cell-cell interactions between two cell types and their ligand-receptor pairs for different disease states |
| Ligand | Receptor | LRpair | Pathway | Tissue | Disease Stage |
| Page: 1 |
Top |
Single-cell gene regulatory network inference analysis |
| Find out the significant the regulons (TFs) and the target genes of each regulon across cell types for different disease states |
| TF | Cell Type | Tissue | Disease Stage | Target Gene | RSS | Regulon Activity |
| ZNF358 | M1MAC | Endometrium | Healthy | STXBP5,TBC1D14,GSKIP, etc. | 5.21e-01 |  |
| ZNF358 | CD8TEXP | Liver | Cirrhotic | ZNF706,DUSP4,BSG, etc. | 1.26e-01 |  |
| ZNF358 | CD8TEXINT | Liver | HCC | ZNF706,DUSP4,BSG, etc. | 8.50e-02 |  |
| ZNF358 | CD4TN | Liver | HCC | ZNF706,DUSP4,BSG, etc. | 1.33e-01 | |
| ∗The dot plots of a searched regulon are shown for all cell subpopulations in each disease state of each tissue based on the regulon specific score inferred using pySCENIC and by calculating the average expression. |
| Page: 1 |
Top |
Somatic mutation of malignant transformation related genes |
| Annotation of somatic variants for genes involved in malignant transformation |
| Hugo Symbol | Variant Class | Variant Classification | dbSNP RS | HGVSc | HGVSp | HGVSp Short | SWISSPROT | BIOTYPE | SIFT | PolyPhen | Tumor Sample Barcode | Tissue | Histology | Sex | Age | Stage | Therapy Types | Drugs | Outcome |
| ZNF358 | SNV | Missense_Mutation | c.1054N>C | p.Cys352Arg | p.C352R | Q9NW07 | protein_coding | deleterious(0) | probably_damaging(1) | TCGA-AN-A0AK-01 | Breast | breast invasive carcinoma | Female | >=65 | I/II | Unknown | Unknown | SD | |
| ZNF358 | SNV | Missense_Mutation | rs149848212 | c.1411N>G | p.Leu471Val | p.L471V | Q9NW07 | protein_coding | deleterious_low_confidence(0.05) | benign(0) | TCGA-AR-A0TX-01 | Breast | breast invasive carcinoma | Female | <65 | I/II | Unknown | Unknown | SD |
| ZNF358 | SNV | Missense_Mutation | c.383N>T | p.Thr128Ile | p.T128I | Q9NW07 | protein_coding | tolerated(0.06) | benign(0.047) | TCGA-E2-A573-01 | Breast | breast invasive carcinoma | Female | <65 | I/II | Chemotherapy | taxotere | CR | |
| ZNF358 | SNV | Missense_Mutation | rs375827871 | c.220N>A | p.Asp74Asn | p.D74N | Q9NW07 | protein_coding | deleterious(0.05) | benign(0.034) | TCGA-EW-A1IY-01 | Breast | breast invasive carcinoma | Female | <65 | I/II | Chemotherapy | taxotere | SD |
| ZNF358 | SNV | Missense_Mutation | c.199N>A | p.Val67Ile | p.V67I | Q9NW07 | protein_coding | tolerated(0.21) | benign(0) | TCGA-2W-A8YY-01 | Cervix | cervical & endocervical cancer | Female | <65 | I/II | Chemotherapy | cisplatin | CR | |
| ZNF358 | SNV | Missense_Mutation | c.214N>T | p.Asp72Tyr | p.D72Y | Q9NW07 | protein_coding | deleterious(0.01) | possibly_damaging(0.617) | TCGA-EA-A1QT-01 | Cervix | cervical & endocervical cancer | Female | <65 | I/II | Unknown | Unknown | SD | |
| ZNF358 | SNV | Missense_Mutation | novel | c.283G>A | p.Asp95Asn | p.D95N | Q9NW07 | protein_coding | tolerated(0.14) | possibly_damaging(0.46) | TCGA-EA-A3HU-01 | Cervix | cervical & endocervical cancer | Female | <65 | I/II | Unknown | Unknown | SD |
| ZNF358 | SNV | Missense_Mutation | c.1553N>A | p.Pro518Gln | p.P518Q | Q9NW07 | protein_coding | deleterious_low_confidence(0.01) | benign(0.372) | TCGA-EK-A2PM-01 | Cervix | cervical & endocervical cancer | Female | >=65 | I/II | Unknown | Unknown | SD | |
| ZNF358 | SNV | Missense_Mutation | rs149848212 | c.1411C>G | p.Leu471Val | p.L471V | Q9NW07 | protein_coding | deleterious_low_confidence(0.05) | benign(0) | TCGA-MA-AA41-01 | Cervix | cervical & endocervical cancer | Female | <65 | I/II | Unknown | Unknown | SD |
| ZNF358 | SNV | Missense_Mutation | c.1186N>C | p.Val396Leu | p.V396L | Q9NW07 | protein_coding | deleterious(0.02) | benign(0.21) | TCGA-AA-3502-01 | Colorectum | colon adenocarcinoma | Male | >=65 | I/II | Unknown | Unknown | SD |
| Page: 1 2 3 4 5 6 7 |
Top |
Related drugs of malignant transformation related genes |
| Identification of chemicals and drugs interact with genes involved in malignant transfromation |
| (DGIdb 4.0) |
| Entrez ID | Symbol | Category | Interaction Types | Drug Claim Name | Drug Name | PMIDs |
| Page: 1 |

Copyright 2023-Present -The University of Texas Health Science Center at Houston |