
|
|||||
|
 | |
| |
| |
| |
| |
| |
|
Gene: ZNF354A |
Gene summary for ZNF354A |
| Gene information | Species | Human | Gene symbol | ZNF354A | Gene ID | 6940 |
| Gene name | zinc finger protein 354A | |
| Gene Alias | EZNF | |
| Cytomap | 5q35.3 | |
| Gene Type | protein-coding | GO ID | GO:0003008 | UniProtAcc | V9HWI2 |
Top |
Malignant transformation analysis |
| Identification of the aberrant gene expression in precancerous and cancerous lesions by comparing the gene expression of stem-like cells in diseased tissues with normal stem cells |
| Entrez ID | Symbol | Replicates | Species | Organ | Tissue | Adj P-value | Log2FC | Malignancy |
| 6940 | ZNF354A | LZE4T | Human | Esophagus | ESCC | 1.37e-02 | 1.63e-01 | 0.0811 |
| 6940 | ZNF354A | LZE24T | Human | Esophagus | ESCC | 3.13e-06 | 2.40e-01 | 0.0596 |
| 6940 | ZNF354A | P2T-E | Human | Esophagus | ESCC | 6.77e-19 | 3.61e-01 | 0.1177 |
| 6940 | ZNF354A | P4T-E | Human | Esophagus | ESCC | 1.54e-03 | 1.24e-01 | 0.1323 |
| 6940 | ZNF354A | P5T-E | Human | Esophagus | ESCC | 3.98e-12 | 2.72e-01 | 0.1327 |
| 6940 | ZNF354A | P8T-E | Human | Esophagus | ESCC | 3.59e-04 | 5.24e-02 | 0.0889 |
| 6940 | ZNF354A | P9T-E | Human | Esophagus | ESCC | 1.12e-03 | 8.19e-02 | 0.1131 |
| 6940 | ZNF354A | P10T-E | Human | Esophagus | ESCC | 3.94e-10 | 1.73e-01 | 0.116 |
| 6940 | ZNF354A | P11T-E | Human | Esophagus | ESCC | 4.51e-03 | 2.18e-01 | 0.1426 |
| 6940 | ZNF354A | P12T-E | Human | Esophagus | ESCC | 5.11e-19 | 3.88e-01 | 0.1122 |
| 6940 | ZNF354A | P15T-E | Human | Esophagus | ESCC | 5.51e-10 | 2.17e-01 | 0.1149 |
| 6940 | ZNF354A | P16T-E | Human | Esophagus | ESCC | 1.89e-13 | 2.31e-01 | 0.1153 |
| 6940 | ZNF354A | P19T-E | Human | Esophagus | ESCC | 9.27e-03 | 2.31e-01 | 0.1662 |
| 6940 | ZNF354A | P20T-E | Human | Esophagus | ESCC | 3.32e-06 | 1.95e-01 | 0.1124 |
| 6940 | ZNF354A | P21T-E | Human | Esophagus | ESCC | 1.79e-07 | 1.12e-01 | 0.1617 |
| 6940 | ZNF354A | P22T-E | Human | Esophagus | ESCC | 6.44e-16 | 2.49e-01 | 0.1236 |
| 6940 | ZNF354A | P23T-E | Human | Esophagus | ESCC | 2.24e-05 | 2.09e-01 | 0.108 |
| 6940 | ZNF354A | P24T-E | Human | Esophagus | ESCC | 4.69e-08 | 1.69e-01 | 0.1287 |
| 6940 | ZNF354A | P26T-E | Human | Esophagus | ESCC | 4.88e-11 | 1.40e-01 | 0.1276 |
| 6940 | ZNF354A | P27T-E | Human | Esophagus | ESCC | 1.50e-10 | 1.56e-01 | 0.1055 |
| Page: 1 2 3 |
| Tissue | Expression Dynamics | Abbreviation |
| Esophagus | 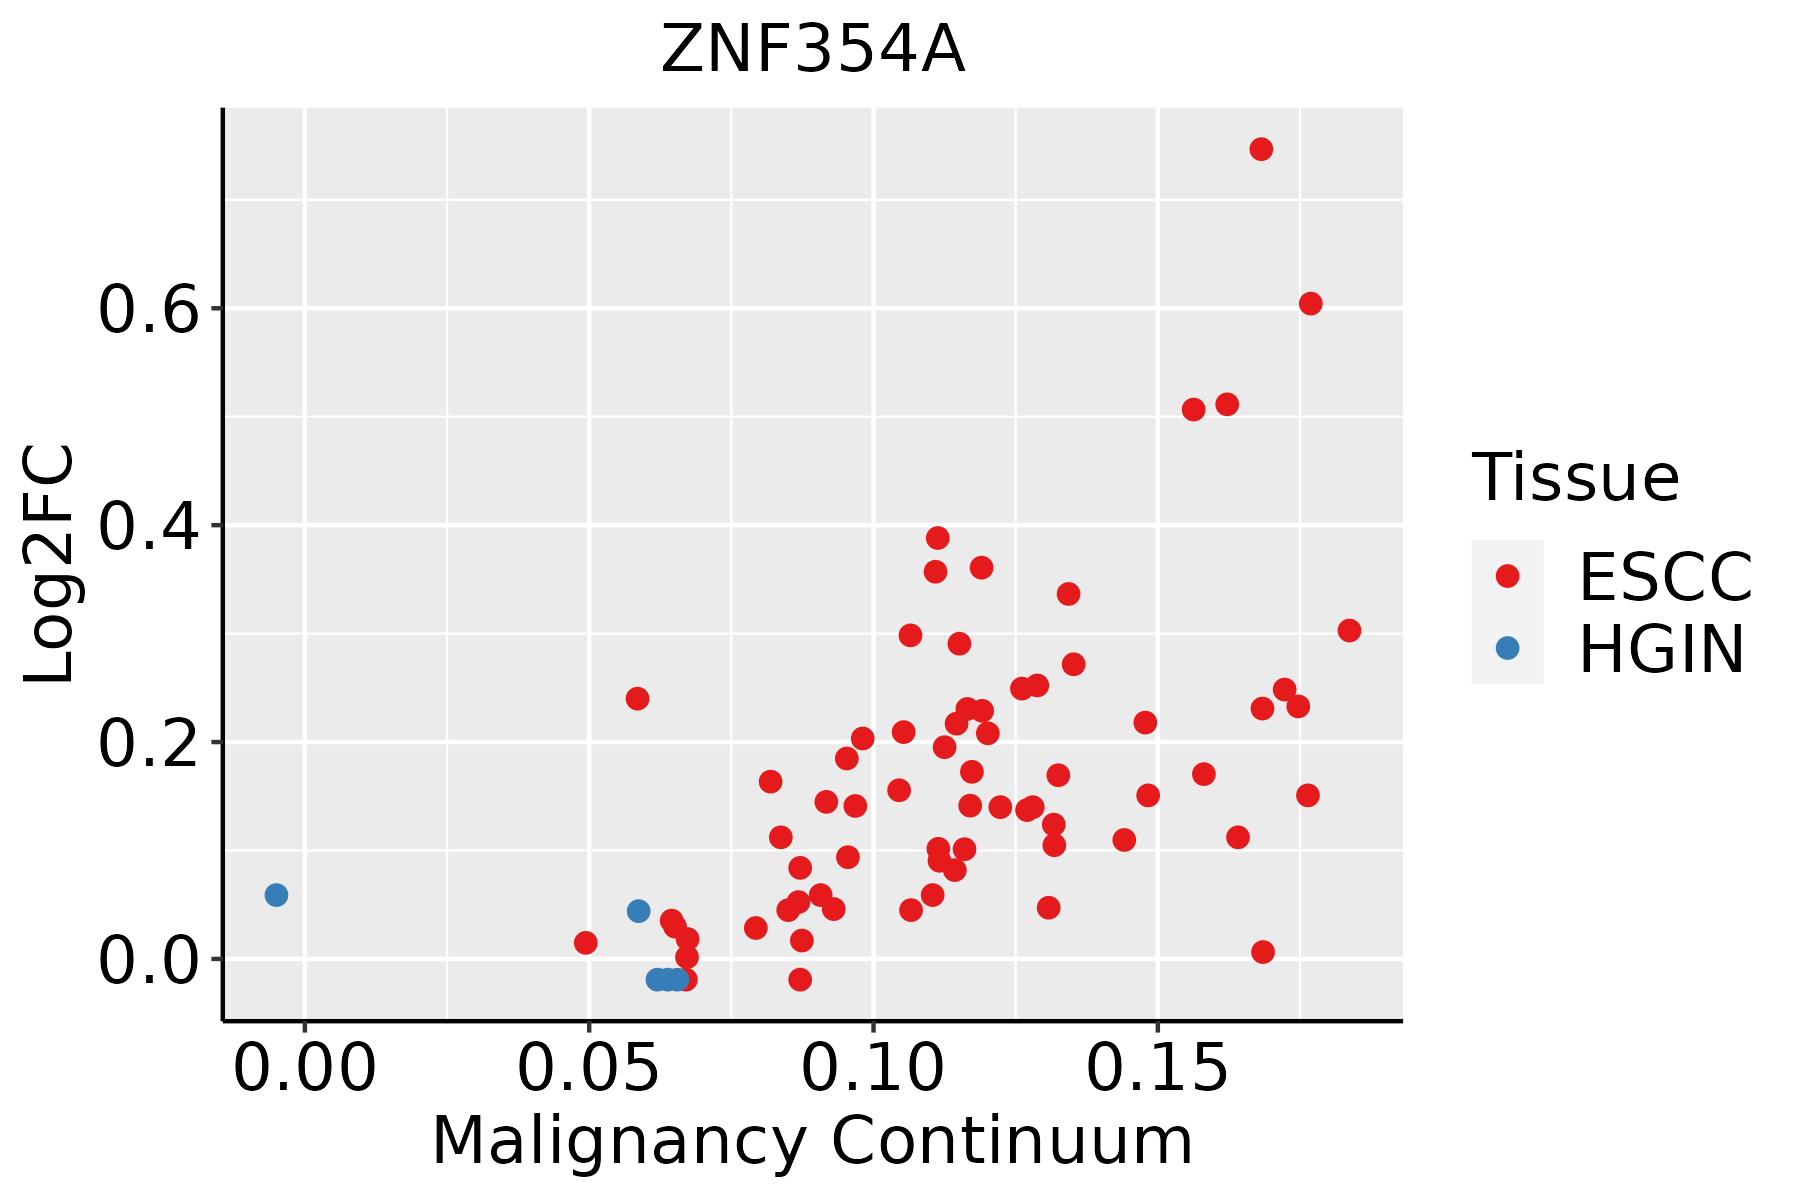 | ESCC: Esophageal squamous cell carcinoma |
| HGIN: High-grade intraepithelial neoplasias | ||
| LGIN: Low-grade intraepithelial neoplasias |
| ∗log2FC in expression of this searched gene in stem-like cells from each diseased tissue sample relative to stem-like cells in normal samples in each tissue plotted against the malignancy continuum. Samples are colored based on if they are from different disease stage. |
Top |
Malignant transformation related pathway analysis |
| Find out the enriched GO biological processes and KEGG pathways involved in transition from healthy to precancer to cancer |
| Tissue | Disease Stage | Enriched GO biological Processes |
| Colorectum | AD |  |
| Colorectum | SER |  |
| Colorectum | MSS |  |
| Colorectum | MSI-H |  |
| Colorectum | FAP |  |
| ∗Top 15 enriched GO BP terms are showed in the bar plot of each disease state in each tissue. Each row represents a significant GO biological process which is colored according to the -log10(p.adjust). |
| Page: 1 2 3 4 5 6 7 8 9 |
| GO ID | Tissue | Disease Stage | Description | Gene Ratio | Bg Ratio | pvalue | p.adjust | Count |
| Page: 1 |
| Pathway ID | Tissue | Disease Stage | Description | Gene Ratio | Bg Ratio | pvalue | p.adjust | qvalue | Count |
| Page: 1 |
Top |
Cell-cell communication analysis |
| Identification of potential cell-cell interactions between two cell types and their ligand-receptor pairs for different disease states |
| Ligand | Receptor | LRpair | Pathway | Tissue | Disease Stage |
| Page: 1 |
Top |
Single-cell gene regulatory network inference analysis |
| Find out the significant the regulons (TFs) and the target genes of each regulon across cell types for different disease states |
| TF | Cell Type | Tissue | Disease Stage | Target Gene | RSS | Regulon Activity |
| ZNF354A | GC | Esophagus | ADJ | BAX,IFI30,EPM2AIP1, etc. | 3.22e-01 |  |
| ZNF354A | GC | Esophagus | ESCC | BAX,IFI30,EPM2AIP1, etc. | 3.11e-01 |  |
| ZNF354A | LYMEND | Esophagus | ADJ | SLC24A2,TTC13,R3HCC1L, etc. | 9.77e-02 | |
| ZNF354A | LYMEND | Esophagus | ESCC | SLC24A2,TTC13,R3HCC1L, etc. | 1.21e-01 | |
| ZNF354A | TREG | Liver | Cirrhotic | CHI3L2,AQP3,TTC28, etc. | 4.49e-02 |  |
| ZNF354A | CD8TCM | Liver | HCC | CHI3L2,AQP3,TTC28, etc. | 4.11e-01 |  |
| ZNF354A | NK | Liver | Healthy | CHI3L2,AQP3,TTC28, etc. | 7.75e-03 |  |
| ∗The dot plots of a searched regulon are shown for all cell subpopulations in each disease state of each tissue based on the regulon specific score inferred using pySCENIC and by calculating the average expression. |
| Page: 1 |
Top |
Somatic mutation of malignant transformation related genes |
| Annotation of somatic variants for genes involved in malignant transformation |
| Hugo Symbol | Variant Class | Variant Classification | dbSNP RS | HGVSc | HGVSp | HGVSp Short | SWISSPROT | BIOTYPE | SIFT | PolyPhen | Tumor Sample Barcode | Tissue | Histology | Sex | Age | Stage | Therapy Types | Drugs | Outcome |
| ZNF354A | SNV | Missense_Mutation | c.1408N>T | p.Val470Leu | p.V470L | O60765 | protein_coding | tolerated(0.11) | probably_damaging(0.992) | TCGA-E9-A1N3-01 | Breast | breast invasive carcinoma | Female | >=65 | III/IV | Chemotherapy | 5-fluorouracil | CR | |
| ZNF354A | SNV | Missense_Mutation | c.143N>C | p.Arg48Thr | p.R48T | O60765 | protein_coding | tolerated(0.53) | benign(0) | TCGA-E9-A1RF-01 | Breast | breast invasive carcinoma | Female | >=65 | III/IV | Hormone Therapy | tamoxiphen | SD | |
| ZNF354A | SNV | Missense_Mutation | rs141789608 | c.443C>T | p.Thr148Ile | p.T148I | O60765 | protein_coding | tolerated(0.12) | benign(0.007) | TCGA-GM-A3XN-01 | Breast | breast invasive carcinoma | Female | <65 | III/IV | Chemotherapy | paclitaxel | CR |
| ZNF354A | insertion | In_Frame_Ins | novel | c.1023_1024insCCAGGAGAGCCC | p.Leu341_Ser342insProGlyGluPro | p.L341_S342insPGEP | O60765 | protein_coding | TCGA-AO-A03R-01 | Breast | breast invasive carcinoma | Female | <65 | I/II | Chemotherapy | doxorubicin | SD | ||
| ZNF354A | insertion | Frame_Shift_Ins | novel | c.1022_1023insGCTGCAG | p.Ser342LeufsTer11 | p.S342Lfs*11 | O60765 | protein_coding | TCGA-AO-A03R-01 | Breast | breast invasive carcinoma | Female | <65 | I/II | Chemotherapy | doxorubicin | SD | ||
| ZNF354A | SNV | Missense_Mutation | novel | c.1772N>T | p.Ser591Leu | p.S591L | O60765 | protein_coding | deleterious(0) | probably_damaging(0.977) | TCGA-C5-A8XJ-01 | Cervix | cervical & endocervical cancer | Female | >=65 | I/II | Chemotherapy | cisplatin | SD |
| ZNF354A | SNV | Missense_Mutation | c.1371N>C | p.Glu457Asp | p.E457D | O60765 | protein_coding | deleterious(0) | benign(0.389) | TCGA-AA-3666-01 | Colorectum | colon adenocarcinoma | Male | >=65 | III/IV | Unknown | Unknown | PD | |
| ZNF354A | SNV | Missense_Mutation | novel | c.264G>C | p.Lys88Asn | p.K88N | O60765 | protein_coding | tolerated(0.11) | benign(0.001) | TCGA-AA-3697-01 | Colorectum | colon adenocarcinoma | Male | >=65 | I/II | Unknown | Unknown | SD |
| ZNF354A | SNV | Missense_Mutation | c.1487G>A | p.Cys496Tyr | p.C496Y | O60765 | protein_coding | deleterious(0) | probably_damaging(0.999) | TCGA-AA-3821-01 | Colorectum | colon adenocarcinoma | Female | >=65 | I/II | Unknown | Unknown | SD | |
| ZNF354A | SNV | Missense_Mutation | c.1305N>T | p.Glu435Asp | p.E435D | O60765 | protein_coding | deleterious(0) | probably_damaging(0.949) | TCGA-AA-A00N-01 | Colorectum | colon adenocarcinoma | Male | >=65 | I/II | Unknown | Unknown | PD |
| Page: 1 2 3 4 5 6 7 8 |
Top |
Related drugs of malignant transformation related genes |
| Identification of chemicals and drugs interact with genes involved in malignant transfromation |
| (DGIdb 4.0) |
| Entrez ID | Symbol | Category | Interaction Types | Drug Claim Name | Drug Name | PMIDs |
| Page: 1 |

Copyright 2023-Present -The University of Texas Health Science Center at Houston |