
|
|||||
|
 | |
| |
| |
| |
| |
| |
|
Gene: ZNF345 |
Gene summary for ZNF345 |
| Gene information | Species | Human | Gene symbol | ZNF345 | Gene ID | 25850 |
| Gene name | zinc finger protein 345 | |
| Gene Alias | HZF10 | |
| Cytomap | 19q13.12 | |
| Gene Type | protein-coding | GO ID | GO:0000122 | UniProtAcc | B2RCE4 |
Top |
Malignant transformation analysis |
| Identification of the aberrant gene expression in precancerous and cancerous lesions by comparing the gene expression of stem-like cells in diseased tissues with normal stem cells |
| Entrez ID | Symbol | Replicates | Species | Organ | Tissue | Adj P-value | Log2FC | Malignancy |
| 25850 | ZNF345 | PTC06 | Human | Thyroid | PTC | 3.72e-05 | 1.26e-01 | 0.2057 |
| 25850 | ZNF345 | ATC13 | Human | Thyroid | ATC | 4.01e-43 | 7.69e-01 | 0.34 |
| 25850 | ZNF345 | ATC5 | Human | Thyroid | ATC | 4.86e-52 | 8.26e-01 | 0.34 |
| Page: 1 |
| Tissue | Expression Dynamics | Abbreviation |
| Thyroid | 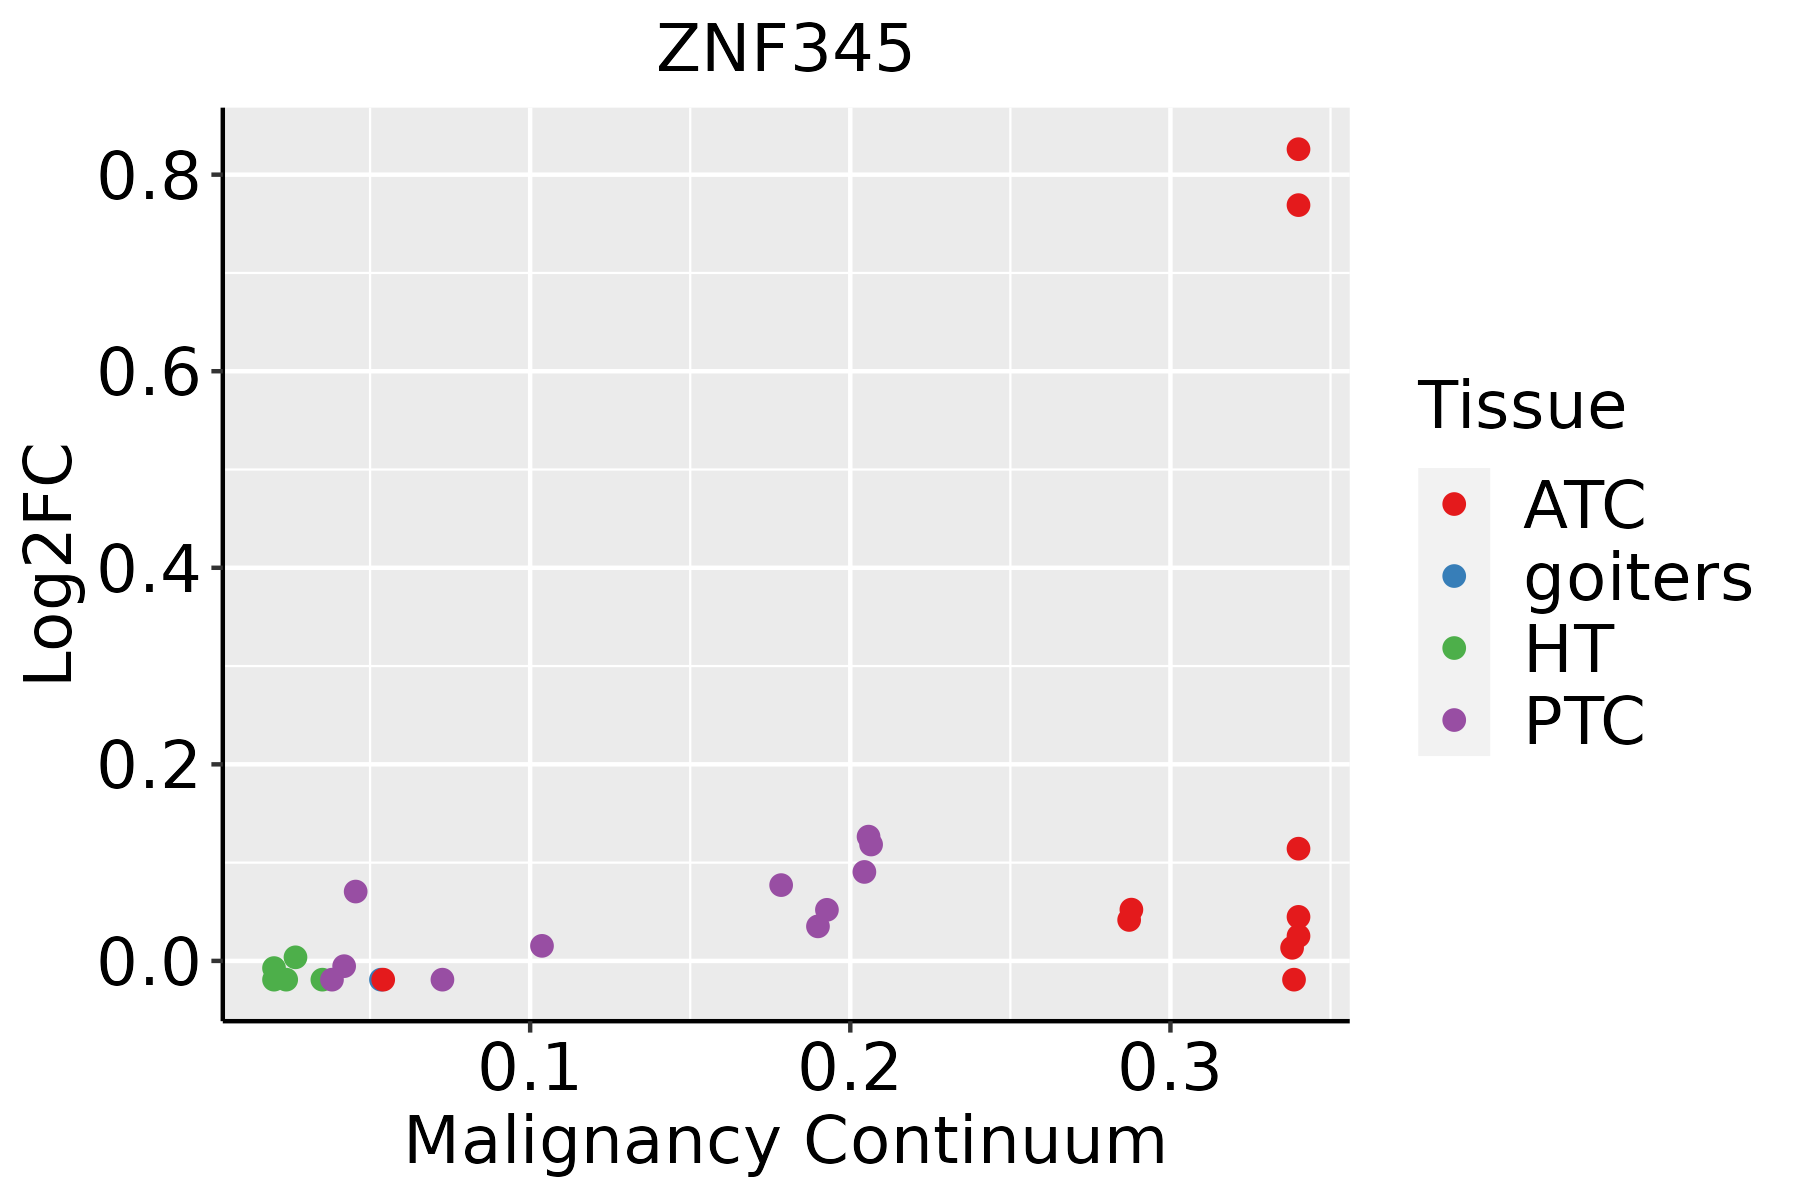 | ATC: Anaplastic thyroid cancer |
| HT: Hashimoto's thyroiditis | ||
| PTC: Papillary thyroid cancer |
| ∗log2FC in expression of this searched gene in stem-like cells from each diseased tissue sample relative to stem-like cells in normal samples in each tissue plotted against the malignancy continuum. Samples are colored based on if they are from different disease stage. |
Top |
Malignant transformation related pathway analysis |
| Find out the enriched GO biological processes and KEGG pathways involved in transition from healthy to precancer to cancer |
| Tissue | Disease Stage | Enriched GO biological Processes |
| Colorectum | AD |  |
| Colorectum | SER |  |
| Colorectum | MSS |  |
| Colorectum | MSI-H |  |
| Colorectum | FAP |  |
| ∗Top 15 enriched GO BP terms are showed in the bar plot of each disease state in each tissue. Each row represents a significant GO biological process which is colored according to the -log10(p.adjust). |
| Page: 1 2 3 4 5 6 7 8 9 |
| GO ID | Tissue | Disease Stage | Description | Gene Ratio | Bg Ratio | pvalue | p.adjust | Count |
| GO:00063835 | Thyroid | PTC | transcription by RNA polymerase III | 23/5968 | 46/18723 | 7.89e-03 | 3.33e-02 | 23 |
| Page: 1 |
| Pathway ID | Tissue | Disease Stage | Description | Gene Ratio | Bg Ratio | pvalue | p.adjust | qvalue | Count |
| Page: 1 |
Top |
Cell-cell communication analysis |
| Identification of potential cell-cell interactions between two cell types and their ligand-receptor pairs for different disease states |
| Ligand | Receptor | LRpair | Pathway | Tissue | Disease Stage |
| Page: 1 |
Top |
Single-cell gene regulatory network inference analysis |
| Find out the significant the regulons (TFs) and the target genes of each regulon across cell types for different disease states |
| TF | Cell Type | Tissue | Disease Stage | Target Gene | RSS | Regulon Activity |
| ZNF345 | BN | Colorectum | CRC | NEK11,EFCAB5,FLYWCH1, etc. | 3.60e-02 |  |
| ZNF345 | MAST | Esophagus | Healthy | BARX2,DLEU2,NFATC1, etc. | 1.95e-01 |  |
| ZNF345 | PVA | Liver | HCC | LRRC49,IGF1,RNF19B, etc. | 3.79e-02 |  |
| ZNF345 | cDC | Lung | Healthy | IL7R,SYK,UQCC1, etc. | 2.21e-03 |  |
| ∗The dot plots of a searched regulon are shown for all cell subpopulations in each disease state of each tissue based on the regulon specific score inferred using pySCENIC and by calculating the average expression. |
| Page: 1 |
Top |
Somatic mutation of malignant transformation related genes |
| Annotation of somatic variants for genes involved in malignant transformation |
| Hugo Symbol | Variant Class | Variant Classification | dbSNP RS | HGVSc | HGVSp | HGVSp Short | SWISSPROT | BIOTYPE | SIFT | PolyPhen | Tumor Sample Barcode | Tissue | Histology | Sex | Age | Stage | Therapy Types | Drugs | Outcome |
| ZNF345 | SNV | Missense_Mutation | novel | c.670N>T | p.His224Tyr | p.H224Y | Q14585 | protein_coding | deleterious(0.01) | probably_damaging(0.998) | TCGA-A1-A0SI-01 | Breast | breast invasive carcinoma | Female | <65 | I/II | Unknown | Unknown | SD |
| ZNF345 | SNV | Missense_Mutation | rs149256110 | c.1204G>C | p.Glu402Gln | p.E402Q | Q14585 | protein_coding | tolerated(0.23) | benign(0.058) | TCGA-B6-A0X1-01 | Breast | breast invasive carcinoma | Female | <65 | I/II | Unknown | Unknown | PD |
| ZNF345 | SNV | Missense_Mutation | c.681N>C | p.Glu227Asp | p.E227D | Q14585 | protein_coding | deleterious(0.03) | benign(0.114) | TCGA-BH-A18P-01 | Breast | breast invasive carcinoma | Female | <65 | I/II | Unknown | Unknown | PD | |
| ZNF345 | SNV | Missense_Mutation | c.455N>T | p.Gly152Val | p.G152V | Q14585 | protein_coding | deleterious(0) | probably_damaging(0.996) | TCGA-FU-A3HZ-01 | Cervix | cervical & endocervical cancer | Female | <65 | I/II | Chemotherapy | cisplatin | CR | |
| ZNF345 | SNV | Missense_Mutation | rs768258870 | c.1142N>T | p.Ser381Ile | p.S381I | Q14585 | protein_coding | tolerated(0.28) | possibly_damaging(0.781) | TCGA-VS-A953-01 | Cervix | cervical & endocervical cancer | Female | <65 | I/II | Unknown | Unknown | PD |
| ZNF345 | SNV | Missense_Mutation | c.592N>T | p.Gly198Cys | p.G198C | Q14585 | protein_coding | deleterious(0) | probably_damaging(0.998) | TCGA-AA-3492-01 | Colorectum | colon adenocarcinoma | Female | >=65 | I/II | Unknown | Unknown | SD | |
| ZNF345 | SNV | Missense_Mutation | c.641G>A | p.Gly214Asp | p.G214D | Q14585 | protein_coding | tolerated(0.11) | benign(0) | TCGA-AA-3833-01 | Colorectum | colon adenocarcinoma | Female | <65 | I/II | Unknown | Unknown | SD | |
| ZNF345 | SNV | Missense_Mutation | c.1376G>T | p.Cys459Phe | p.C459F | Q14585 | protein_coding | deleterious(0.02) | benign(0.163) | TCGA-AA-3864-01 | Colorectum | colon adenocarcinoma | Male | >=65 | I/II | Unknown | Unknown | SD | |
| ZNF345 | SNV | Missense_Mutation | rs560905535 | c.665N>A | p.Arg222Gln | p.R222Q | Q14585 | protein_coding | deleterious(0.01) | possibly_damaging(0.552) | TCGA-AA-3950-01 | Colorectum | colon adenocarcinoma | Female | >=65 | I/II | Unknown | Unknown | SD |
| ZNF345 | SNV | Missense_Mutation | rs143253432 | c.245G>A | p.Arg82Gln | p.R82Q | Q14585 | protein_coding | deleterious(0.04) | benign(0.059) | TCGA-AA-A00N-01 | Colorectum | colon adenocarcinoma | Male | >=65 | I/II | Unknown | Unknown | PD |
| Page: 1 2 3 4 5 6 7 8 9 |
Top |
Related drugs of malignant transformation related genes |
| Identification of chemicals and drugs interact with genes involved in malignant transfromation |
| (DGIdb 4.0) |
| Entrez ID | Symbol | Category | Interaction Types | Drug Claim Name | Drug Name | PMIDs |
| Page: 1 |

Copyright 2023-Present -The University of Texas Health Science Center at Houston |