
|
|||||
|
 | |
| |
| |
| |
| |
| |
|
Gene: ZNF33A |
Gene summary for ZNF33A |
| Gene information | Species | Human | Gene symbol | ZNF33A | Gene ID | 7581 |
| Gene name | zinc finger protein 33A | |
| Gene Alias | KOX2 | |
| Cytomap | 10p11.1 | |
| Gene Type | protein-coding | GO ID | GO:0006139 | UniProtAcc | Q06730 |
Top |
Malignant transformation analysis |
| Identification of the aberrant gene expression in precancerous and cancerous lesions by comparing the gene expression of stem-like cells in diseased tissues with normal stem cells |
| Entrez ID | Symbol | Replicates | Species | Organ | Tissue | Adj P-value | Log2FC | Malignancy |
| 7581 | ZNF33A | HTA11_3410_2000001011 | Human | Colorectum | AD | 8.78e-04 | -2.78e-01 | 0.0155 |
| 7581 | ZNF33A | HTA11_347_2000001011 | Human | Colorectum | AD | 1.39e-05 | 5.11e-01 | -0.1954 |
| 7581 | ZNF33A | HTA11_99999974143_84620 | Human | Colorectum | MSS | 1.41e-03 | -3.51e-01 | 0.3005 |
| 7581 | ZNF33A | F007 | Human | Colorectum | FAP | 1.79e-03 | -3.14e-01 | 0.1176 |
| 7581 | ZNF33A | A001-C-207 | Human | Colorectum | FAP | 7.29e-04 | -2.76e-01 | 0.1278 |
| 7581 | ZNF33A | A015-C-203 | Human | Colorectum | FAP | 1.00e-22 | -3.24e-01 | -0.1294 |
| 7581 | ZNF33A | A015-C-204 | Human | Colorectum | FAP | 6.33e-07 | -3.04e-01 | -0.0228 |
| 7581 | ZNF33A | A014-C-040 | Human | Colorectum | FAP | 1.19e-04 | -4.17e-01 | -0.1184 |
| 7581 | ZNF33A | A002-C-201 | Human | Colorectum | FAP | 3.97e-14 | -3.64e-01 | 0.0324 |
| 7581 | ZNF33A | A001-C-119 | Human | Colorectum | FAP | 2.68e-06 | -3.52e-01 | -0.1557 |
| 7581 | ZNF33A | A001-C-108 | Human | Colorectum | FAP | 1.25e-10 | -2.94e-01 | -0.0272 |
| 7581 | ZNF33A | A002-C-205 | Human | Colorectum | FAP | 1.82e-25 | -4.94e-01 | -0.1236 |
| 7581 | ZNF33A | A001-C-104 | Human | Colorectum | FAP | 2.96e-02 | -2.10e-01 | 0.0184 |
| 7581 | ZNF33A | A015-C-005 | Human | Colorectum | FAP | 2.94e-02 | -4.60e-02 | -0.0336 |
| 7581 | ZNF33A | A015-C-006 | Human | Colorectum | FAP | 1.19e-15 | -5.05e-01 | -0.0994 |
| 7581 | ZNF33A | A015-C-106 | Human | Colorectum | FAP | 1.19e-09 | -1.84e-01 | -0.0511 |
| 7581 | ZNF33A | A002-C-114 | Human | Colorectum | FAP | 1.35e-17 | -3.58e-01 | -0.1561 |
| 7581 | ZNF33A | A015-C-104 | Human | Colorectum | FAP | 8.63e-25 | -4.20e-01 | -0.1899 |
| 7581 | ZNF33A | A001-C-014 | Human | Colorectum | FAP | 1.06e-11 | -3.17e-01 | 0.0135 |
| 7581 | ZNF33A | A002-C-016 | Human | Colorectum | FAP | 1.56e-17 | -3.72e-01 | 0.0521 |
| Page: 1 2 3 4 5 6 |
| Tissue | Expression Dynamics | Abbreviation |
| Colorectum (GSE201348) |  | FAP: Familial adenomatous polyposis |
| CRC: Colorectal cancer | ||
| Colorectum (HTA11) |  | AD: Adenomas |
| SER: Sessile serrated lesions | ||
| MSI-H: Microsatellite-high colorectal cancer | ||
| MSS: Microsatellite stable colorectal cancer | ||
| Esophagus | 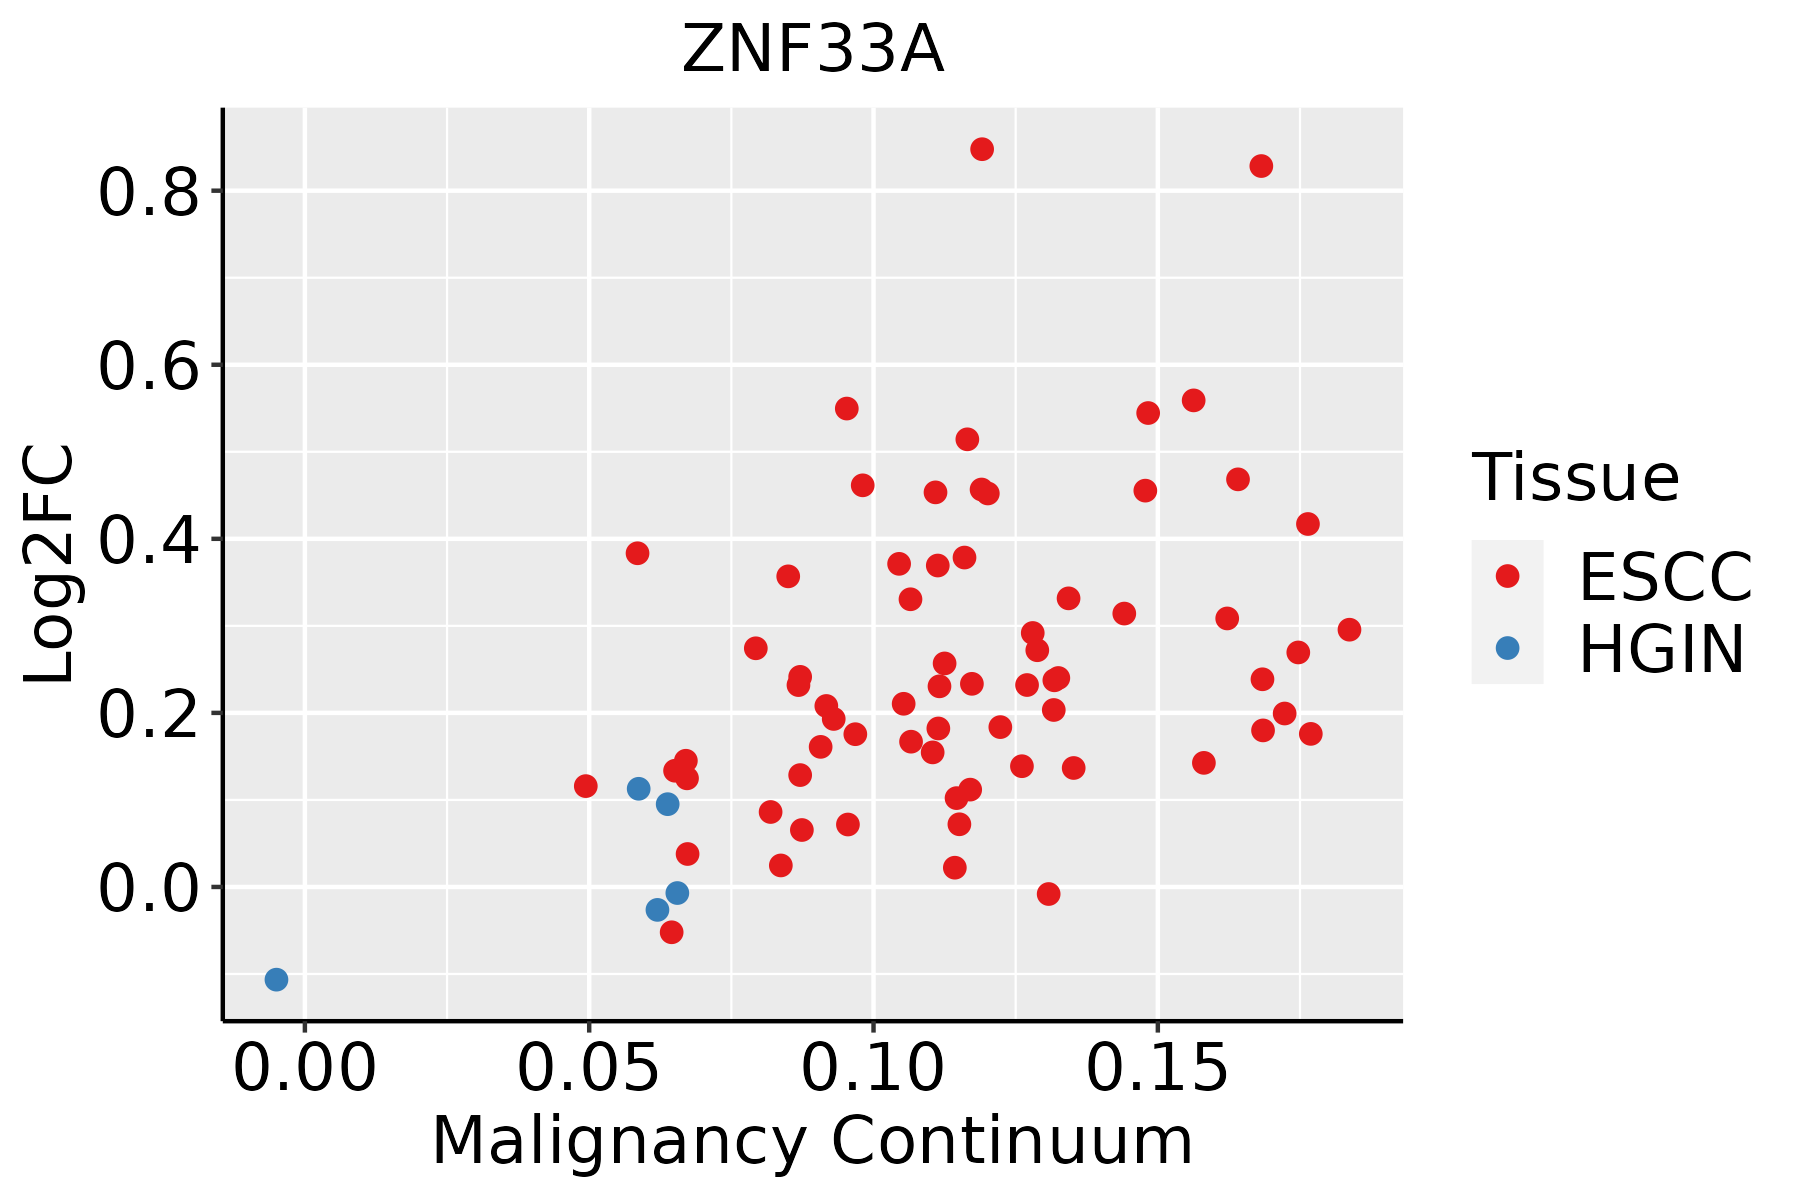 | ESCC: Esophageal squamous cell carcinoma |
| HGIN: High-grade intraepithelial neoplasias | ||
| LGIN: Low-grade intraepithelial neoplasias | ||
| Liver | 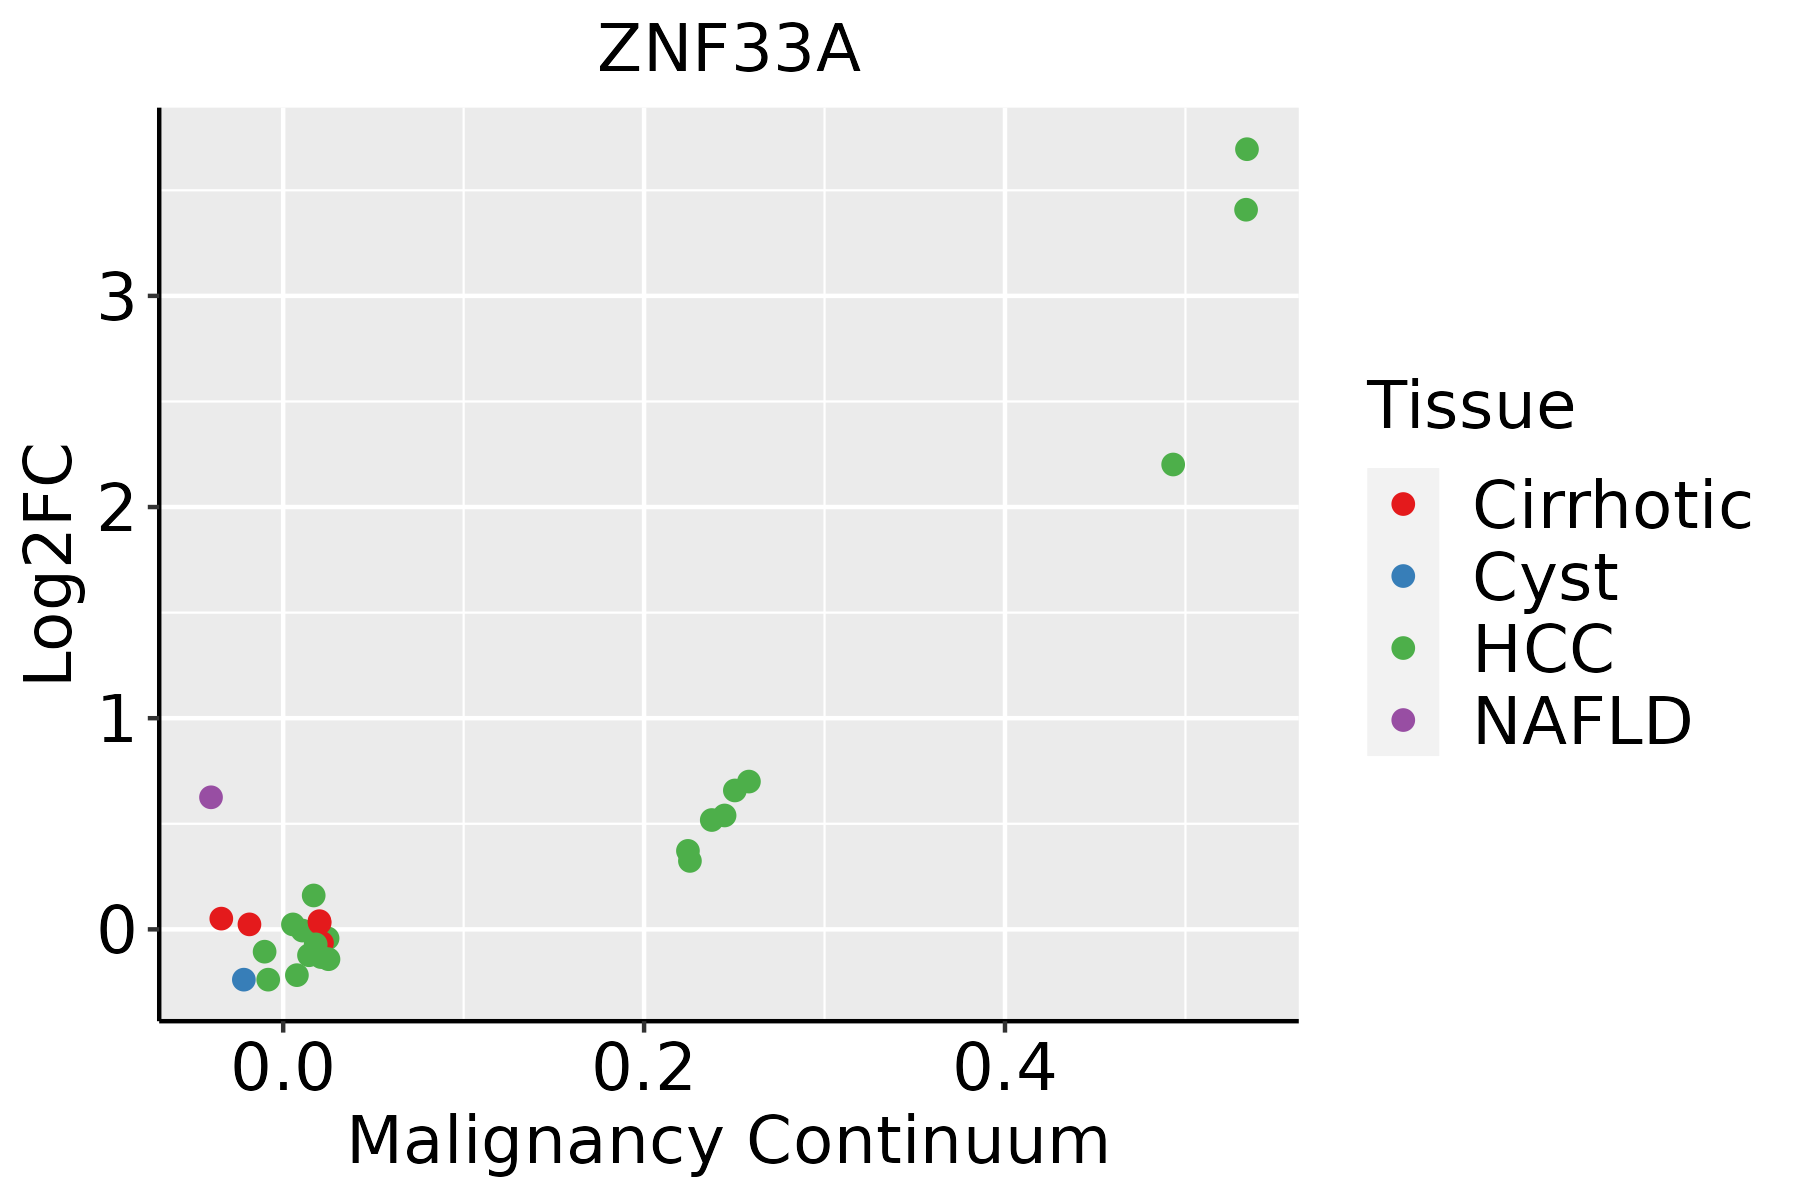 | HCC: Hepatocellular carcinoma |
| NAFLD: Non-alcoholic fatty liver disease | ||
| Skin | 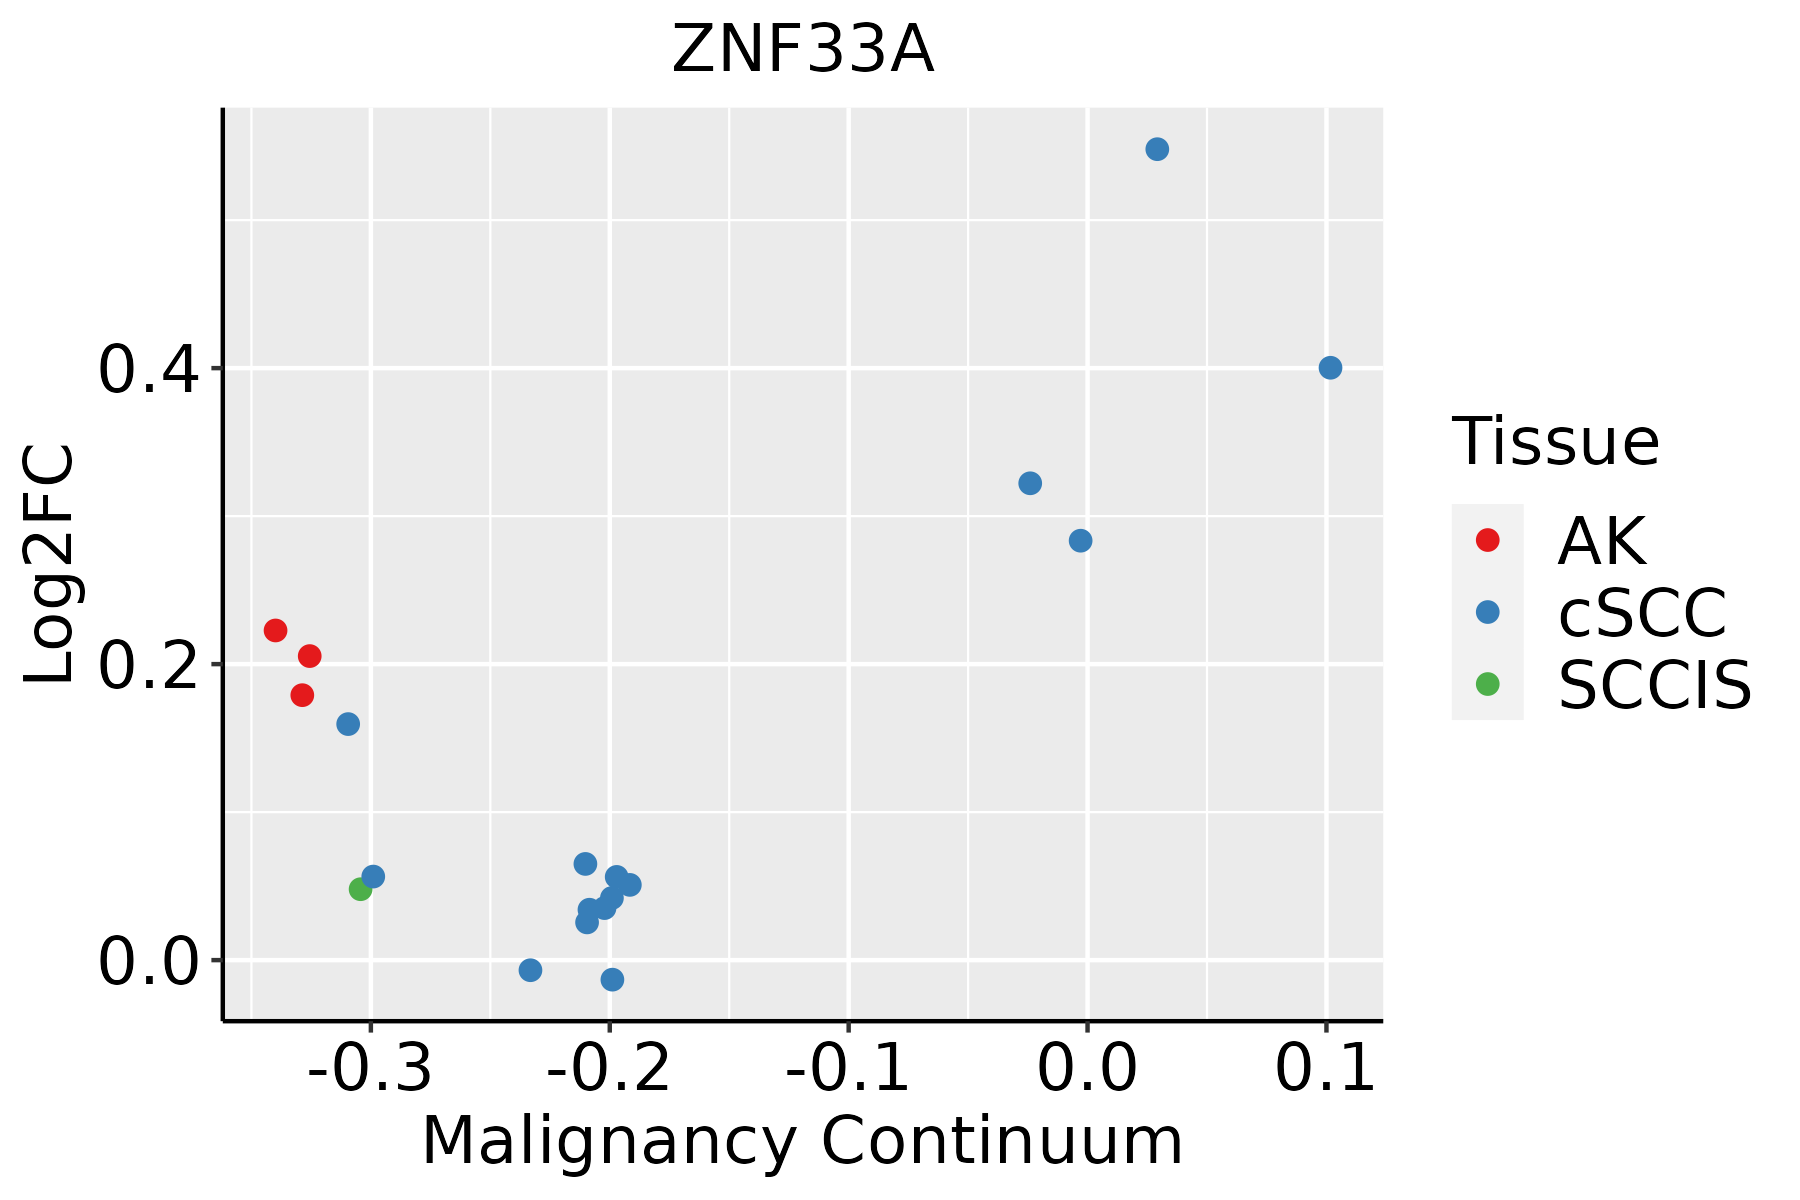 | AK: Actinic keratosis |
| cSCC: Cutaneous squamous cell carcinoma | ||
| SCCIS:squamous cell carcinoma in situ | ||
| Thyroid | 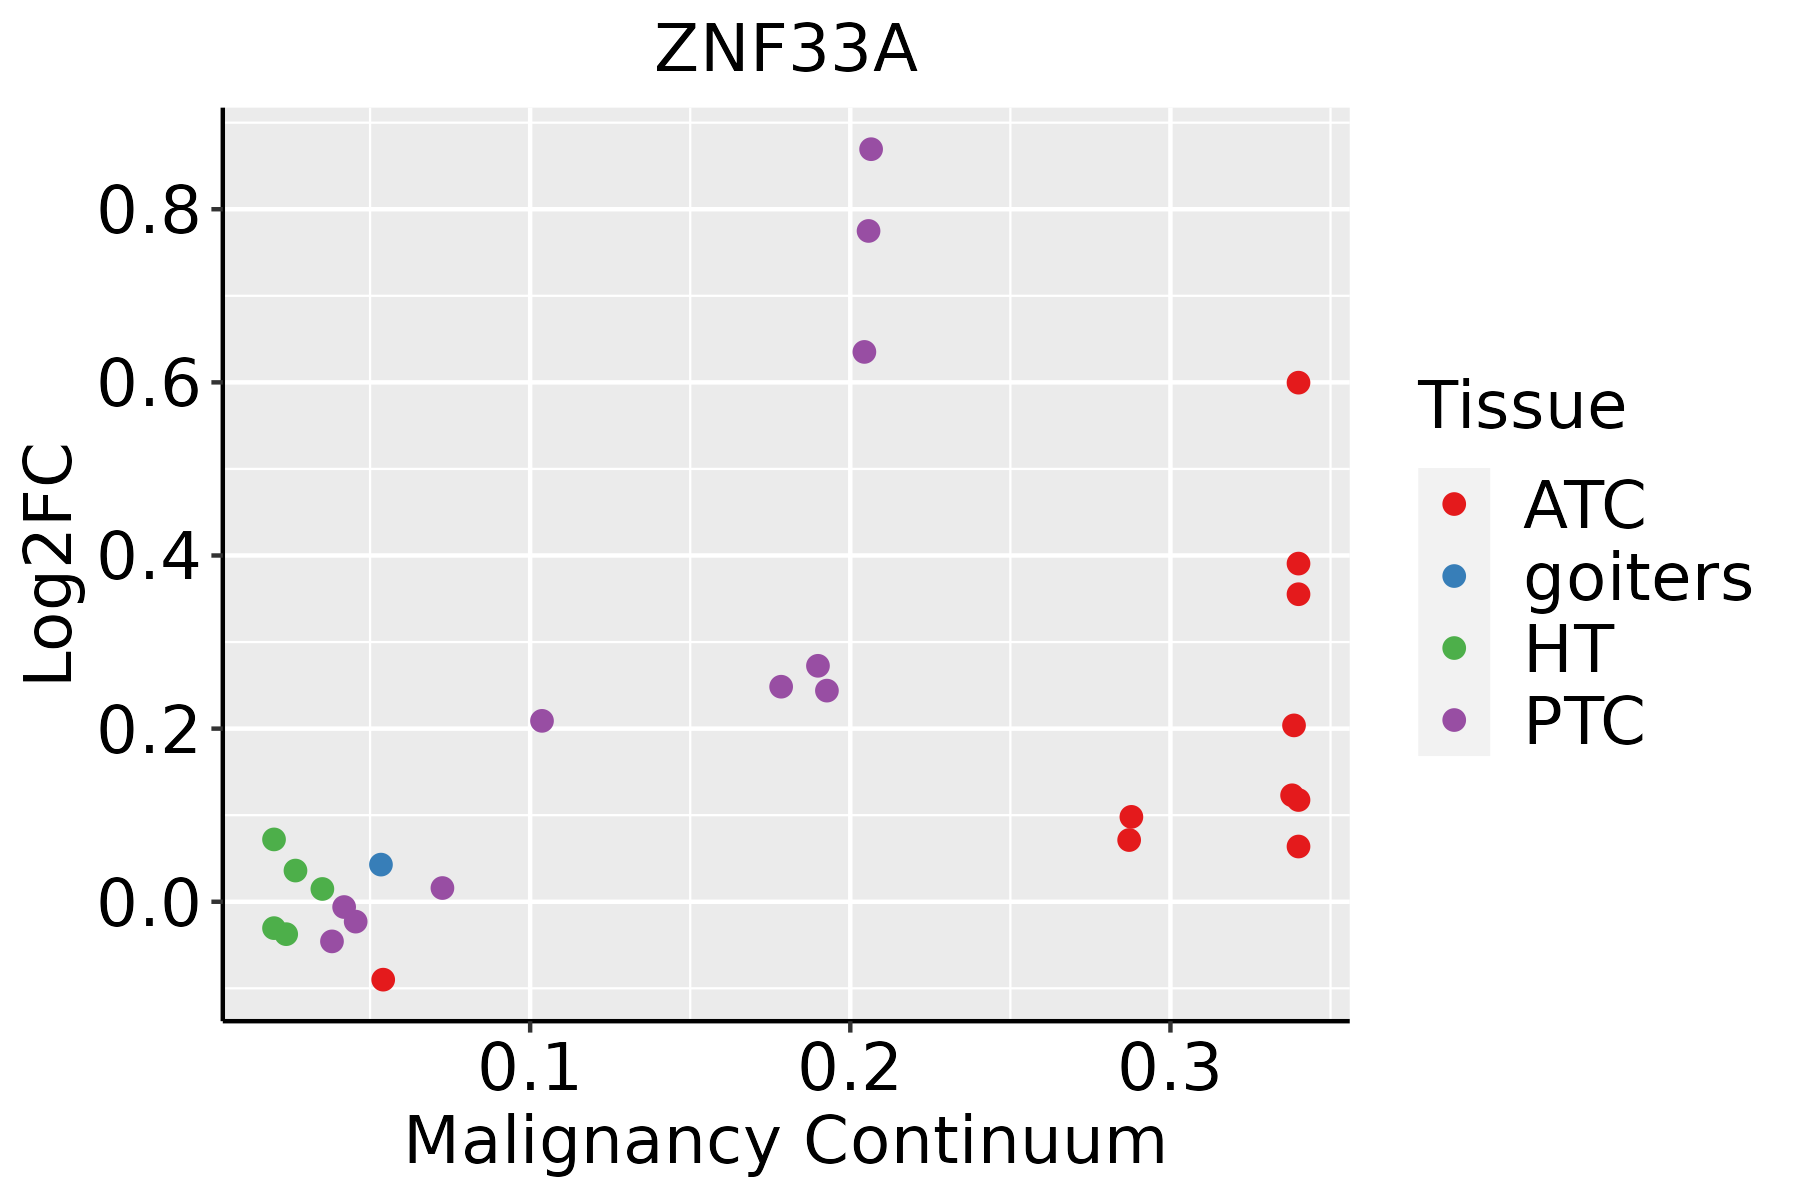 | ATC: Anaplastic thyroid cancer |
| HT: Hashimoto's thyroiditis | ||
| PTC: Papillary thyroid cancer |
| ∗log2FC in expression of this searched gene in stem-like cells from each diseased tissue sample relative to stem-like cells in normal samples in each tissue plotted against the malignancy continuum. Samples are colored based on if they are from different disease stage. |
Top |
Malignant transformation related pathway analysis |
| Find out the enriched GO biological processes and KEGG pathways involved in transition from healthy to precancer to cancer |
| Tissue | Disease Stage | Enriched GO biological Processes |
| Colorectum | AD |  |
| Colorectum | SER |  |
| Colorectum | MSS |  |
| Colorectum | MSI-H |  |
| Colorectum | FAP |  |
| ∗Top 15 enriched GO BP terms are showed in the bar plot of each disease state in each tissue. Each row represents a significant GO biological process which is colored according to the -log10(p.adjust). |
| Page: 1 2 3 4 5 6 7 8 9 |
| GO ID | Tissue | Disease Stage | Description | Gene Ratio | Bg Ratio | pvalue | p.adjust | Count |
| Page: 1 |
| Pathway ID | Tissue | Disease Stage | Description | Gene Ratio | Bg Ratio | pvalue | p.adjust | qvalue | Count |
| Page: 1 |
Top |
Cell-cell communication analysis |
| Identification of potential cell-cell interactions between two cell types and their ligand-receptor pairs for different disease states |
| Ligand | Receptor | LRpair | Pathway | Tissue | Disease Stage |
| Page: 1 |
Top |
Single-cell gene regulatory network inference analysis |
| Find out the significant the regulons (TFs) and the target genes of each regulon across cell types for different disease states |
| TF | Cell Type | Tissue | Disease Stage | Target Gene | RSS | Regulon Activity |
| ZNF33A | CHO | Liver | Cirrhotic | TAP2,ZNF7,CDK8, etc. | 3.85e-01 |  |
| ZNF33A | CHO | Liver | NAFLD | TAP2,ZNF7,CDK8, etc. | 4.37e-01 |  |
| ZNF33A | BMEM | Lung | Healthy | TINF2,GLCE,HSPA4, etc. | 5.45e-03 |  |
| ZNF33A | MALTB | Oral cavity | EOLP | AC022210.2,AC078845.1,DNAJC13, etc. | 2.65e-01 |  |
| ZNF33A | MALTB | Oral cavity | LP | AC022210.2,AC078845.1,DNAJC13, etc. | 4.97e-02 |  |
| ZNF33A | MALTB | Oral cavity | OSCC | AC022210.2,AC078845.1,DNAJC13, etc. | 2.15e-01 |  |
| ZNF33A | CYC | Skin | Healthy | C1QA,SYNC,SMARCA5, etc. | 1.60e-01 |  |
| ZNF33A | CHIEF | Stomach | ADJ | C10orf10,ARHGEF37,FAM213B, etc. | 3.71e-01 |  |
| ZNF33A | GMC | Stomach | ADJ | C10orf10,ARHGEF37,FAM213B, etc. | 1.76e-01 | |
| ZNF33A | CHIEF | Stomach | CAG | C10orf10,ARHGEF37,FAM213B, etc. | 1.48e-01 |  |
| ∗The dot plots of a searched regulon are shown for all cell subpopulations in each disease state of each tissue based on the regulon specific score inferred using pySCENIC and by calculating the average expression. |
| Page: 1 2 |
Top |
Somatic mutation of malignant transformation related genes |
| Annotation of somatic variants for genes involved in malignant transformation |
| Hugo Symbol | Variant Class | Variant Classification | dbSNP RS | HGVSc | HGVSp | HGVSp Short | SWISSPROT | BIOTYPE | SIFT | PolyPhen | Tumor Sample Barcode | Tissue | Histology | Sex | Age | Stage | Therapy Types | Drugs | Outcome |
| ZNF33A | SNV | Missense_Mutation | c.500N>C | p.Phe167Ser | p.F167S | protein_coding | tolerated(0.12) | benign(0.139) | TCGA-AN-A0FY-01 | Breast | breast invasive carcinoma | Female | <65 | I/II | Unknown | Unknown | SD | ||
| ZNF33A | SNV | Missense_Mutation | c.826N>A | p.Asp276Asn | p.D276N | protein_coding | tolerated(0.17) | benign(0.162) | TCGA-D8-A1JA-01 | Breast | breast invasive carcinoma | Female | <65 | III/IV | Chemotherapy | adriamycin | PD | ||
| ZNF33A | SNV | Missense_Mutation | c.1441N>G | p.His481Asp | p.H481D | protein_coding | deleterious(0) | probably_damaging(1) | TCGA-D8-A1JA-01 | Breast | breast invasive carcinoma | Female | <65 | III/IV | Chemotherapy | adriamycin | PD | ||
| ZNF33A | SNV | Missense_Mutation | novel | c.636G>T | p.Leu212Phe | p.L212F | protein_coding | tolerated(0.7) | benign(0.007) | TCGA-E2-A14V-01 | Breast | breast invasive carcinoma | Female | <65 | I/II | Chemotherapy | cyclophosphamide | SD | |
| ZNF33A | SNV | Missense_Mutation | novel | c.503A>C | p.Asn168Thr | p.N168T | protein_coding | tolerated(0.48) | possibly_damaging(0.516) | TCGA-2W-A8YY-01 | Cervix | cervical & endocervical cancer | Female | <65 | I/II | Chemotherapy | cisplatin | CR | |
| ZNF33A | SNV | Missense_Mutation | rs767831049 | c.280N>A | p.Glu94Lys | p.E94K | protein_coding | tolerated(0.08) | benign(0.098) | TCGA-C5-A1BQ-01 | Cervix | cervical & endocervical cancer | Female | >=65 | III/IV | Chemotherapy | cisplatin | CR | |
| ZNF33A | SNV | Missense_Mutation | rs750562291 | c.1956N>C | p.Glu652Asp | p.E652D | protein_coding | tolerated(0.05) | benign(0.04) | TCGA-C5-A8YQ-01 | Cervix | cervical & endocervical cancer | Female | >=65 | I/II | Chemotherapy | cisplatin | PD | |
| ZNF33A | SNV | Missense_Mutation | rs144855227 | c.1304N>T | p.Ala435Val | p.A435V | protein_coding | tolerated(0.14) | benign(0.033) | TCGA-EA-A3HU-01 | Cervix | cervical & endocervical cancer | Female | <65 | I/II | Unknown | Unknown | SD | |
| ZNF33A | SNV | Missense_Mutation | c.1898N>C | p.Gly633Ala | p.G633A | protein_coding | deleterious(0.03) | possibly_damaging(0.879) | TCGA-IR-A3LK-01 | Cervix | cervical & endocervical cancer | Female | >=65 | I/II | Chemotherapy | cisplatin | PD | ||
| ZNF33A | SNV | Missense_Mutation | novel | c.1042N>A | p.Glu348Lys | p.E348K | protein_coding | tolerated(0.07) | benign(0.169) | TCGA-VS-A958-01 | Cervix | cervical & endocervical cancer | Female | <65 | I/II | Chemotherapy | cisplatin | CR |
| Page: 1 2 3 4 5 6 7 8 9 10 11 12 13 |
Top |
Related drugs of malignant transformation related genes |
| Identification of chemicals and drugs interact with genes involved in malignant transfromation |
| (DGIdb 4.0) |
| Entrez ID | Symbol | Category | Interaction Types | Drug Claim Name | Drug Name | PMIDs |
| Page: 1 |

Copyright 2023-Present -The University of Texas Health Science Center at Houston |