
|
|||||
|
 | |
| |
| |
| |
| |
| |
|
Gene: ZNF331 |
Gene summary for ZNF331 |
| Gene information | Species | Human | Gene symbol | ZNF331 | Gene ID | 55422 |
| Gene name | zinc finger protein 331 | |
| Gene Alias | RITA | |
| Cytomap | 19q13.42 | |
| Gene Type | protein-coding | GO ID | GO:0006139 | UniProtAcc | A0A024R4J5 |
Top |
Malignant transformation analysis |
| Identification of the aberrant gene expression in precancerous and cancerous lesions by comparing the gene expression of stem-like cells in diseased tissues with normal stem cells |
| Entrez ID | Symbol | Replicates | Species | Organ | Tissue | Adj P-value | Log2FC | Malignancy |
| 55422 | ZNF331 | HSIL_HPV_1 | Human | Cervix | HSIL_HPV | 1.28e-03 | -4.68e-01 | 0.0116 |
| 55422 | ZNF331 | HSIL_HPV_2 | Human | Cervix | HSIL_HPV | 4.72e-13 | -5.26e-01 | 0.0208 |
| 55422 | ZNF331 | N_HPV_2 | Human | Cervix | N_HPV | 1.83e-02 | -2.23e-01 | -0.0131 |
| 55422 | ZNF331 | CCI_2 | Human | Cervix | CC | 2.72e-03 | -5.81e-01 | 0.5249 |
| 55422 | ZNF331 | CCII_1 | Human | Cervix | CC | 2.28e-02 | -5.03e-01 | 0.3249 |
| 55422 | ZNF331 | Tumor | Human | Cervix | CC | 5.22e-21 | -5.70e-01 | 0.1241 |
| 55422 | ZNF331 | sample1 | Human | Cervix | CC | 8.48e-04 | -5.58e-01 | 0.0959 |
| 55422 | ZNF331 | sample3 | Human | Cervix | CC | 1.62e-15 | -5.59e-01 | 0.1387 |
| 55422 | ZNF331 | H2 | Human | Cervix | HSIL_HPV | 6.73e-09 | -4.59e-01 | 0.0632 |
| 55422 | ZNF331 | L1 | Human | Cervix | CC | 8.45e-04 | -4.94e-01 | 0.0802 |
| 55422 | ZNF331 | T1 | Human | Cervix | CC | 4.68e-10 | -5.48e-01 | 0.0918 |
| 55422 | ZNF331 | T3 | Human | Cervix | CC | 3.11e-17 | -5.54e-01 | 0.1389 |
| 55422 | ZNF331 | AEH-subject4 | Human | Endometrium | AEH | 1.43e-11 | 5.48e-01 | -0.2657 |
| 55422 | ZNF331 | AEH-subject5 | Human | Endometrium | AEH | 1.12e-04 | 2.55e-01 | -0.2953 |
| 55422 | ZNF331 | EEC-subject1 | Human | Endometrium | EEC | 1.48e-02 | 2.48e-01 | -0.2682 |
| 55422 | ZNF331 | EEC-subject4 | Human | Endometrium | EEC | 3.63e-07 | 3.30e-01 | -0.2571 |
| 55422 | ZNF331 | EEC-subject5 | Human | Endometrium | EEC | 1.78e-04 | 3.19e-01 | -0.249 |
| 55422 | ZNF331 | GSM6177620_NYU_UCEC1_lib1_lib1 | Human | Endometrium | EEC | 9.04e-04 | 3.08e-02 | -0.1869 |
| 55422 | ZNF331 | GSM6177620_NYU_UCEC1_lib2_lib2 | Human | Endometrium | EEC | 1.41e-02 | -1.04e-01 | -0.1875 |
| 55422 | ZNF331 | GSM6177620_NYU_UCEC1_lib3_lib3 | Human | Endometrium | EEC | 4.12e-06 | -5.42e-02 | -0.1883 |
| Page: 1 2 3 4 5 |
| Tissue | Expression Dynamics | Abbreviation |
| Cervix | 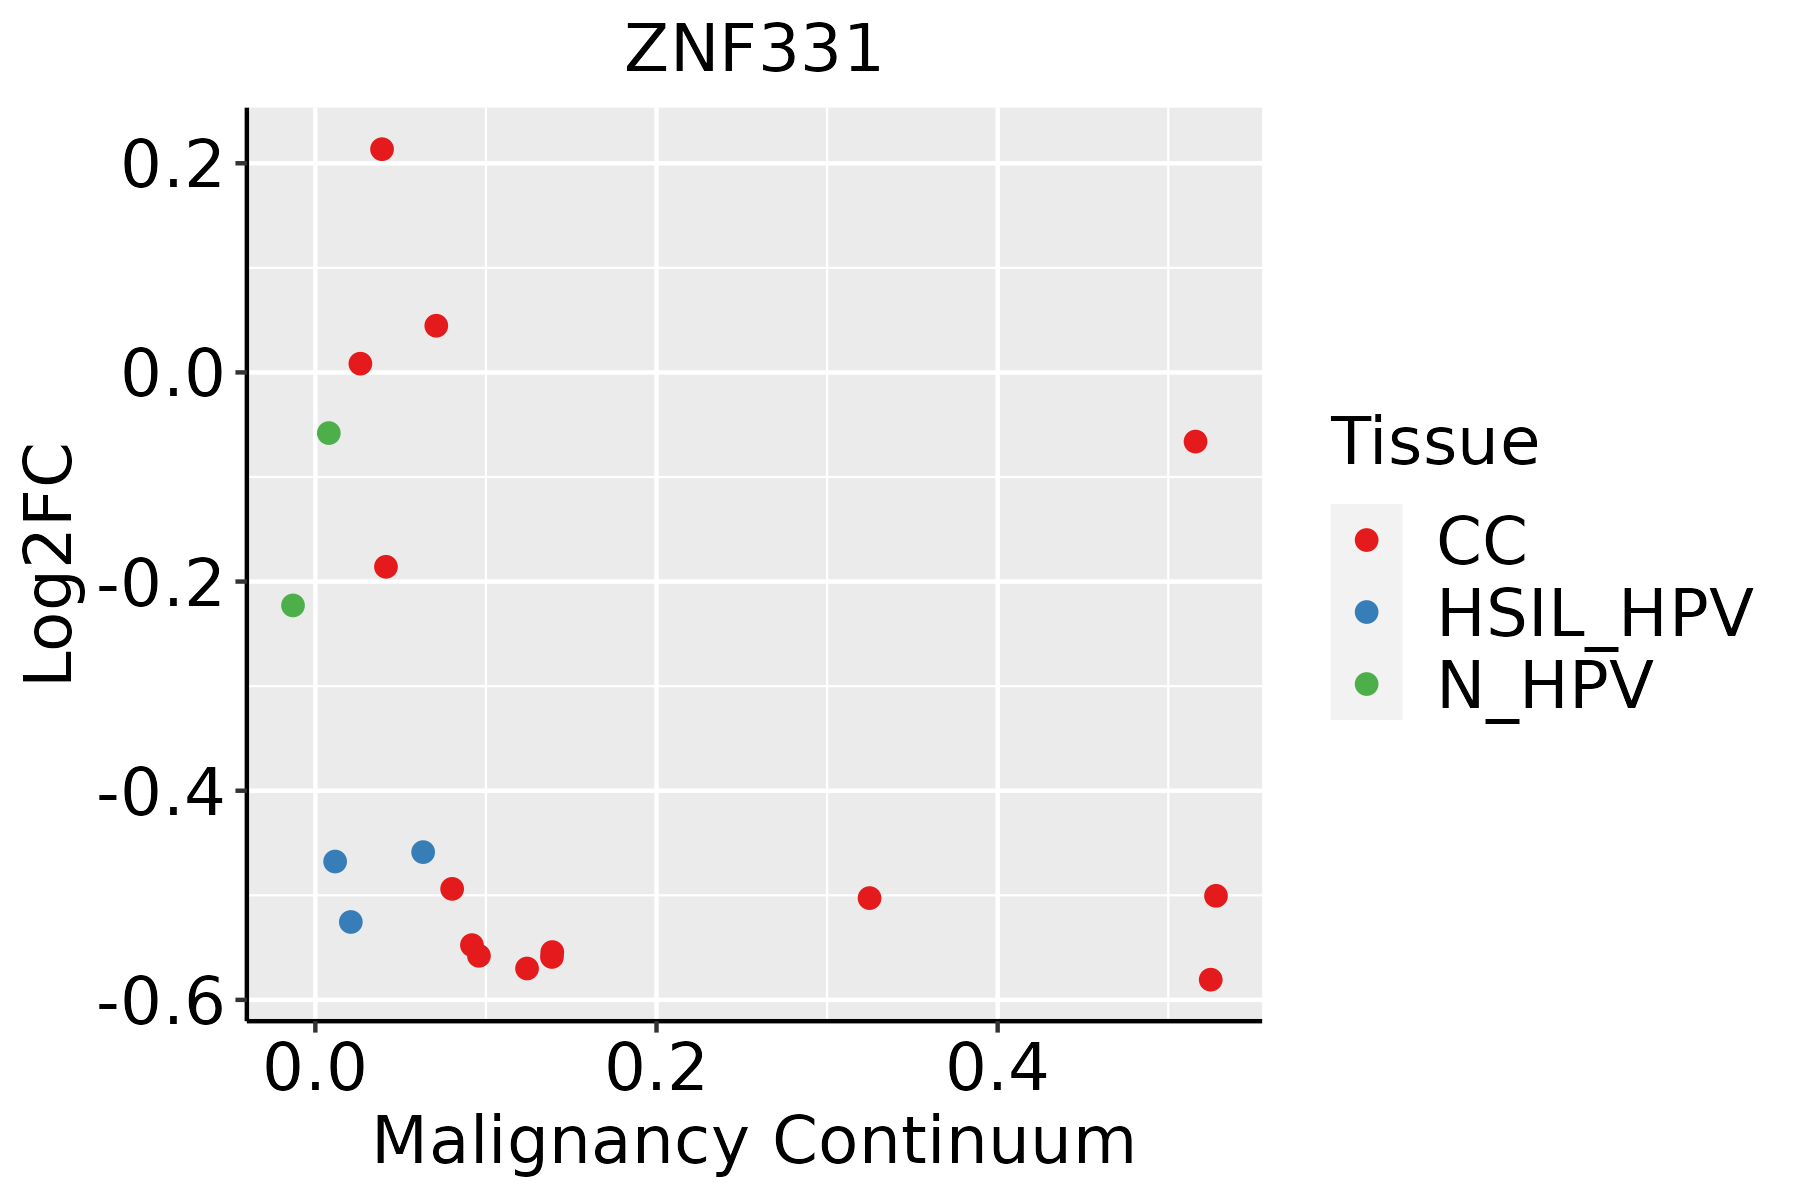 | CC: Cervix cancer |
| HSIL_HPV: HPV-infected high-grade squamous intraepithelial lesions | ||
| N_HPV: HPV-infected normal cervix | ||
| Endometrium | 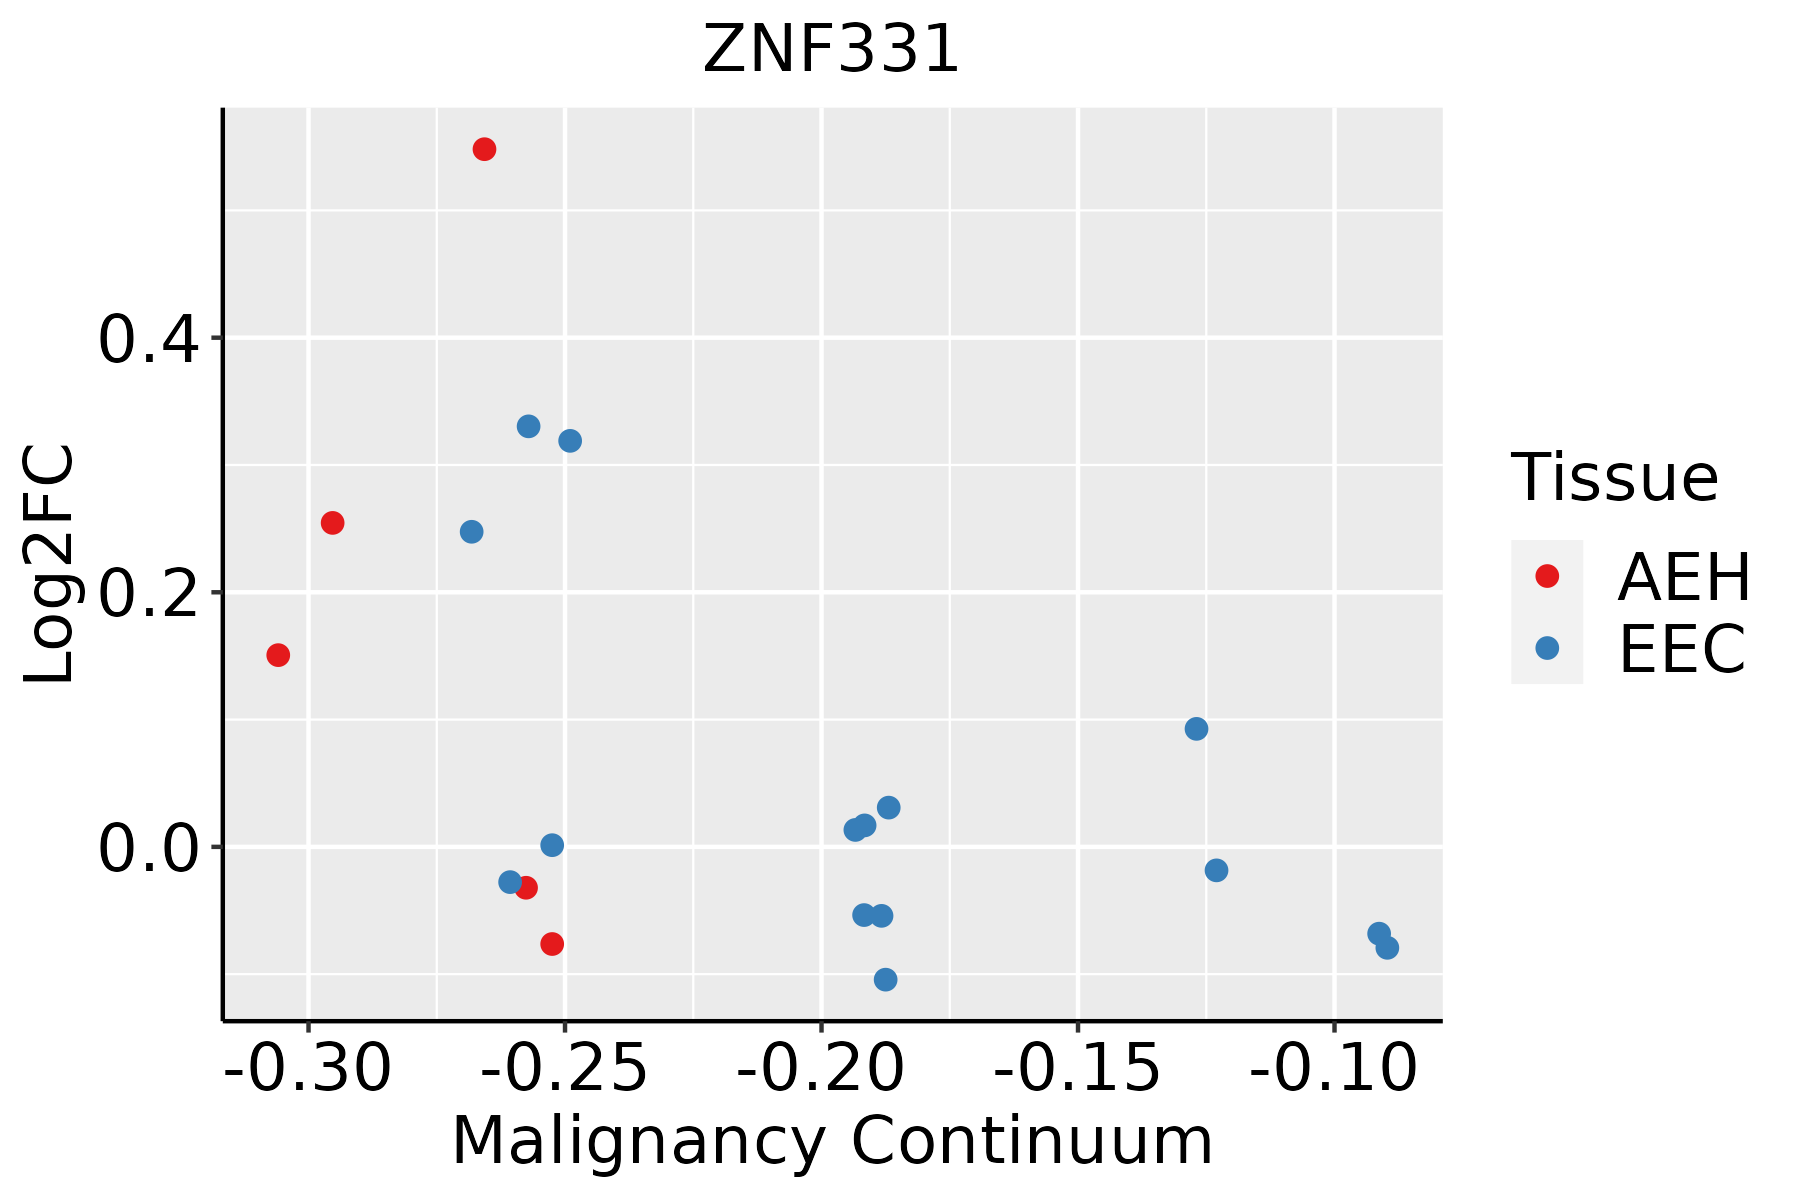 | AEH: Atypical endometrial hyperplasia |
| EEC: Endometrioid Cancer | ||
| Esophagus | 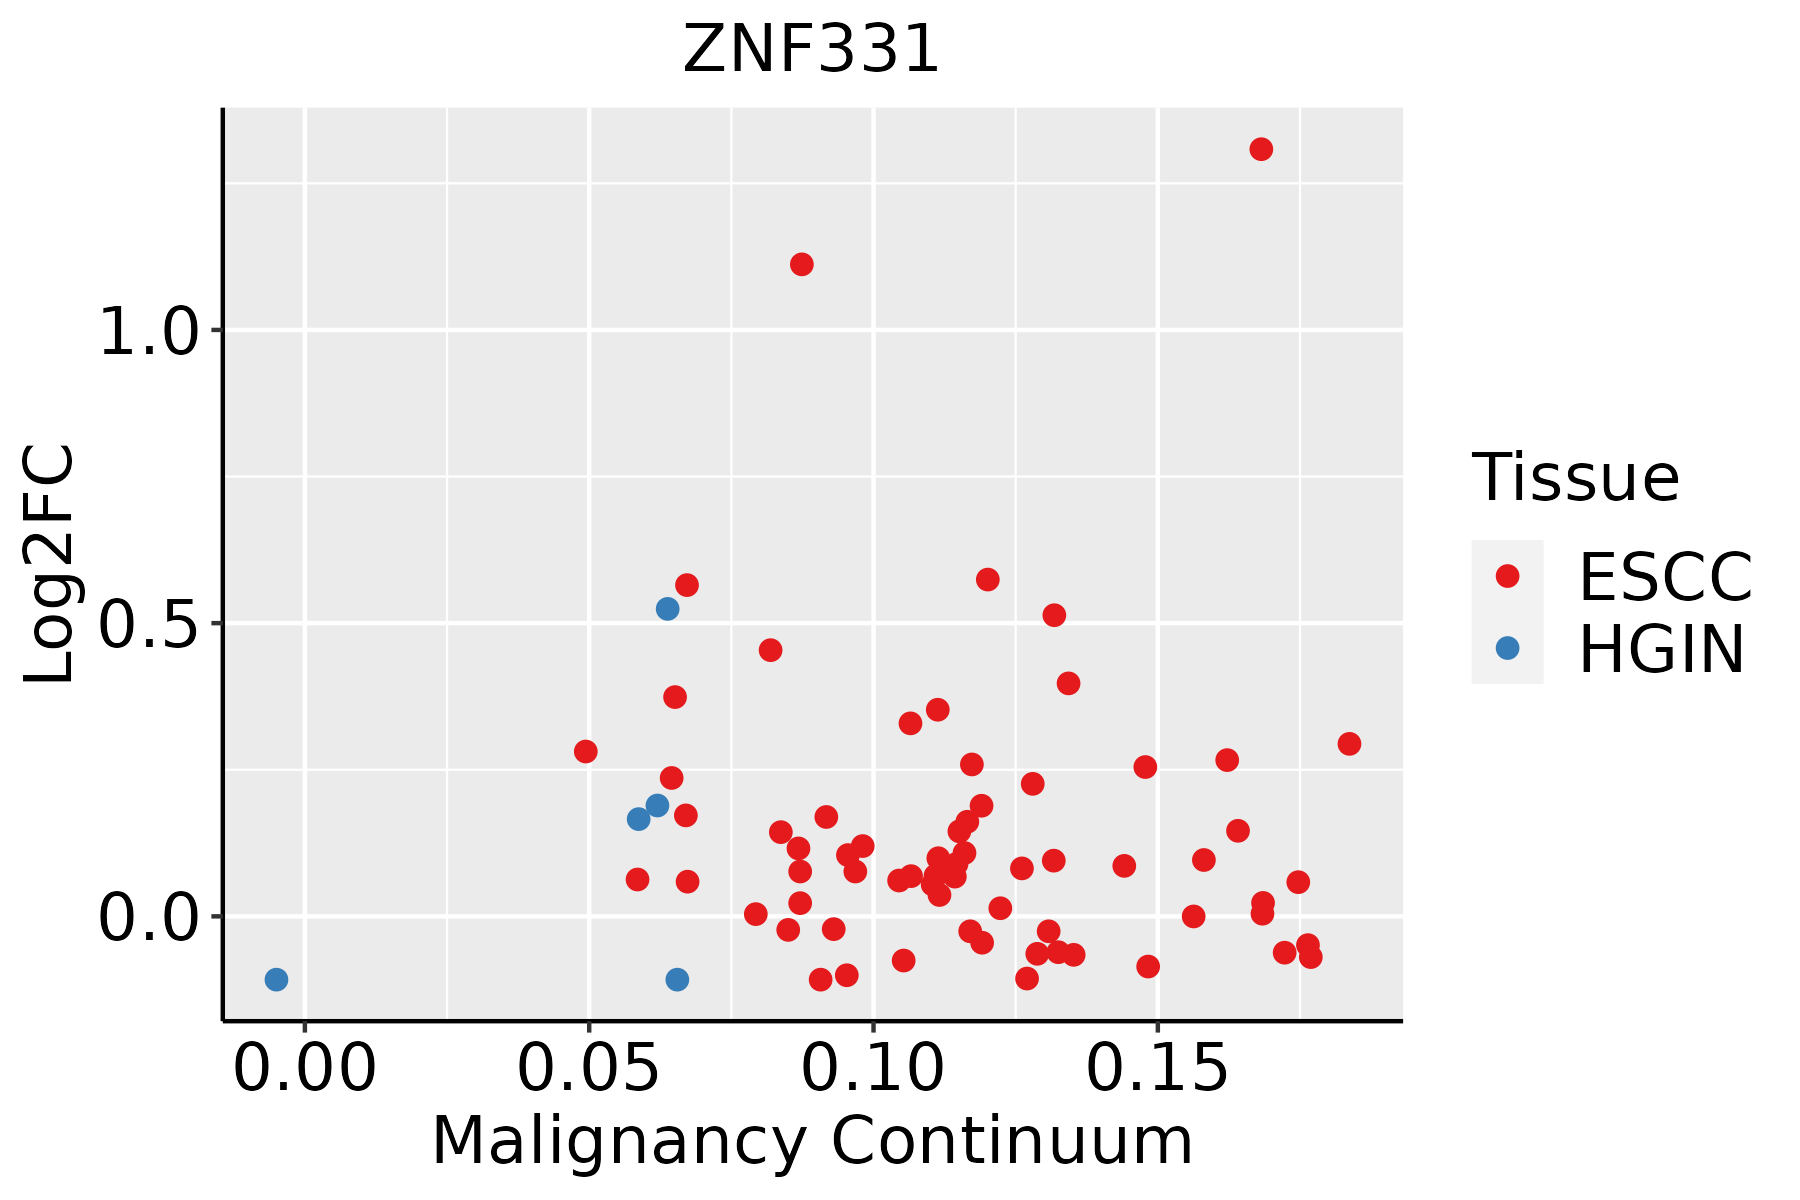 | ESCC: Esophageal squamous cell carcinoma |
| HGIN: High-grade intraepithelial neoplasias | ||
| LGIN: Low-grade intraepithelial neoplasias | ||
| Liver | 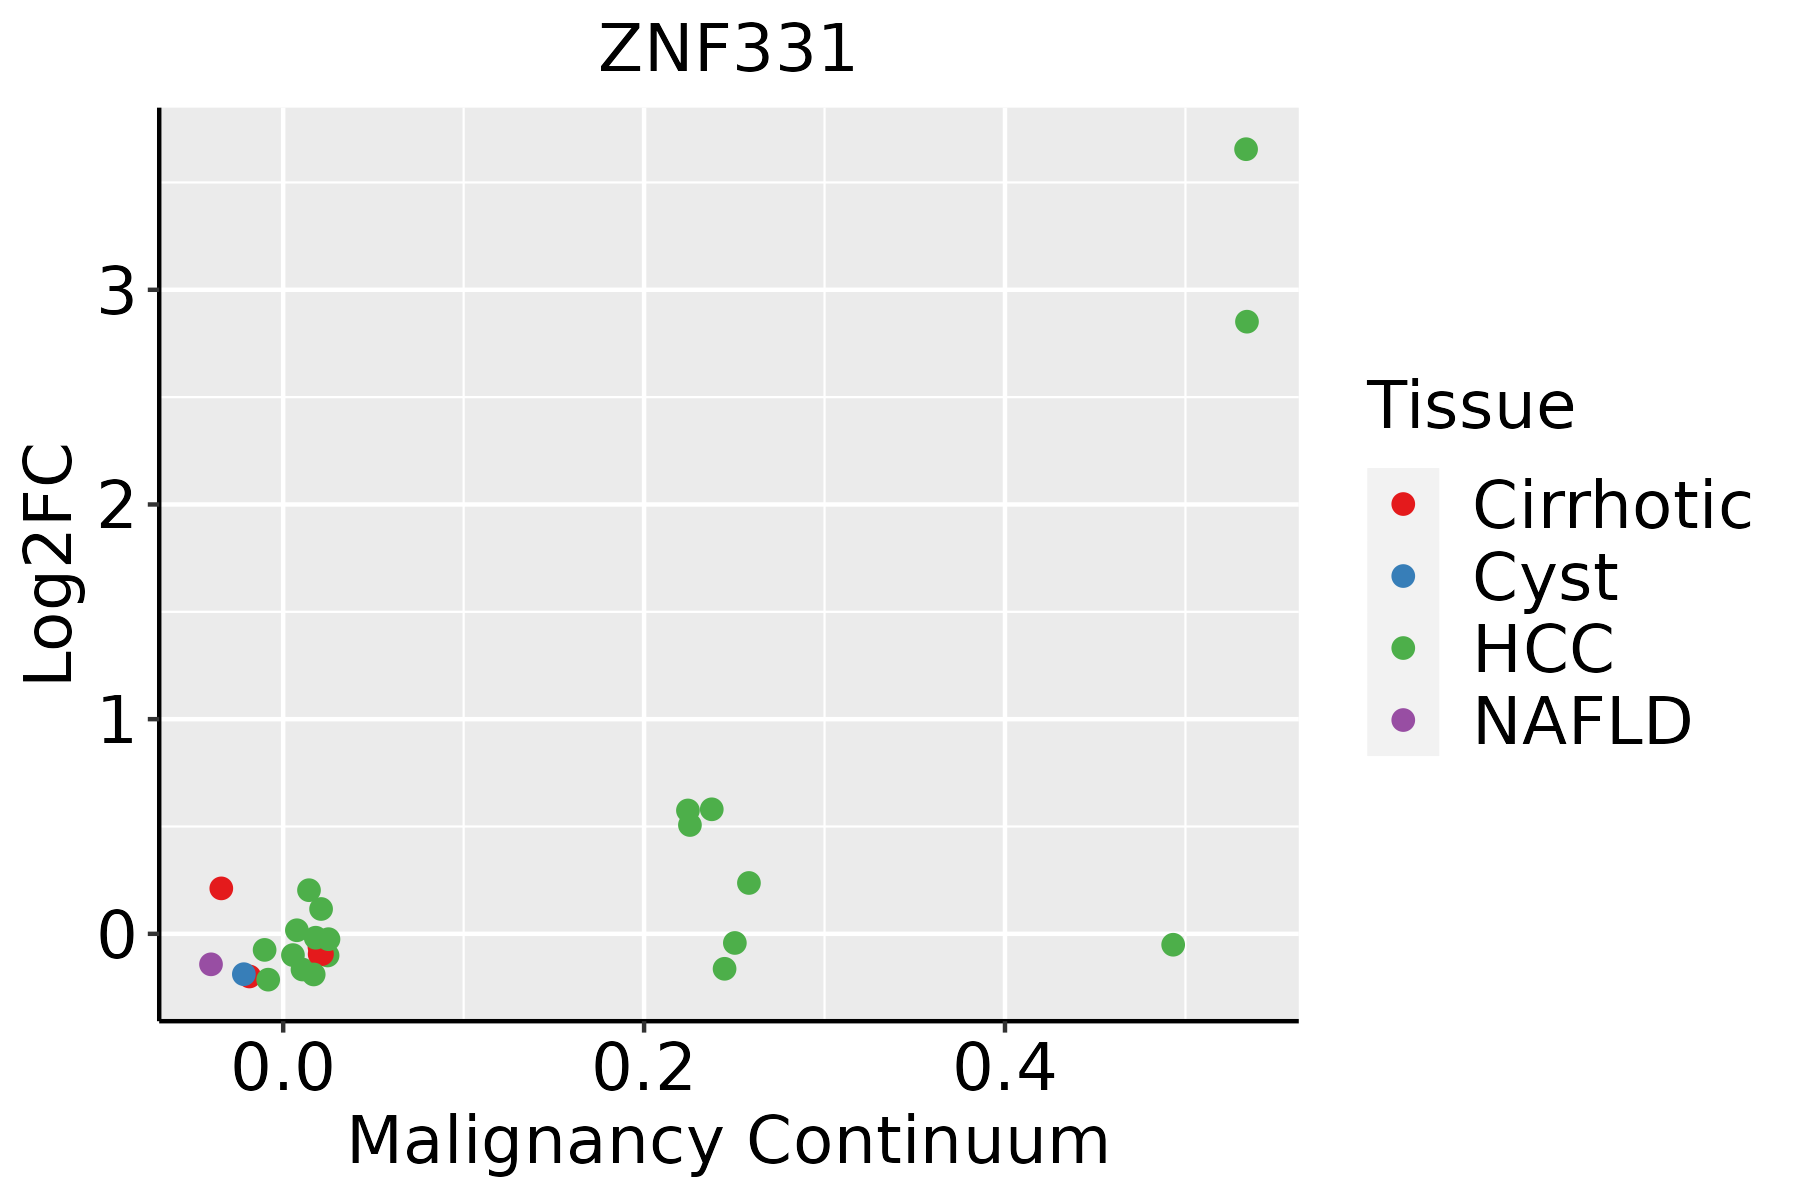 | HCC: Hepatocellular carcinoma |
| NAFLD: Non-alcoholic fatty liver disease | ||
| Oral Cavity | 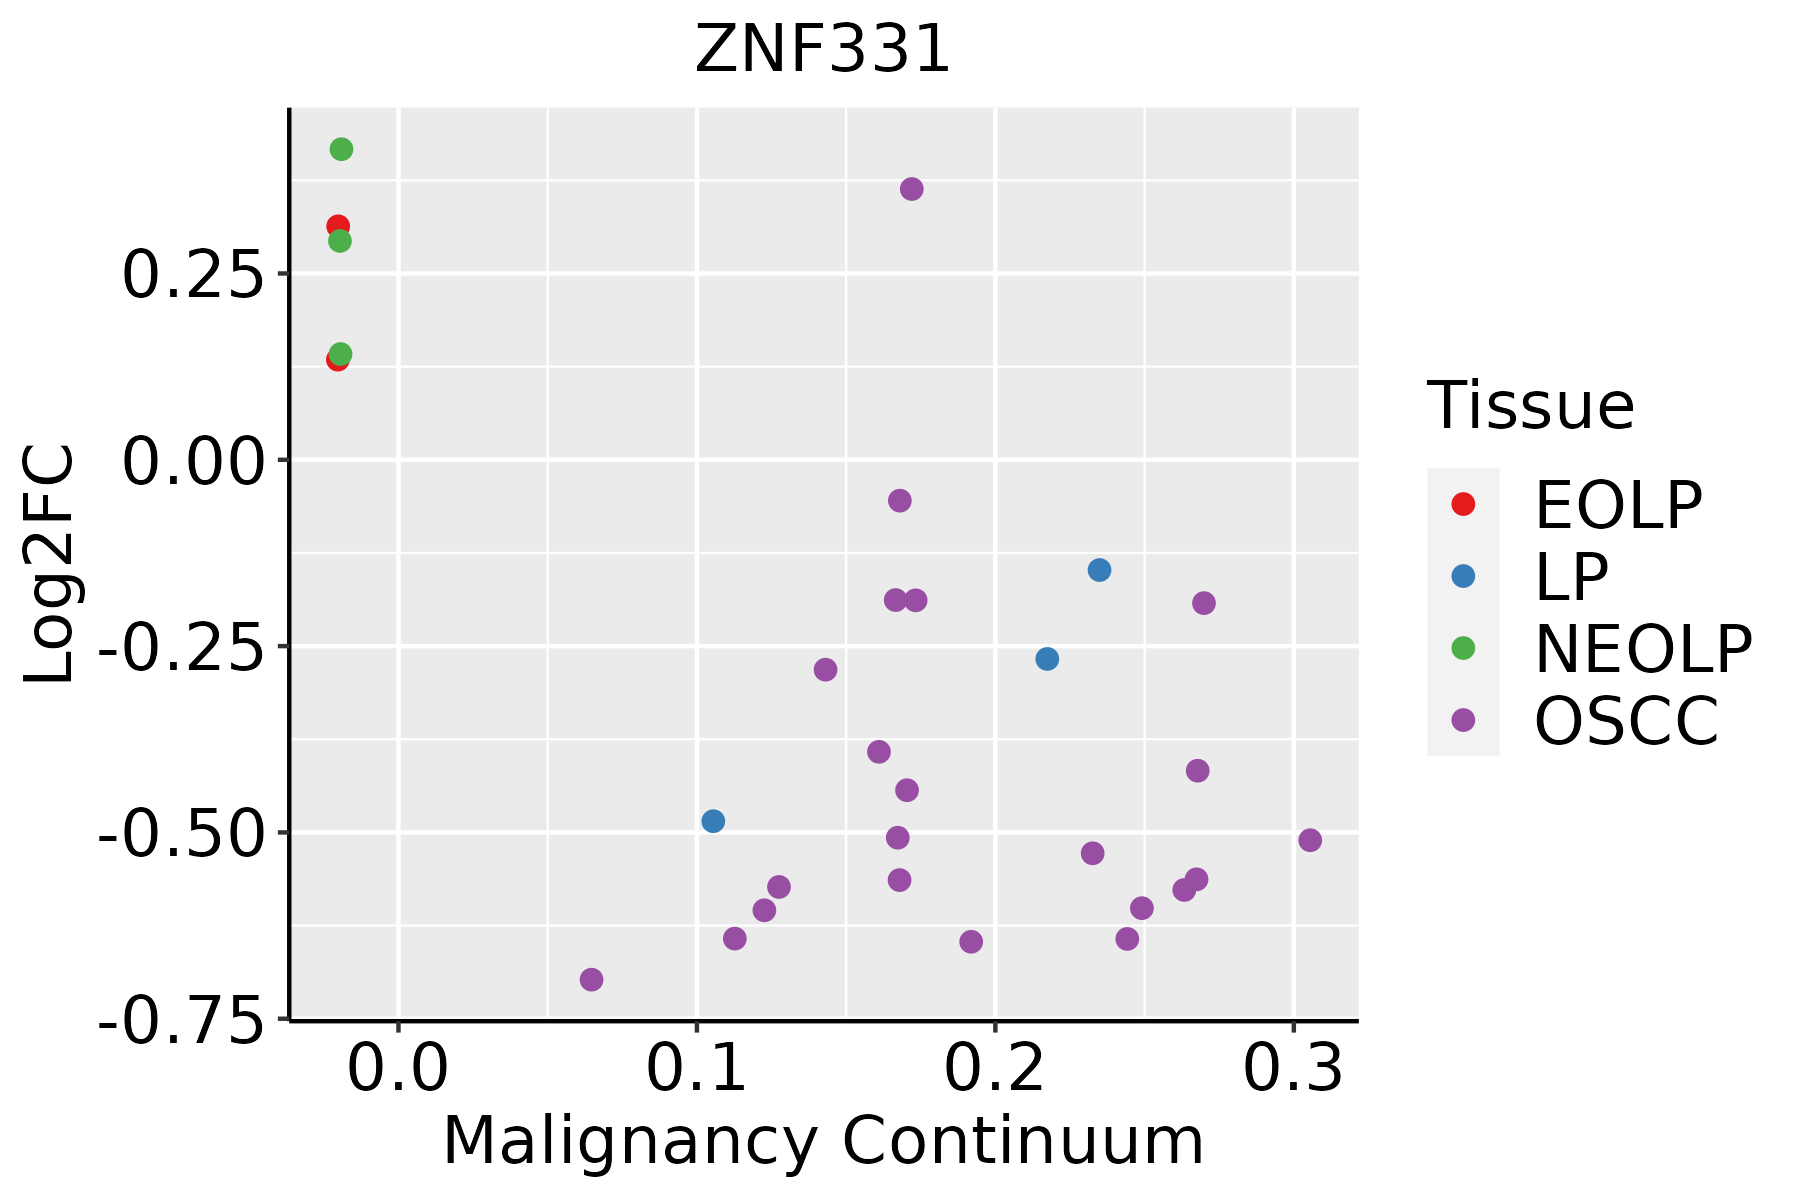 | EOLP: Erosive Oral lichen planus |
| LP: leukoplakia | ||
| NEOLP: Non-erosive oral lichen planus | ||
| OSCC: Oral squamous cell carcinoma | ||
| Prostate | 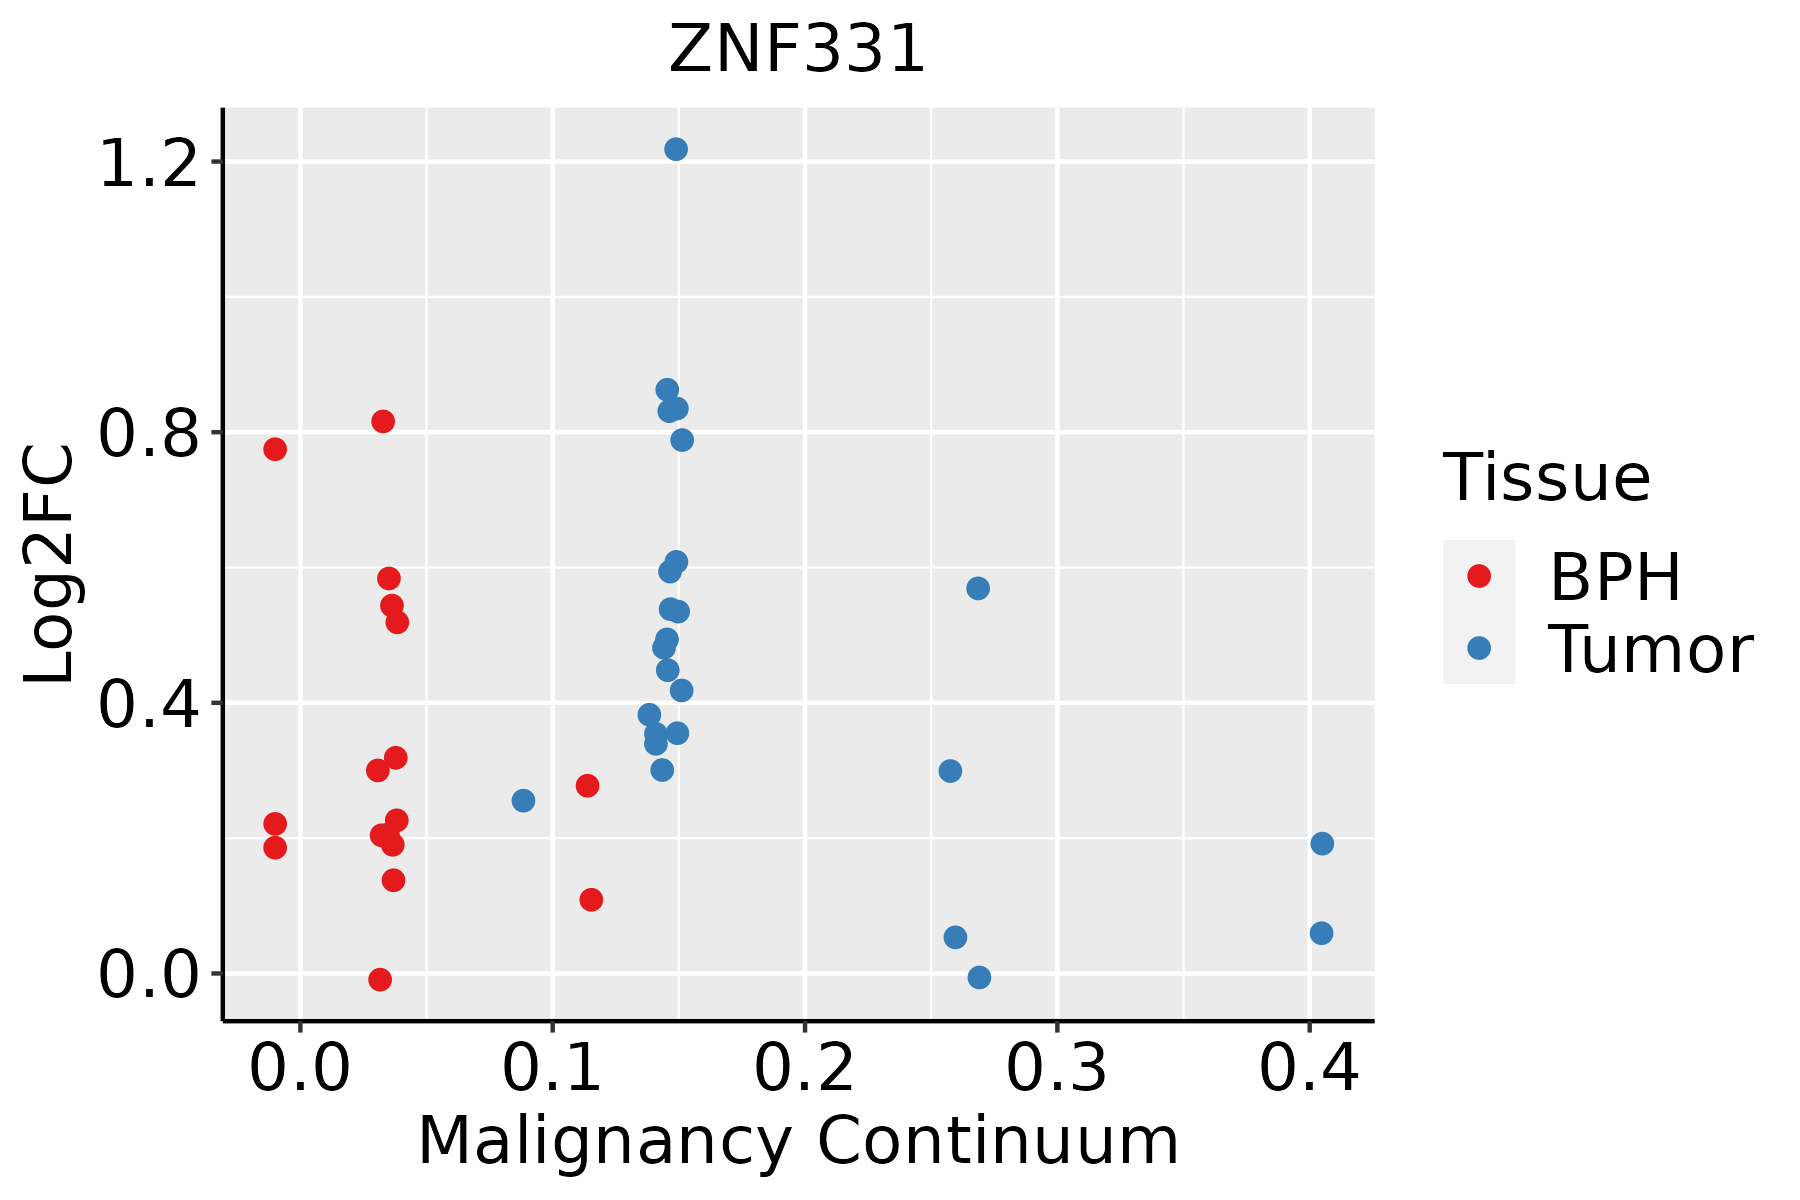 | BPH: Benign Prostatic Hyperplasia |
| Skin | 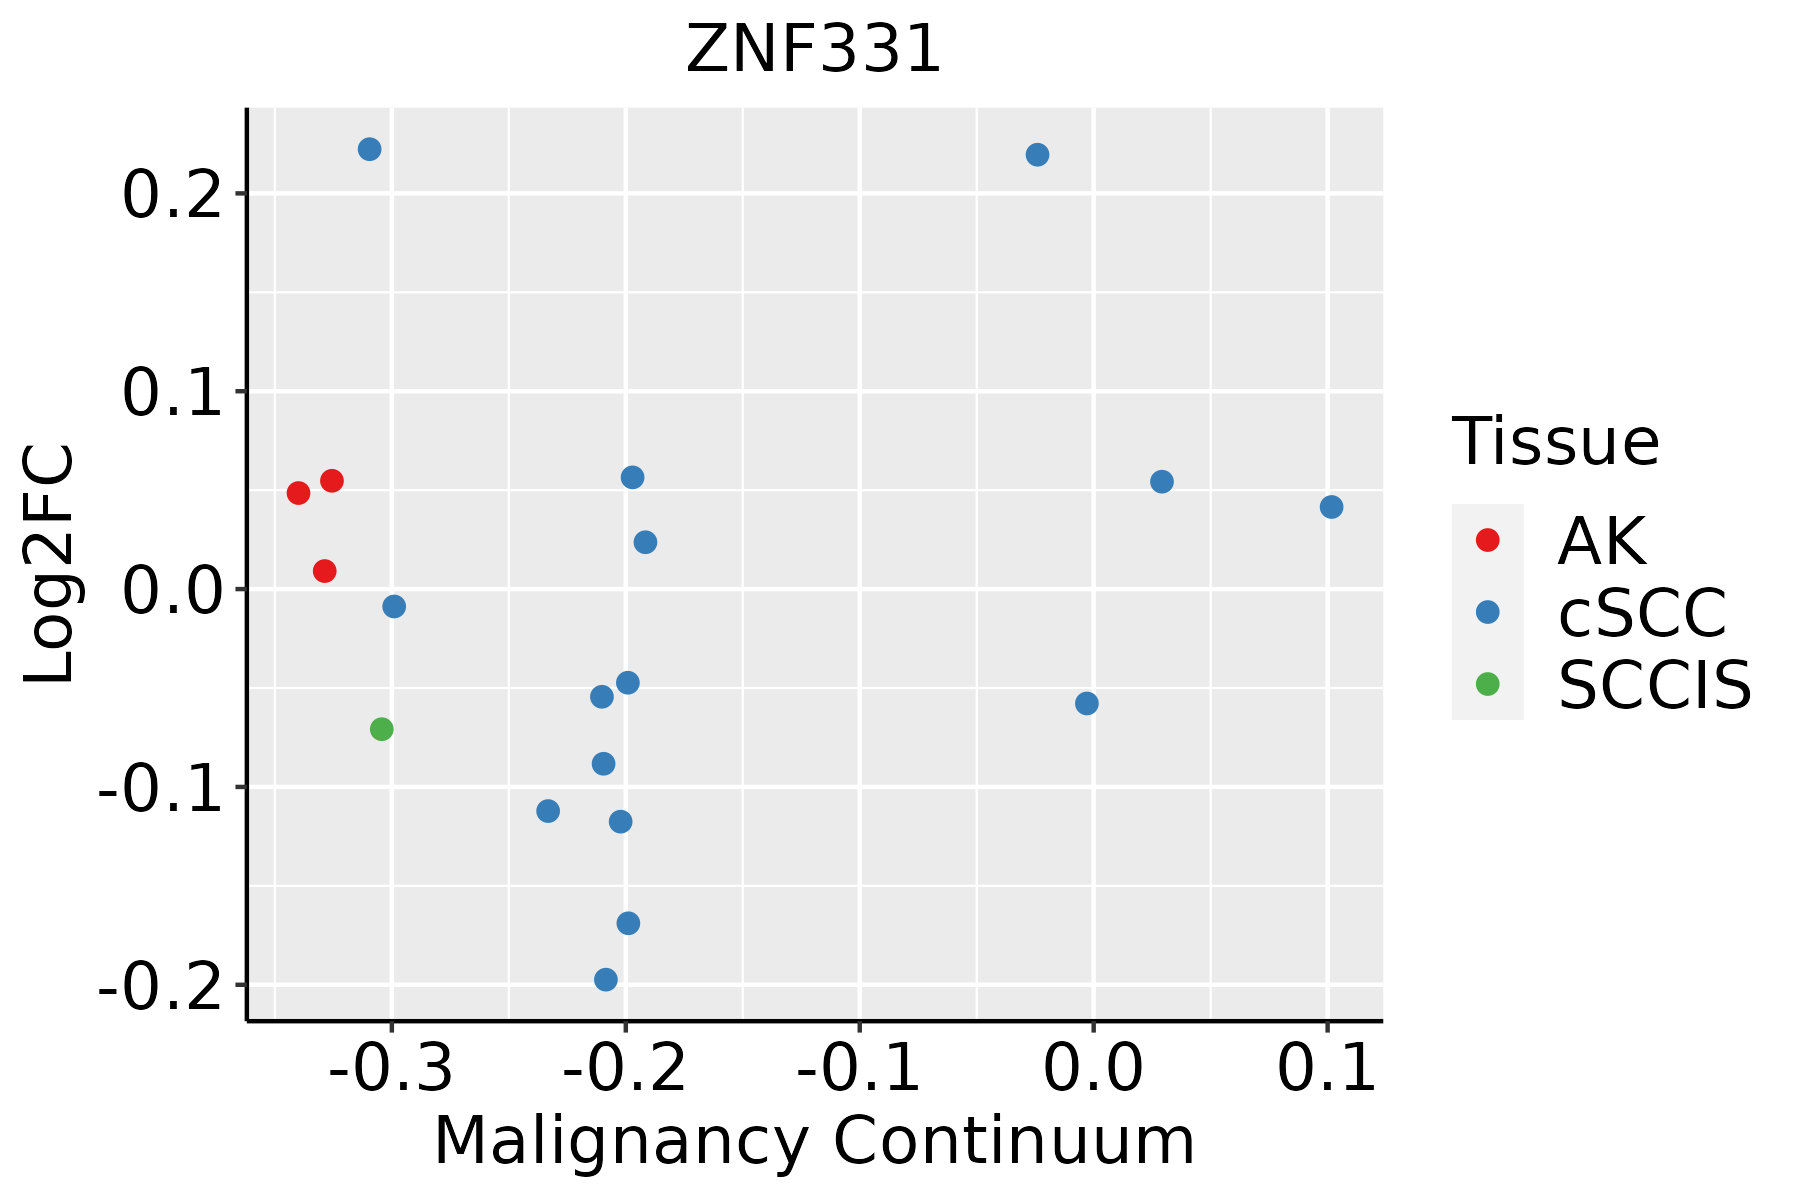 | AK: Actinic keratosis |
| cSCC: Cutaneous squamous cell carcinoma | ||
| SCCIS:squamous cell carcinoma in situ | ||
| Thyroid | 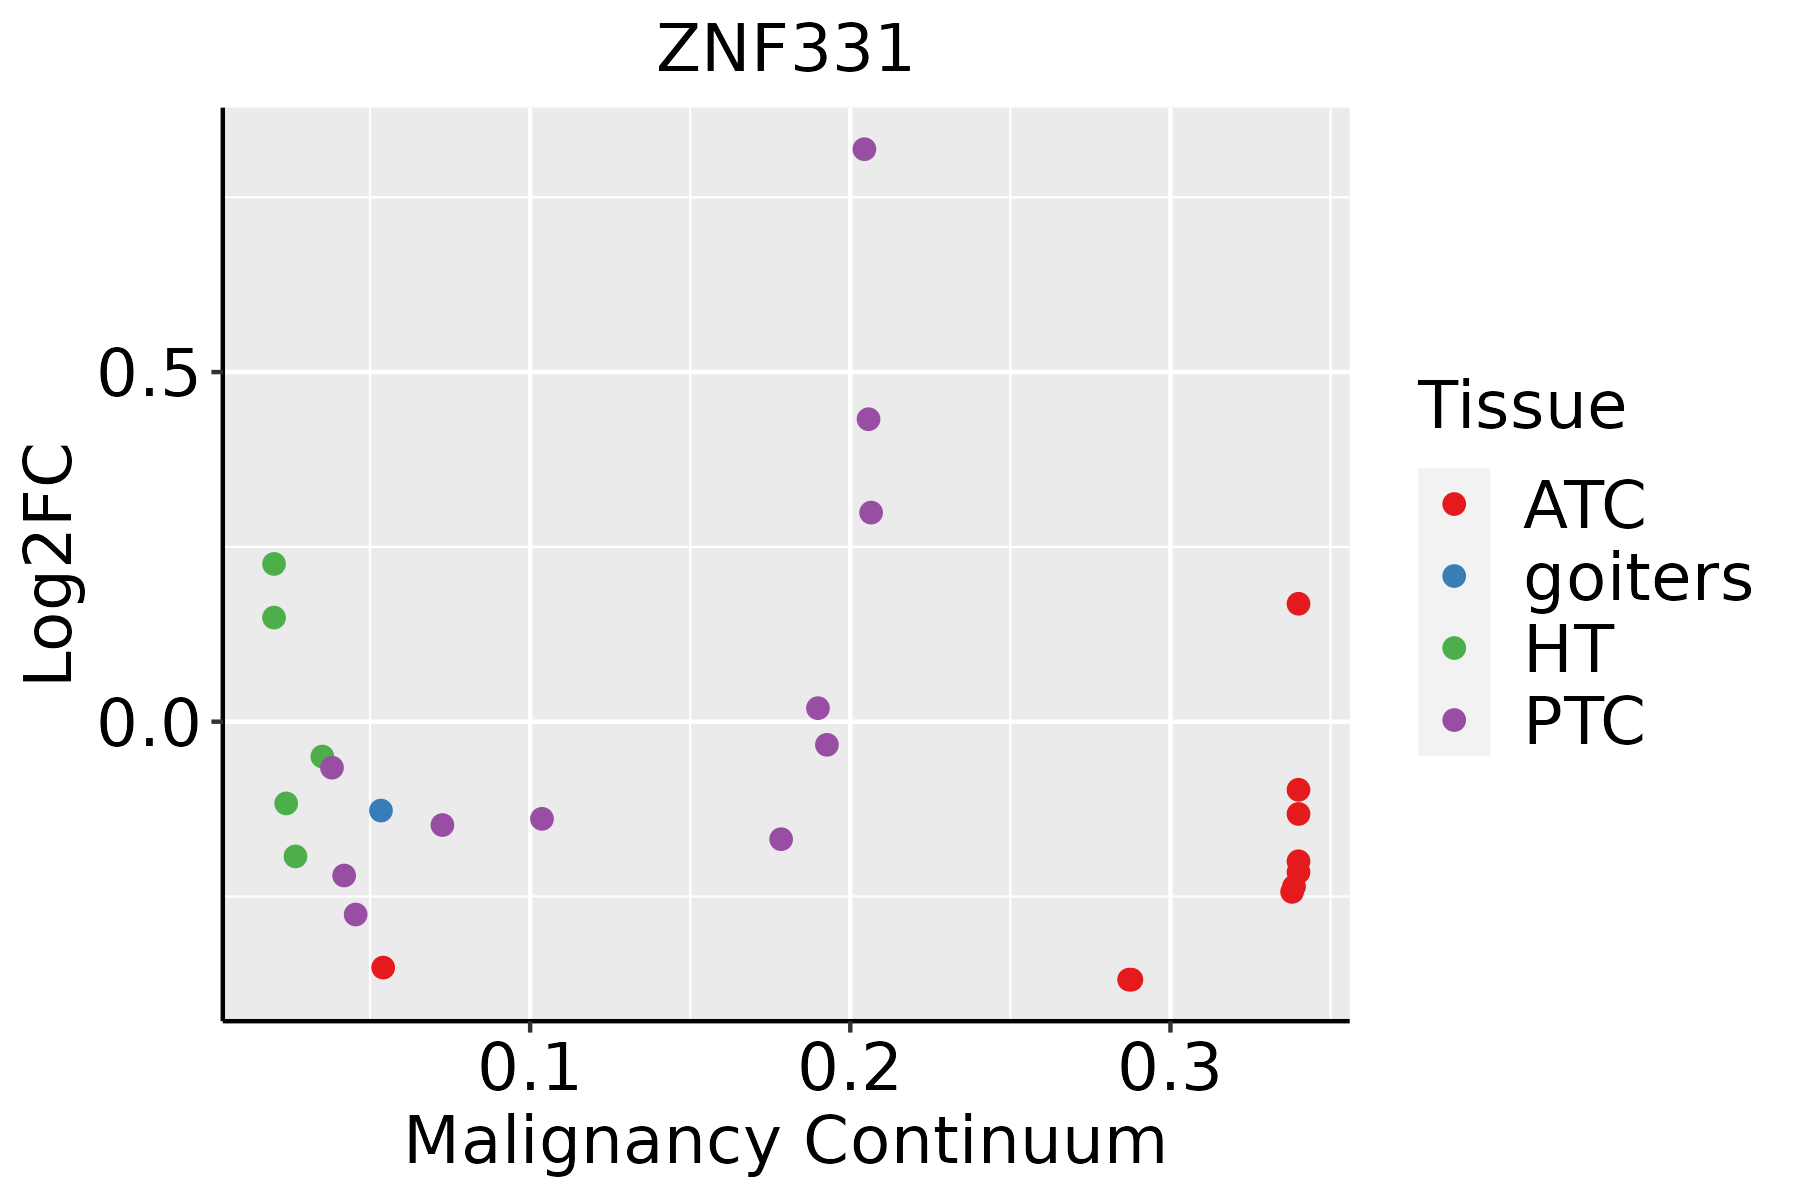 | ATC: Anaplastic thyroid cancer |
| HT: Hashimoto's thyroiditis | ||
| PTC: Papillary thyroid cancer |
| ∗log2FC in expression of this searched gene in stem-like cells from each diseased tissue sample relative to stem-like cells in normal samples in each tissue plotted against the malignancy continuum. Samples are colored based on if they are from different disease stage. |
Top |
Malignant transformation related pathway analysis |
| Find out the enriched GO biological processes and KEGG pathways involved in transition from healthy to precancer to cancer |
| Tissue | Disease Stage | Enriched GO biological Processes |
| Colorectum | AD |  |
| Colorectum | SER |  |
| Colorectum | MSS |  |
| Colorectum | MSI-H |  |
| Colorectum | FAP |  |
| ∗Top 15 enriched GO BP terms are showed in the bar plot of each disease state in each tissue. Each row represents a significant GO biological process which is colored according to the -log10(p.adjust). |
| Page: 1 2 3 4 5 6 7 8 9 |
| GO ID | Tissue | Disease Stage | Description | Gene Ratio | Bg Ratio | pvalue | p.adjust | Count |
| Page: 1 |
| Pathway ID | Tissue | Disease Stage | Description | Gene Ratio | Bg Ratio | pvalue | p.adjust | qvalue | Count |
| Page: 1 |
Top |
Cell-cell communication analysis |
| Identification of potential cell-cell interactions between two cell types and their ligand-receptor pairs for different disease states |
| Ligand | Receptor | LRpair | Pathway | Tissue | Disease Stage |
| Page: 1 |
Top |
Single-cell gene regulatory network inference analysis |
| Find out the significant the regulons (TFs) and the target genes of each regulon across cell types for different disease states |
| TF | Cell Type | Tissue | Disease Stage | Target Gene | RSS | Regulon Activity |
| ∗The dot plots of a searched regulon are shown for all cell subpopulations in each disease state of each tissue based on the regulon specific score inferred using pySCENIC and by calculating the average expression. |
| Page: 1 |
Top |
Somatic mutation of malignant transformation related genes |
| Annotation of somatic variants for genes involved in malignant transformation |
| Hugo Symbol | Variant Class | Variant Classification | dbSNP RS | HGVSc | HGVSp | HGVSp Short | SWISSPROT | BIOTYPE | SIFT | PolyPhen | Tumor Sample Barcode | Tissue | Histology | Sex | Age | Stage | Therapy Types | Drugs | Outcome |
| ZNF331 | SNV | Missense_Mutation | novel | c.1059N>T | p.Lys353Asn | p.K353N | Q9NQX6 | protein_coding | deleterious(0.01) | possibly_damaging(0.525) | TCGA-A7-A0DB-01 | Breast | breast invasive carcinoma | Female | <65 | I/II | Hormone Therapy | arimidex | SD |
| ZNF331 | SNV | Missense_Mutation | c.788N>T | p.Arg263Ile | p.R263I | Q9NQX6 | protein_coding | tolerated(0.06) | probably_damaging(0.999) | TCGA-FU-A3HZ-01 | Cervix | cervical & endocervical cancer | Female | <65 | I/II | Chemotherapy | cisplatin | CR | |
| ZNF331 | SNV | Missense_Mutation | novel | c.55G>A | p.Glu19Lys | p.E19K | Q9NQX6 | protein_coding | deleterious(0) | probably_damaging(0.992) | TCGA-JW-A5VJ-01 | Cervix | cervical & endocervical cancer | Female | <65 | I/II | Unknown | Unknown | PD |
| ZNF331 | SNV | Missense_Mutation | novel | c.9N>T | p.Gln3His | p.Q3H | Q9NQX6 | protein_coding | tolerated(0.83) | benign(0) | TCGA-VS-A9UJ-01 | Cervix | cervical & endocervical cancer | Female | <65 | I/II | Unknown | Unknown | PD |
| ZNF331 | SNV | Missense_Mutation | c.639N>C | p.Lys213Asn | p.K213N | Q9NQX6 | protein_coding | deleterious(0) | probably_damaging(0.983) | TCGA-A6-6780-01 | Colorectum | colon adenocarcinoma | Male | >=65 | I/II | Unknown | Unknown | SD | |
| ZNF331 | SNV | Missense_Mutation | c.673N>T | p.Arg225Trp | p.R225W | Q9NQX6 | protein_coding | tolerated(0.16) | probably_damaging(0.938) | TCGA-AA-3510-01 | Colorectum | colon adenocarcinoma | Male | >=65 | I/II | Unknown | Unknown | SD | |
| ZNF331 | SNV | Missense_Mutation | novel | c.751N>G | p.Thr251Ala | p.T251A | Q9NQX6 | protein_coding | tolerated(1) | benign(0.096) | TCGA-AA-3852-01 | Colorectum | colon adenocarcinoma | Male | >=65 | I/II | Unknown | Unknown | PD |
| ZNF331 | SNV | Missense_Mutation | c.1022N>A | p.Ser341Asn | p.S341N | Q9NQX6 | protein_coding | tolerated(0.28) | possibly_damaging(0.607) | TCGA-AA-A01D-01 | Colorectum | colon adenocarcinoma | Female | <65 | III/IV | Chemotherapy | capecitabine | PD | |
| ZNF331 | SNV | Missense_Mutation | novel | c.994N>C | p.Cys332Arg | p.C332R | Q9NQX6 | protein_coding | deleterious(0) | probably_damaging(0.999) | TCGA-AZ-4315-01 | Colorectum | colon adenocarcinoma | Male | <65 | I/II | Unknown | Unknown | SD |
| ZNF331 | SNV | Missense_Mutation | c.1073N>A | p.Thr358Lys | p.T358K | Q9NQX6 | protein_coding | tolerated(1) | benign(0.006) | TCGA-CA-6716-01 | Colorectum | colon adenocarcinoma | Male | >=65 | I/II | Chemotherapy | oxaliplatin | CR |
| Page: 1 2 3 4 5 6 7 8 9 |
Top |
Related drugs of malignant transformation related genes |
| Identification of chemicals and drugs interact with genes involved in malignant transfromation |
| (DGIdb 4.0) |
| Entrez ID | Symbol | Category | Interaction Types | Drug Claim Name | Drug Name | PMIDs |
| Page: 1 |

Copyright 2023-Present -The University of Texas Health Science Center at Houston |