Schematic overview of the cellular and molecular mechanisms involved in the cancer progression, including the proposed cellular and molecular mechanisms in cancer cells trajectory. AT1: alveolar type 1 cells; AT2: alveolar type 2 cells; AAH: atypical adenomatous hyperplasia; AIS: adenocarcinoma in situ; MIA: minimally invasive adenocarcinoma; IA: invasive adenocarcinoma; EMT: epithelial-mesenchymal transition

Home

Download

Statistics

Help

Contact

Center for Computational Systems Medicine
leaf

Gene summary

leaf

Malignant transformation analysis

leaf

Malignant transformation related pathway analysis

leaf

Cell-cell communication analysis

leaf

Single-cell gene regulatory network inference analysis

leaf

Somatic mutation of malignant transformation related genes

leaf

Related drugs of malignant transformation related genes

Gene: ZNF326

Gene summary for ZNF326

check button Gene summary.

Gene informationSpeciesHuman
Gene symbol

ZNF326

Gene ID

284695

Gene namezinc finger protein 326
Gene AliasZAN75
Cytomap1p22.2
Gene Typeprotein-coding
GO ID

GO:0006139

UniProtAcc

A0A0A0MRN4


Top

Malignant transformation analysis

check button Identification of the aberrant gene expression in precancerous and cancerous lesions by comparing the gene expression of stem-like cells in diseased tissues with normal stem cells
check button Malignant transformation involving gene list.
Entrez IDSymbolReplicatesSpeciesOrganTissueAdj P-valueLog2FCMalignancy
284695ZNF326LZE2THumanEsophagusESCC3.54e-025.03e-010.082
284695ZNF326LZE4THumanEsophagusESCC2.45e-135.95e-010.0811
284695ZNF326LZE5THumanEsophagusESCC1.39e-024.81e-010.0514
284695ZNF326LZE7THumanEsophagusESCC2.92e-067.54e-010.0667
284695ZNF326LZE8THumanEsophagusESCC7.37e-132.37e-010.067
284695ZNF326LZE20THumanEsophagusESCC3.14e-134.28e-010.0662
284695ZNF326LZE24THumanEsophagusESCC1.41e-145.20e-010.0596
284695ZNF326LZE6THumanEsophagusESCC1.76e-021.02e-010.0845
284695ZNF326P1T-EHumanEsophagusESCC2.96e-086.65e-010.0875
284695ZNF326P2T-EHumanEsophagusESCC1.01e-481.06e+000.1177
284695ZNF326P4T-EHumanEsophagusESCC4.23e-328.51e-010.1323
284695ZNF326P5T-EHumanEsophagusESCC1.25e-246.96e-010.1327
284695ZNF326P8T-EHumanEsophagusESCC1.05e-336.70e-010.0889
284695ZNF326P9T-EHumanEsophagusESCC6.74e-154.24e-010.1131
284695ZNF326P10T-EHumanEsophagusESCC9.61e-559.80e-010.116
284695ZNF326P11T-EHumanEsophagusESCC1.52e-178.43e-010.1426
284695ZNF326P12T-EHumanEsophagusESCC1.20e-912.15e+000.1122
284695ZNF326P15T-EHumanEsophagusESCC5.24e-307.55e-010.1149
284695ZNF326P16T-EHumanEsophagusESCC3.92e-376.57e-010.1153
284695ZNF326P17T-EHumanEsophagusESCC4.11e-094.36e-010.1278
Page: 1 2 3 4 5 6 

check button Transcriptomic changes along malignancy continuum.
TissueExpression DynamicsAbbreviation
EsophagusThe image shows the transcriptomic changes along malignancy continuum.log2FC in expression of this searched gene in stem-like cells from each diseased tissue sample relative to stem-like cells in normal samples in each tissue plotted against the malignancy continuum. Samples are colored based on if they are from different disease stage.ESCC: Esophageal squamous cell carcinoma
HGIN: High-grade intraepithelial neoplasias
LGIN: Low-grade intraepithelial neoplasias
LiverThe image shows the transcriptomic changes along malignancy continuum.log2FC in expression of this searched gene in stem-like cells from each diseased tissue sample relative to stem-like cells in normal samples in each tissue plotted against the malignancy continuum. Samples are colored based on if they are from different disease stage.
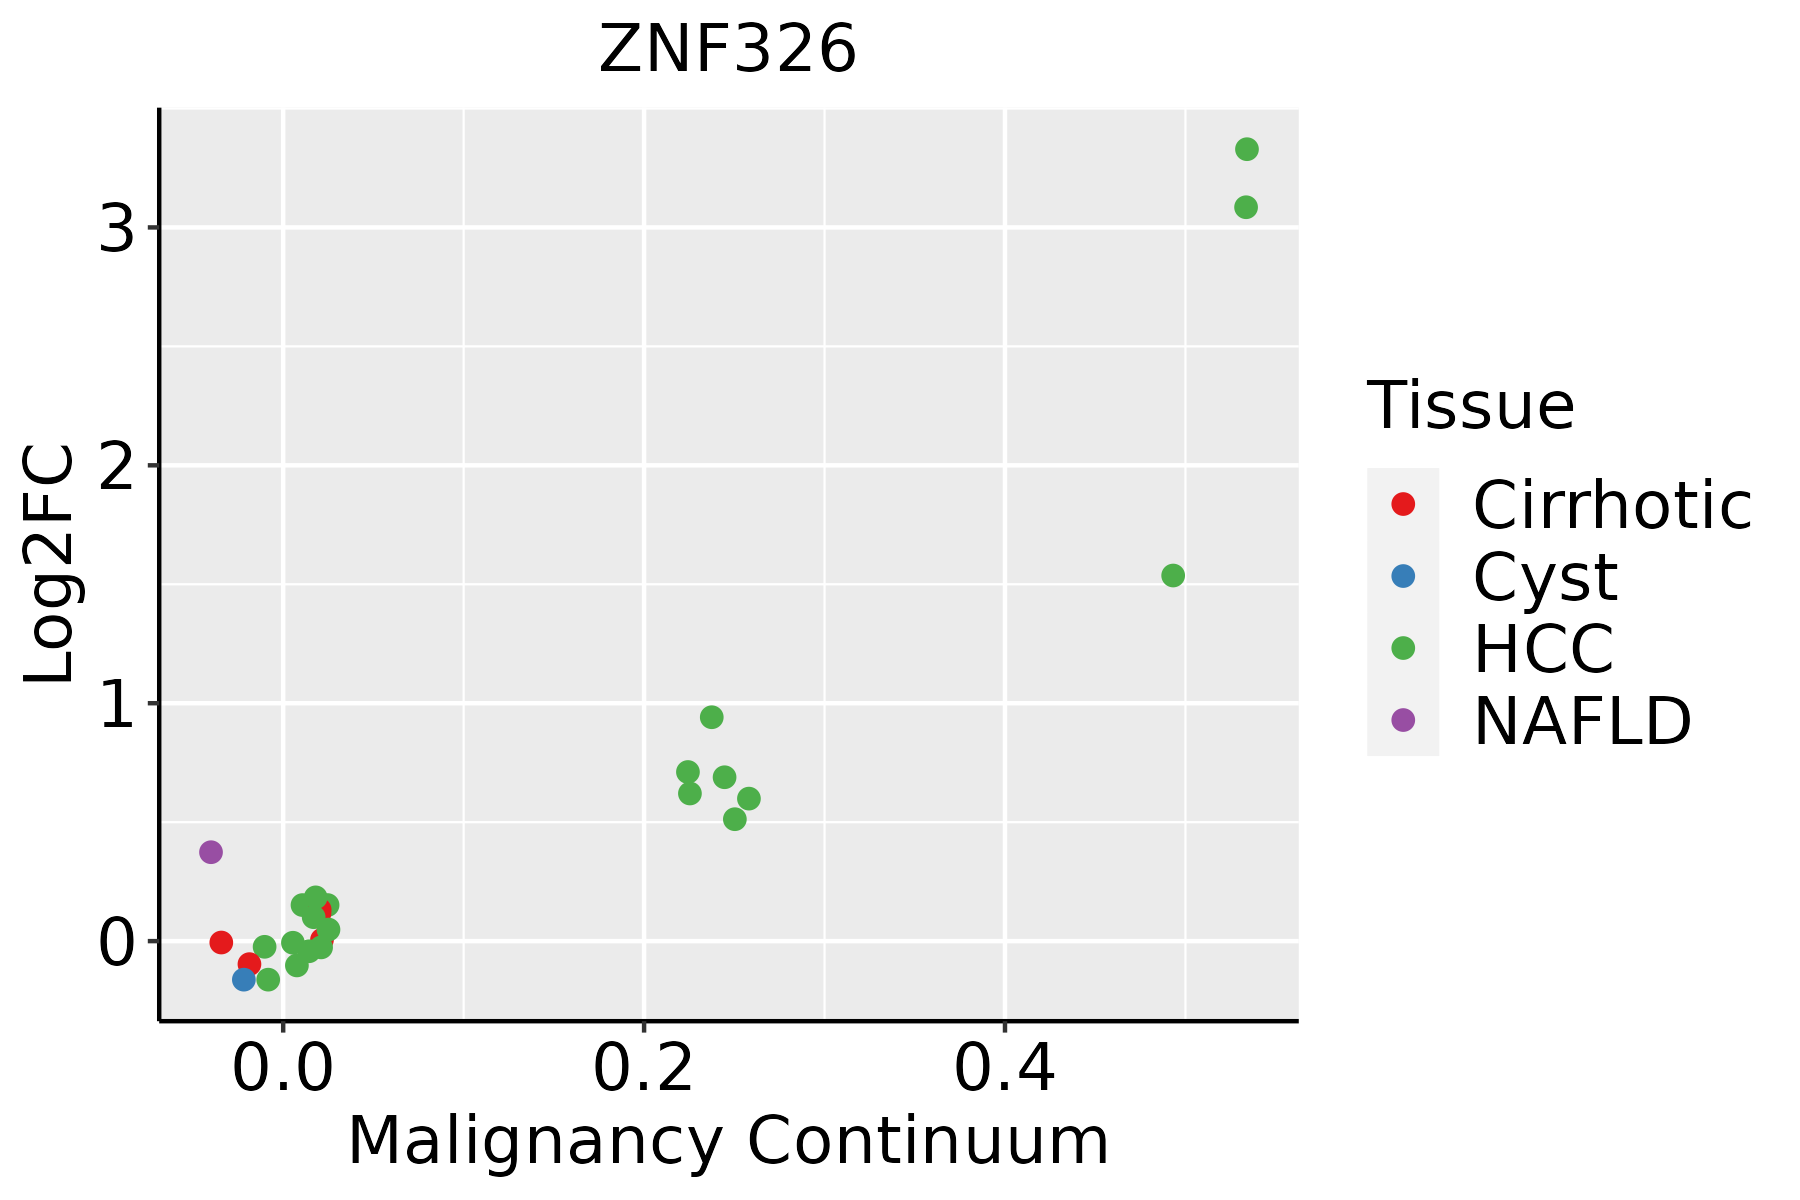
HCC: Hepatocellular carcinoma
NAFLD: Non-alcoholic fatty liver disease
LungThe image shows the transcriptomic changes along malignancy continuum.log2FC in expression of this searched gene in stem-like cells from each diseased tissue sample relative to stem-like cells in normal samples in each tissue plotted against the malignancy continuum. Samples are colored based on if they are from different disease stage.
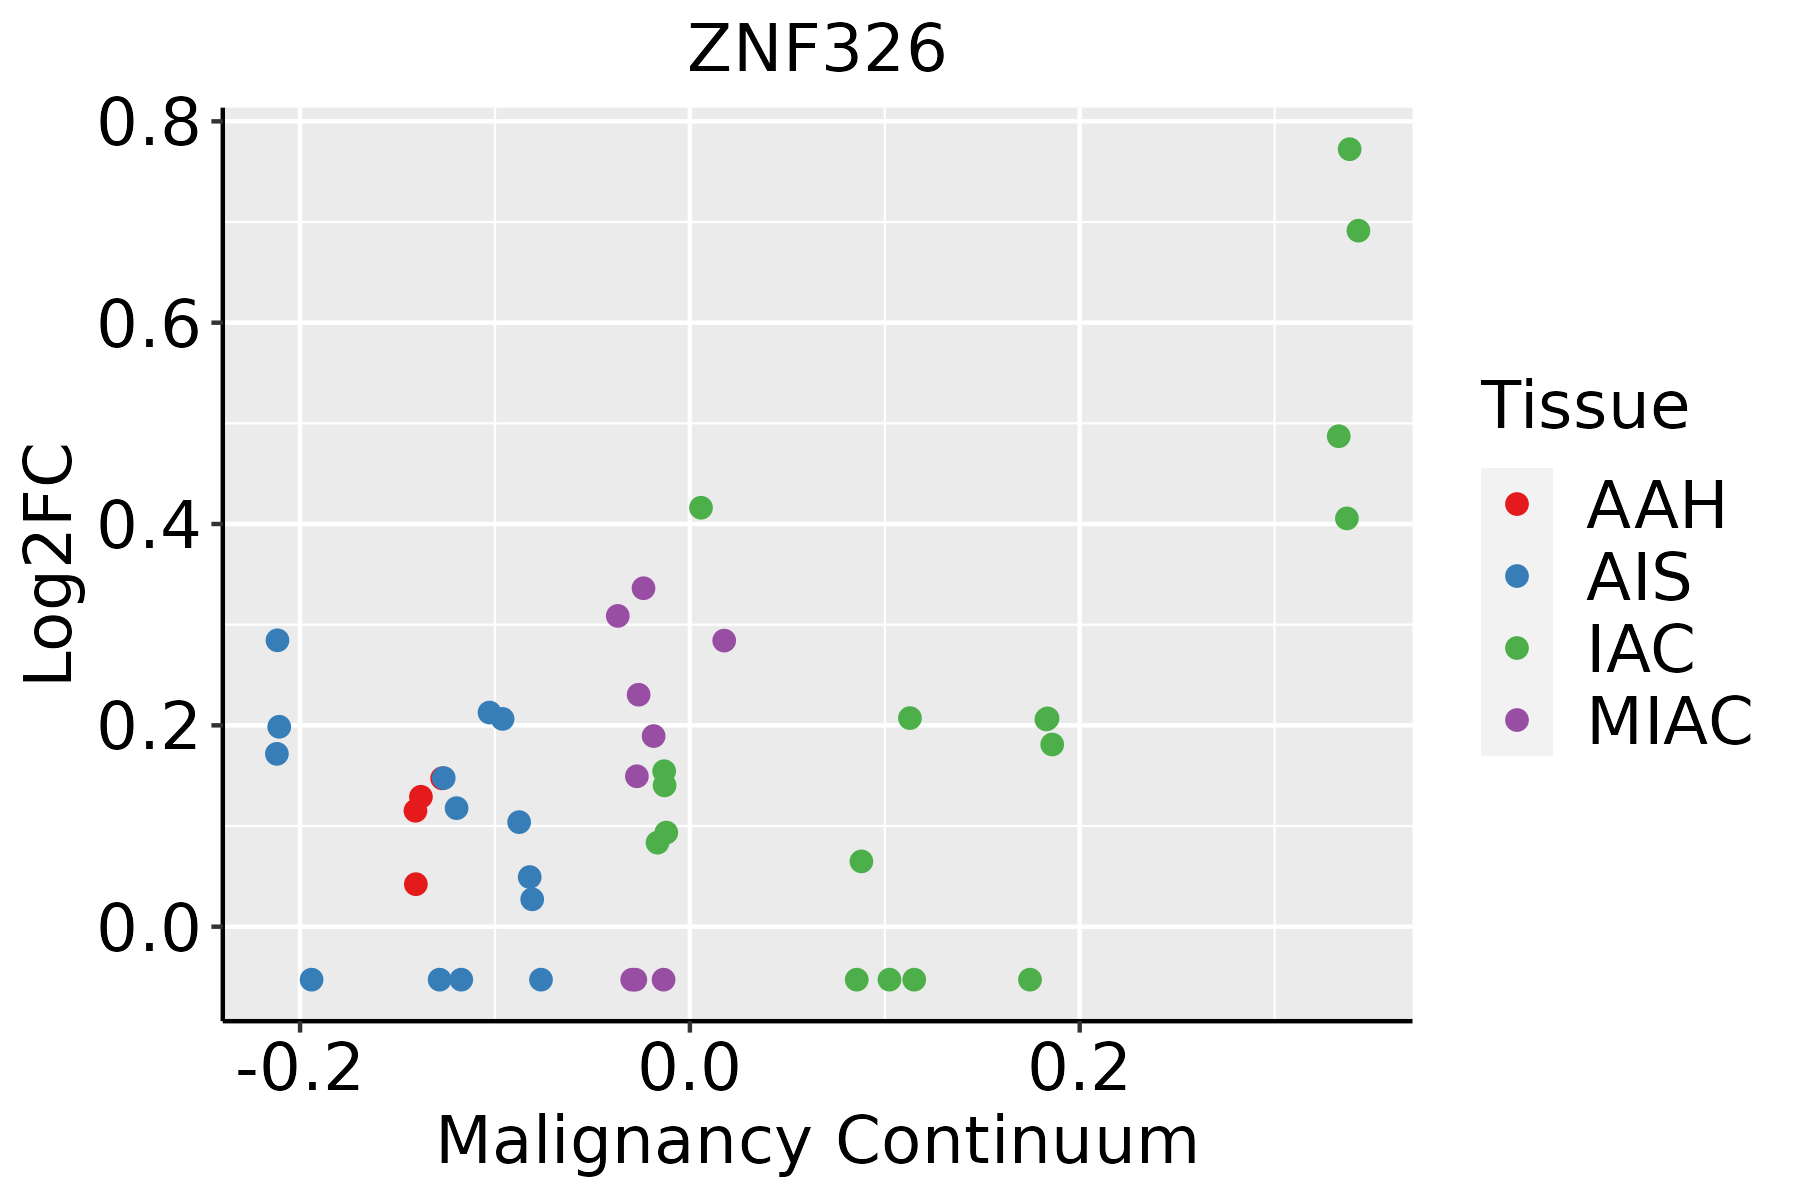
AAH: Atypical adenomatous hyperplasia
AIS: Adenocarcinoma in situ
IAC: Invasive lung adenocarcinoma
MIA: Minimally invasive adenocarcinoma
Oral CavityThe image shows the transcriptomic changes along malignancy continuum.log2FC in expression of this searched gene in stem-like cells from each diseased tissue sample relative to stem-like cells in normal samples in each tissue plotted against the malignancy continuum. Samples are colored based on if they are from different disease stage.EOLP: Erosive Oral lichen planus
LP: leukoplakia
NEOLP: Non-erosive oral lichen planus
OSCC: Oral squamous cell carcinoma
SkinThe image shows the transcriptomic changes along malignancy continuum.log2FC in expression of this searched gene in stem-like cells from each diseased tissue sample relative to stem-like cells in normal samples in each tissue plotted against the malignancy continuum. Samples are colored based on if they are from different disease stage.
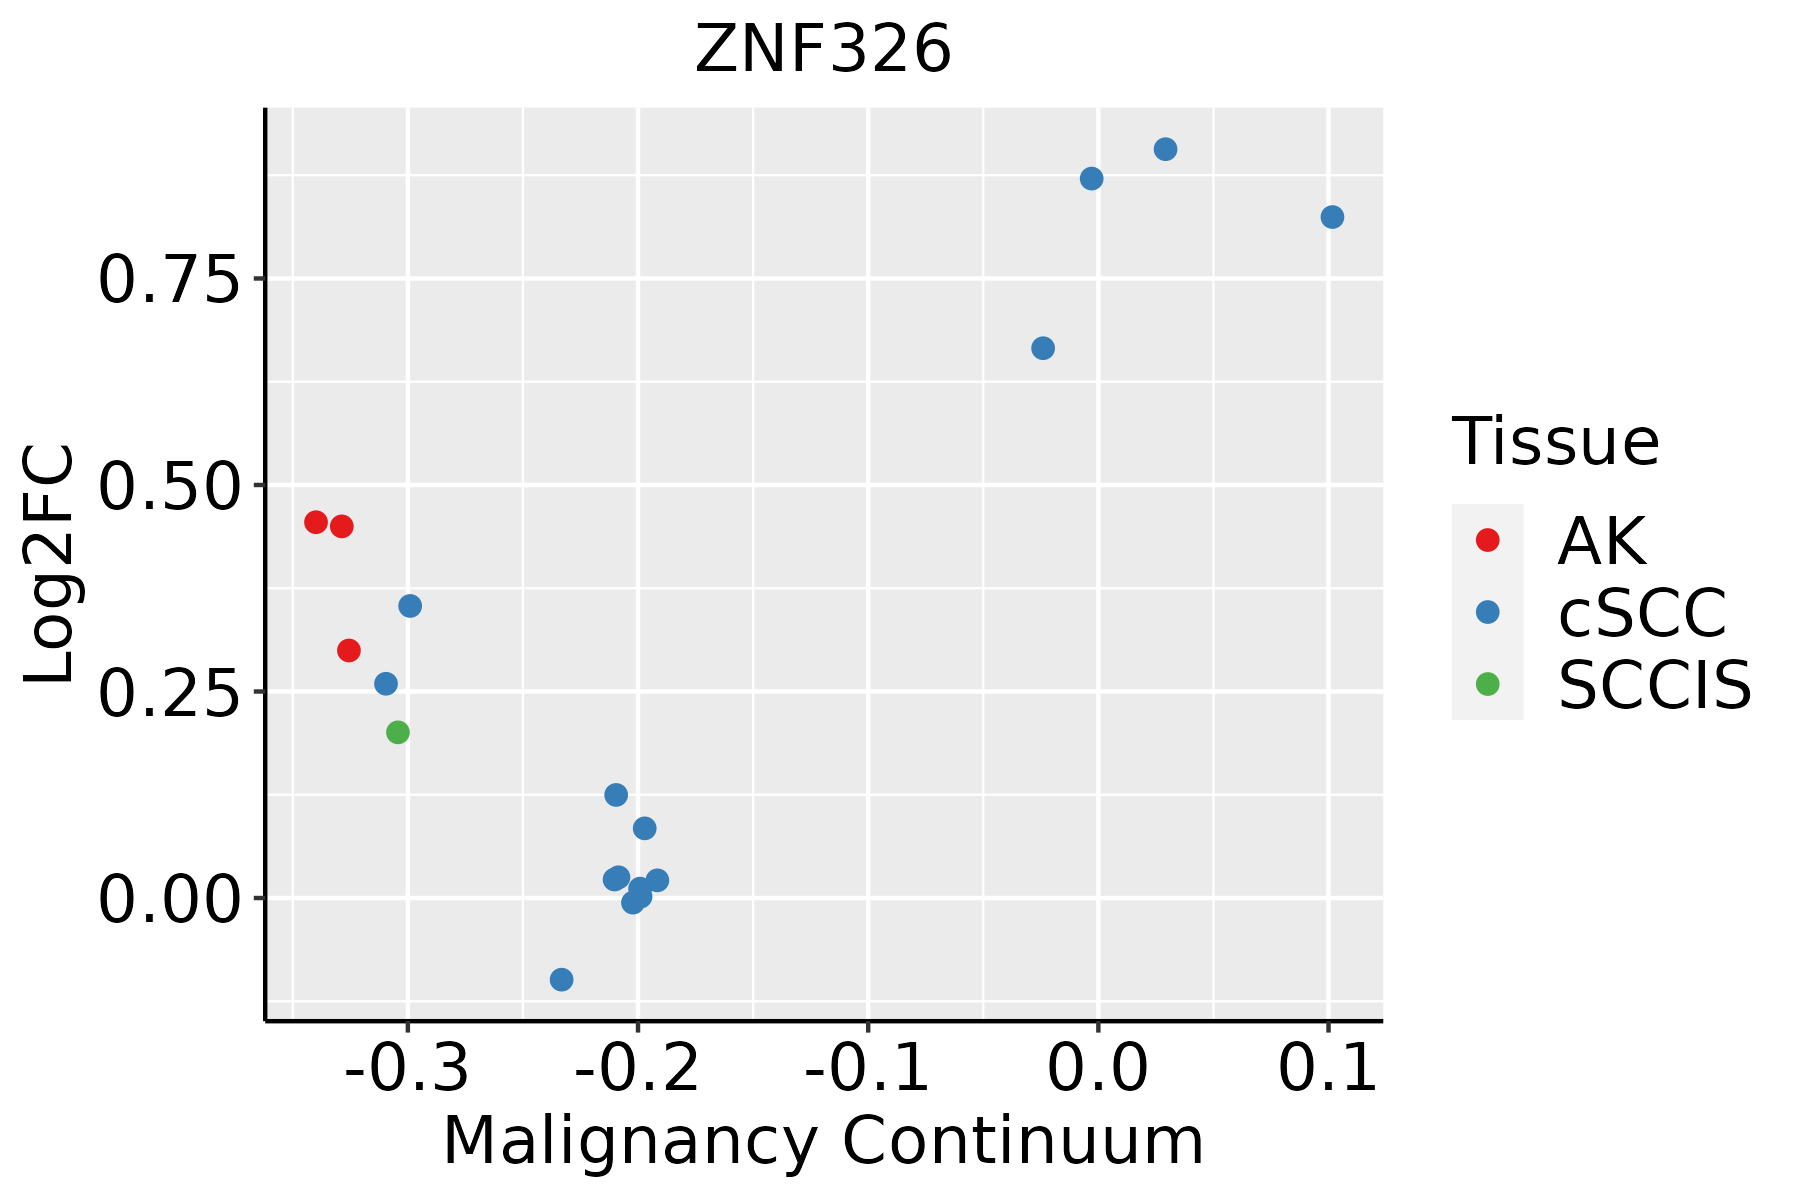
AK: Actinic keratosis
cSCC: Cutaneous squamous cell carcinoma
SCCIS:squamous cell carcinoma in situ
ThyroidThe image shows the transcriptomic changes along malignancy continuum.log2FC in expression of this searched gene in stem-like cells from each diseased tissue sample relative to stem-like cells in normal samples in each tissue plotted against the malignancy continuum. Samples are colored based on if they are from different disease stage.
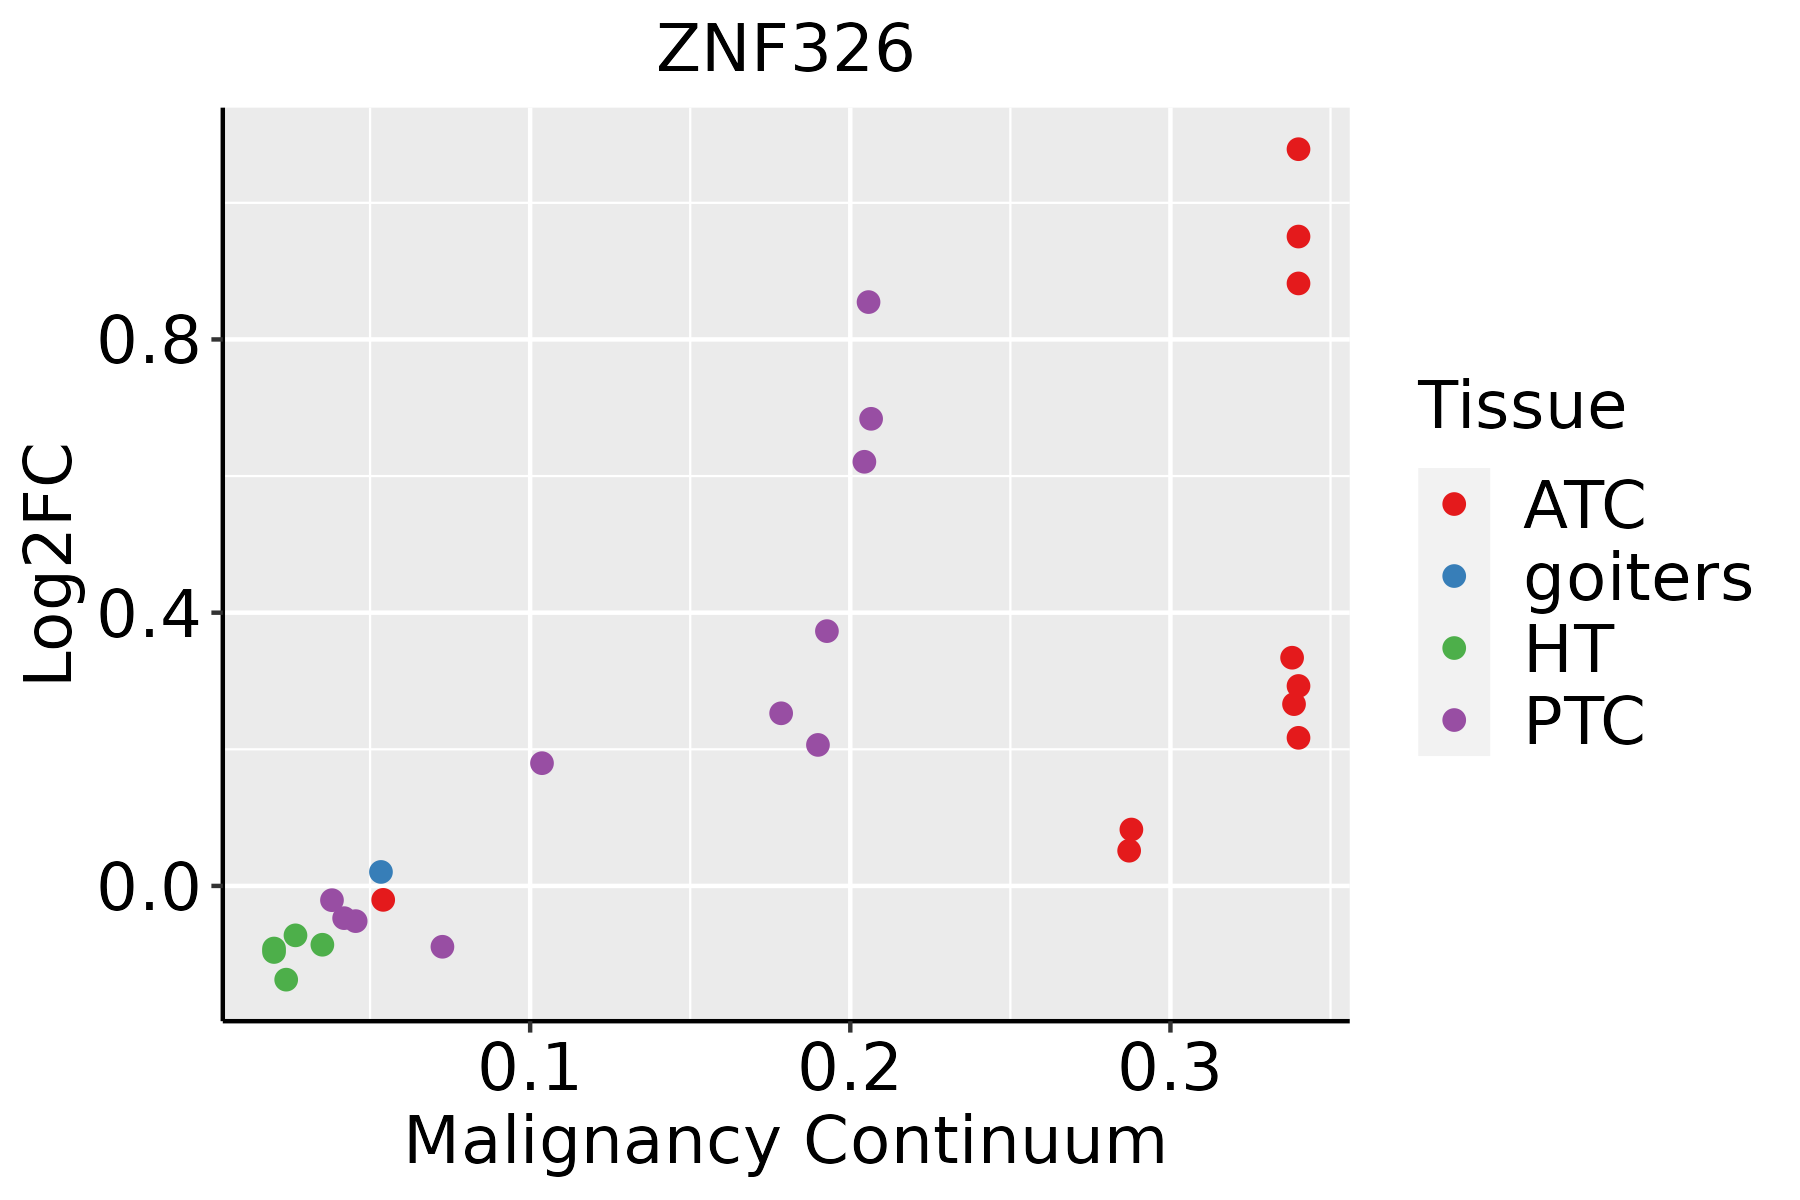
ATC: Anaplastic thyroid cancer
HT: Hashimoto's thyroiditis
PTC: Papillary thyroid cancer
∗log2FC in expression of this searched gene in stem-like cells from each diseased tissue sample relative to stem-like cells in normal samples in each tissue plotted against the malignancy continuum. Samples are colored based on if they are from different disease stage.

Top

Malignant transformation related pathway analysis

check buttonFind out the enriched GO biological processes and KEGG pathways involved in transition from healthy to precancer to cancer
check button Figure of enriched GO biological processes.
TissueDisease StageEnriched GO biological Processes
ColorectumADGO analysis - Figure of enriched GO biological processes: Top 15 enriched GO BP terms are showed in the bar plot of each disease state in each tissue. Each row represents a significant GO biological process which is colored according to the -log10(p.adjust).
ColorectumSERGO analysis - Figure of enriched GO biological processes: Top 15 enriched GO BP terms are showed in the bar plot of each disease state in each tissue. Each row represents a significant GO biological process which is colored according to the -log10(p.adjust).
ColorectumMSSGO analysis - Figure of enriched GO biological processes: Top 15 enriched GO BP terms are showed in the bar plot of each disease state in each tissue. Each row represents a significant GO biological process which is colored according to the -log10(p.adjust).
ColorectumMSI-HGO analysis - Figure of enriched GO biological processes: Top 15 enriched GO BP terms are showed in the bar plot of each disease state in each tissue. Each row represents a significant GO biological process which is colored according to the -log10(p.adjust).
ColorectumFAPGO analysis - Figure of enriched GO biological processes: Top 15 enriched GO BP terms are showed in the bar plot of each disease state in each tissue. Each row represents a significant GO biological process which is colored according to the -log10(p.adjust).
∗Top 15 enriched GO BP terms are showed in the bar plot of each disease state in each tissue. Each row represents a significant GO biological process which is colored according to the -log10(p.adjust).
Page: 1 2 3 4 5 6 7 8 9 

check button Enriched GO biological processes.
GO IDTissueDisease StageDescriptionGene RatioBg Ratiopvaluep.adjustCount
GO:0008380111EsophagusESCCRNA splicing336/8552434/187231.74e-423.67e-39336
GO:0043484111EsophagusESCCregulation of RNA splicing116/8552148/187233.18e-162.38e-14116
GO:000635414EsophagusESCCDNA-templated transcription, elongation76/855291/187238.35e-144.11e-1276
GO:003278412EsophagusESCCregulation of DNA-templated transcription, elongation45/855253/187233.64e-097.61e-0845
GO:000838022LiverHCCRNA splicing313/7958434/187231.36e-361.73e-33313
GO:004348422LiverHCCregulation of RNA splicing113/7958148/187234.32e-174.15e-15113
GO:000635411LiverHCCDNA-templated transcription, elongation64/795891/187237.00e-081.44e-0664
GO:0032784LiverHCCregulation of DNA-templated transcription, elongation39/795853/187234.34e-065.53e-0539
GO:00434848LungIACregulation of RNA splicing49/2061148/187234.76e-137.06e-1049
GO:00083808LungIACRNA splicing75/2061434/187234.89e-051.12e-0375
GO:004348413LungAISregulation of RNA splicing45/1849148/187232.75e-122.67e-0945
GO:000838013LungAISRNA splicing68/1849434/187238.50e-052.11e-0368
GO:000838020Oral cavityOSCCRNA splicing308/7305434/187232.43e-427.70e-39308
GO:004348420Oral cavityOSCCregulation of RNA splicing108/7305148/187234.25e-173.69e-15108
GO:00063547Oral cavityOSCCDNA-templated transcription, elongation63/730591/187234.86e-091.07e-0763
GO:00327843Oral cavityOSCCregulation of DNA-templated transcription, elongation36/730553/187231.89e-051.83e-0436
GO:000838027SkinAKRNA splicing111/1910434/187231.85e-205.49e-17111
GO:004348428SkinAKregulation of RNA splicing54/1910148/187239.66e-189.53e-1554
GO:00063549SkinAKDNA-templated transcription, elongation25/191091/187232.82e-067.60e-0525
GO:00327845SkinAKregulation of DNA-templated transcription, elongation16/191053/187234.87e-057.59e-0416
Page: 1 2 

check button Enriched KEGG pathways.
Pathway IDTissueDisease StageDescriptionGene RatioBg Ratiopvaluep.adjustqvalueCount
Page: 1 

Top

Cell-cell communication analysis

check buttonIdentification of potential cell-cell interactions between two cell types and their ligand-receptor pairs for different disease states
LigandReceptorLRpairPathwayTissueDisease Stage
Page: 1 

Top

Single-cell gene regulatory network inference analysis

check buttonFind out the significant the regulons (TFs) and the target genes of each regulon across cell types for different disease states
TFCell TypeTissueDisease StageTarget GeneRSSRegulon Activity
∗The dot plots of a searched regulon are shown for all cell subpopulations in each disease state of each tissue based on the regulon specific score inferred using pySCENIC and by calculating the average expression.
Page: 1 

Top

Somatic mutation of malignant transformation related genes

check buttonAnnotation of somatic variants for genes involved in malignant transformation
Hugo SymbolVariant ClassVariant ClassificationdbSNP RSHGVScHGVSpHGVSp ShortSWISSPROTBIOTYPESIFTPolyPhenTumor Sample BarcodeTissueHistologySexAgeStageTherapy TypesDrugsOutcome
ZNF326deletionFrame_Shift_Delc.1325_1358delNNNNNNNNNNNNNNNNNNNNNNNNNNNNNNNNNNp.Arg443IlefsTer4p.R443Ifs*4Q5BKZ1protein_codingTCGA-A2-A04T-01Breastbreast invasive carcinomaFemale<65I/IIChemotherapycyclophosphamideSD
ZNF326insertionFrame_Shift_Insnovelc.573_574insATCTTTTATGTTTTATCTGTTTATCCTTCTAp.Ala192IlefsTer28p.A192Ifs*28Q5BKZ1protein_codingTCGA-A2-A0D1-01Breastbreast invasive carcinomaFemale>=65I/IIChemotherapytaxotereSD
ZNF326insertionIn_Frame_Insnovelc.864_865insATCp.Ala288_Arg289insIlep.A288_R289insIQ5BKZ1protein_codingTCGA-A7-A26I-01Breastbreast invasive carcinomaFemale>=65I/IIChemotherapycytoxanSD
ZNF326insertionFrame_Shift_Insnovelc.1602_1603insGTAAAAGATGTGGTGACATTATTCACAGAACAGGTAAp.Ile535ValfsTer51p.I535Vfs*51Q5BKZ1protein_codingTCGA-AO-A128-01Breastbreast invasive carcinomaFemale<65I/IIChemotherapydoxorubicinSD
ZNF326SNVMissense_Mutationnovelc.1566G>Tp.Glu522Aspp.E522DQ5BKZ1protein_codingtolerated_low_confidence(0.6)benign(0.222)TCGA-MU-A5YI-01Cervixcervical & endocervical cancerFemale<65I/IIUnknownUnknownPD
ZNF326SNVMissense_Mutationc.1001C>Gp.Ser334Cysp.S334CQ5BKZ1protein_codingdeleterious(0.03)possibly_damaging(0.526)TCGA-Q1-A73P-01Cervixcervical & endocervical cancerFemale<65I/IIUnknownUnknownSD
ZNF326SNVMissense_Mutationrs773591916c.407N>Gp.Tyr136Cysp.Y136CQ5BKZ1protein_codingdeleterious(0.01)probably_damaging(0.956)TCGA-AA-3492-01Colorectumcolon adenocarcinomaFemale>=65I/IIUnknownUnknownSD
ZNF326SNVMissense_Mutationc.873G>Tp.Glu291Aspp.E291DQ5BKZ1protein_codingtolerated(0.22)probably_damaging(0.978)TCGA-AA-3510-01Colorectumcolon adenocarcinomaMale>=65I/IIUnknownUnknownSD
ZNF326SNVMissense_Mutationrs201031234c.329G>Ap.Arg110Glnp.R110QQ5BKZ1protein_codingtolerated(0.14)possibly_damaging(0.704)TCGA-AA-3710-01Colorectumcolon adenocarcinomaFemale>=65I/IIUnknownUnknownSD
ZNF326SNVMissense_Mutationc.1680N>Tp.Glu560Aspp.E560DQ5BKZ1protein_codingtolerated_low_confidence(0.52)benign(0.003)TCGA-AA-3811-01Colorectumcolon adenocarcinomaFemale>=65III/IVUnknownUnknownPD
Page: 1 2 3 4 5 6 7 

Top

Related drugs of malignant transformation related genes

check buttonIdentification of chemicals and drugs interact with genes involved in malignant transfromation
(DGIdb 4.0)
Entrez IDSymbolCategoryInteraction TypesDrug Claim NameDrug NamePMIDs
Page: 1