
|
|||||
|
 | |
| |
| |
| |
| |
| |
|
Gene: ZNF316 |
Gene summary for ZNF316 |
| Gene information | Species | Human | Gene symbol | ZNF316 | Gene ID | 100131017 |
| Gene name | zinc finger protein 316 | |
| Gene Alias | MZF-3 | |
| Cytomap | 7p22.1 | |
| Gene Type | protein-coding | GO ID | GO:0006139 | UniProtAcc | A6NFI3 |
Top |
Malignant transformation analysis |
| Identification of the aberrant gene expression in precancerous and cancerous lesions by comparing the gene expression of stem-like cells in diseased tissues with normal stem cells |
| Entrez ID | Symbol | Replicates | Species | Organ | Tissue | Adj P-value | Log2FC | Malignancy |
| 100131017 | ZNF316 | HCC1_Meng | Human | Liver | HCC | 3.34e-09 | 9.17e-03 | 0.0246 |
| 100131017 | ZNF316 | HCC2_Meng | Human | Liver | HCC | 4.17e-03 | 5.02e-02 | 0.0107 |
| 100131017 | ZNF316 | HCC2 | Human | Liver | HCC | 5.59e-14 | 2.84e+00 | 0.5341 |
| 100131017 | ZNF316 | S014 | Human | Liver | HCC | 2.16e-03 | 1.96e-01 | 0.2254 |
| 100131017 | ZNF316 | S015 | Human | Liver | HCC | 2.89e-05 | 3.14e-01 | 0.2375 |
| 100131017 | ZNF316 | S016 | Human | Liver | HCC | 2.17e-03 | 1.91e-01 | 0.2243 |
| 100131017 | ZNF316 | S027 | Human | Liver | HCC | 2.38e-06 | 4.89e-01 | 0.2446 |
| 100131017 | ZNF316 | S028 | Human | Liver | HCC | 7.13e-13 | 5.38e-01 | 0.2503 |
| 100131017 | ZNF316 | S029 | Human | Liver | HCC | 1.03e-07 | 3.74e-01 | 0.2581 |
| 100131017 | ZNF316 | male-WTA | Human | Thyroid | PTC | 1.52e-12 | 1.85e-01 | 0.1037 |
| 100131017 | ZNF316 | PTC01 | Human | Thyroid | PTC | 4.34e-07 | 7.76e-02 | 0.1899 |
| 100131017 | ZNF316 | PTC03 | Human | Thyroid | PTC | 2.08e-07 | 2.15e-01 | 0.1784 |
| 100131017 | ZNF316 | PTC04 | Human | Thyroid | PTC | 3.93e-16 | 1.98e-01 | 0.1927 |
| 100131017 | ZNF316 | PTC05 | Human | Thyroid | PTC | 1.68e-23 | 4.74e-01 | 0.2065 |
| 100131017 | ZNF316 | PTC06 | Human | Thyroid | PTC | 5.75e-20 | 3.30e-01 | 0.2057 |
| 100131017 | ZNF316 | PTC07 | Human | Thyroid | PTC | 1.28e-20 | 2.56e-01 | 0.2044 |
| 100131017 | ZNF316 | ATC09 | Human | Thyroid | ATC | 3.78e-05 | 1.86e-01 | 0.2871 |
| 100131017 | ZNF316 | ATC11 | Human | Thyroid | ATC | 4.05e-03 | 4.49e-01 | 0.3386 |
| 100131017 | ZNF316 | ATC12 | Human | Thyroid | ATC | 2.90e-12 | 1.99e-01 | 0.34 |
| 100131017 | ZNF316 | ATC13 | Human | Thyroid | ATC | 3.96e-21 | 2.94e-01 | 0.34 |
| Page: 1 2 |
| Tissue | Expression Dynamics | Abbreviation |
| Liver |  | HCC: Hepatocellular carcinoma |
| NAFLD: Non-alcoholic fatty liver disease | ||
| Thyroid | 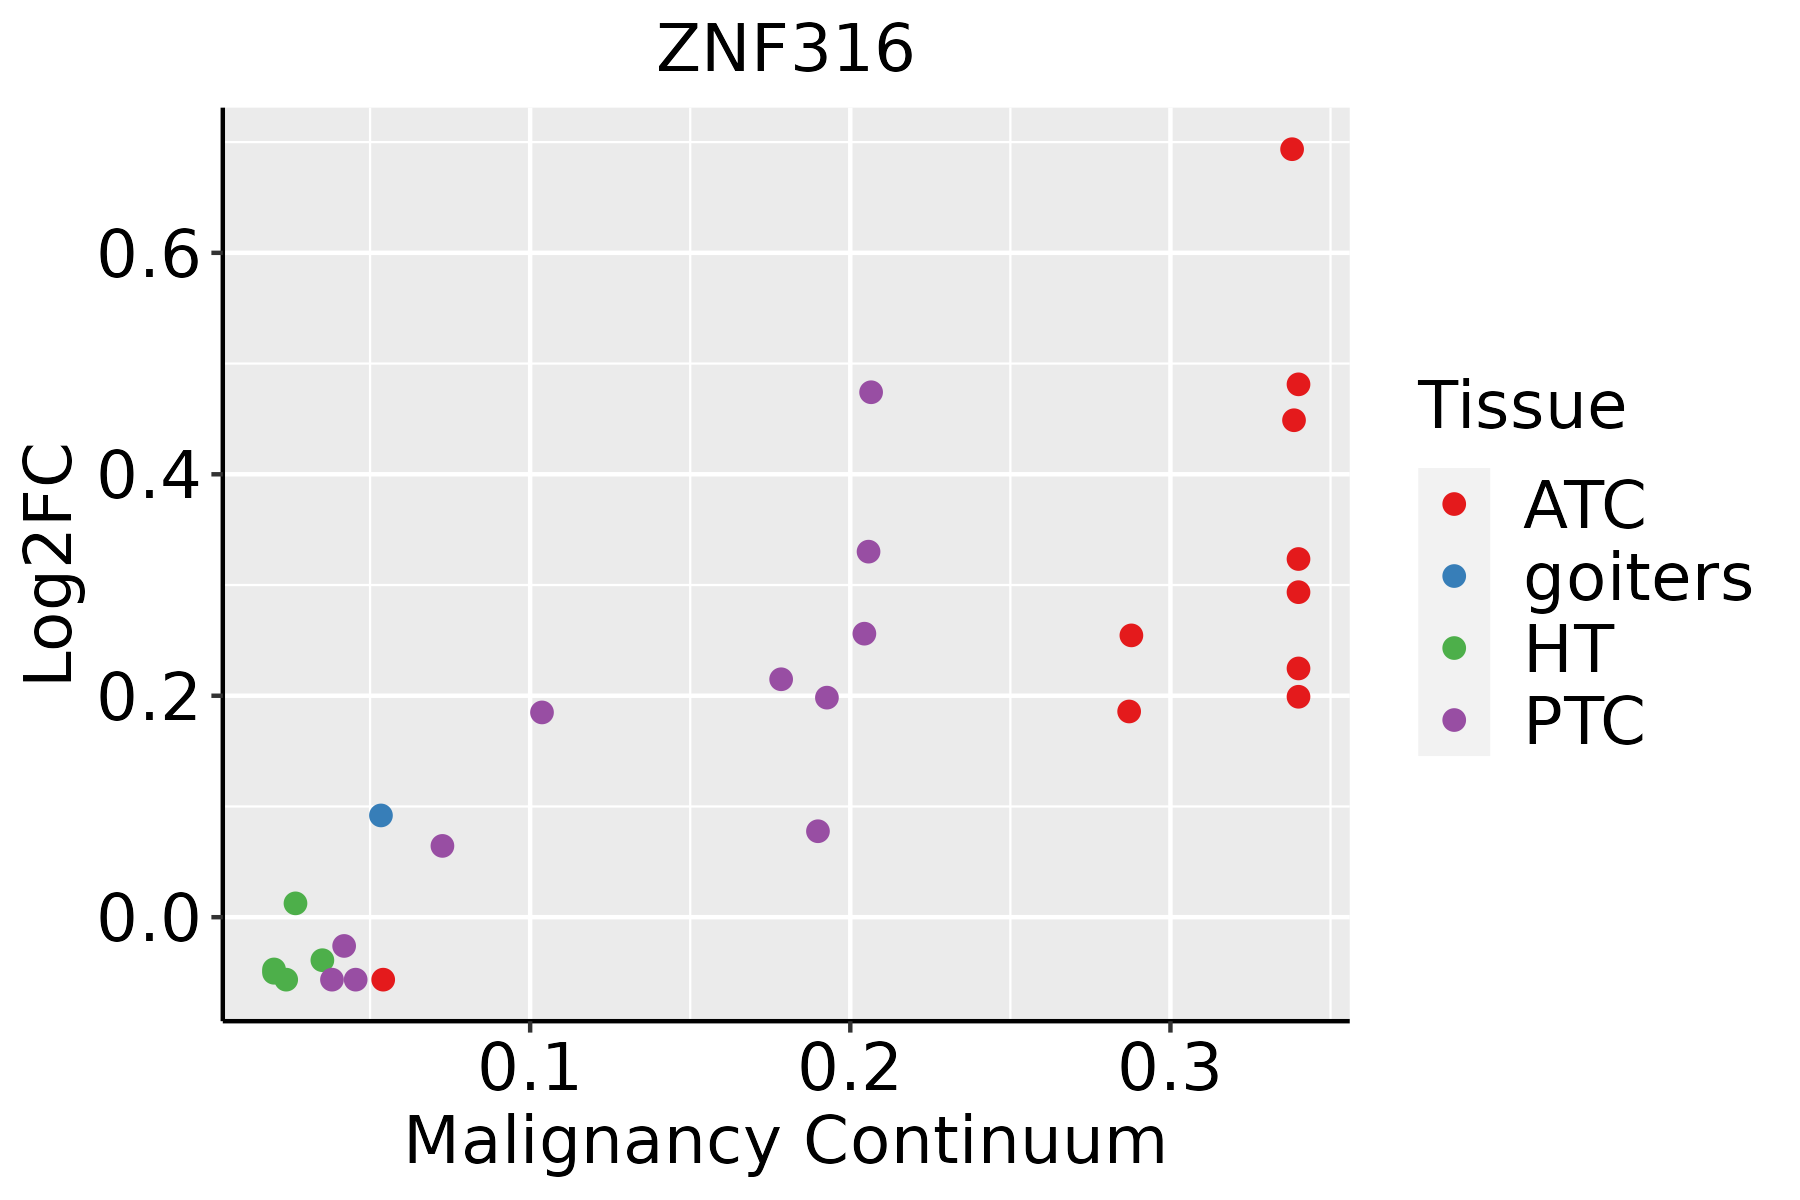 | ATC: Anaplastic thyroid cancer |
| HT: Hashimoto's thyroiditis | ||
| PTC: Papillary thyroid cancer |
| ∗log2FC in expression of this searched gene in stem-like cells from each diseased tissue sample relative to stem-like cells in normal samples in each tissue plotted against the malignancy continuum. Samples are colored based on if they are from different disease stage. |
Top |
Malignant transformation related pathway analysis |
| Find out the enriched GO biological processes and KEGG pathways involved in transition from healthy to precancer to cancer |
| Tissue | Disease Stage | Enriched GO biological Processes |
| Colorectum | AD |  |
| Colorectum | SER |  |
| Colorectum | MSS |  |
| Colorectum | MSI-H |  |
| Colorectum | FAP |  |
| ∗Top 15 enriched GO BP terms are showed in the bar plot of each disease state in each tissue. Each row represents a significant GO biological process which is colored according to the -log10(p.adjust). |
| Page: 1 2 3 4 5 6 7 8 9 |
| GO ID | Tissue | Disease Stage | Description | Gene Ratio | Bg Ratio | pvalue | p.adjust | Count |
| Page: 1 |
| Pathway ID | Tissue | Disease Stage | Description | Gene Ratio | Bg Ratio | pvalue | p.adjust | qvalue | Count |
| Page: 1 |
Top |
Cell-cell communication analysis |
| Identification of potential cell-cell interactions between two cell types and their ligand-receptor pairs for different disease states |
| Ligand | Receptor | LRpair | Pathway | Tissue | Disease Stage |
| Page: 1 |
Top |
Single-cell gene regulatory network inference analysis |
| Find out the significant the regulons (TFs) and the target genes of each regulon across cell types for different disease states |
| TF | Cell Type | Tissue | Disease Stage | Target Gene | RSS | Regulon Activity |
| ZNF316 | CD8TEX | Breast | Precancer | AC008105.3,IFNG-AS1,COMTD1, etc. | 1.48e-02 |  |
| ZNF316 | CD8TEXINT | Colorectum | CRC | ZNF808,CHCHD6,FBXL18, etc. | 3.21e-02 |  |
| ZNF316 | CD8TEXINT | Colorectum | FAP | ZNF808,CHCHD6,FBXL18, etc. | 3.13e-02 |  |
| ZNF316 | TH17 | Colorectum | Healthy | ZNF808,CHCHD6,FBXL18, etc. | 3.04e-02 |  |
| ZNF316 | TFH | Colorectum | MSI-H | ZNF808,CHCHD6,FBXL18, etc. | 0.00e+00 |  |
| ZNF316 | TH1 | Colorectum | MSI-H | ZNF808,CHCHD6,FBXL18, etc. | 0.00e+00 | |
| ZNF316 | ILC | Colorectum | MSI-H | ZNF808,CHCHD6,FBXL18, etc. | 1.45e-02 | |
| ZNF316 | CD4TN | Colorectum | MSI-H | ZNF808,CHCHD6,FBXL18, etc. | 0.00e+00 | |
| ZNF316 | ILC | Colorectum | MSS | ZNF808,CHCHD6,FBXL18, etc. | 5.78e-02 |  |
| ZNF316 | LYMEND | Endometrium | AEH | LAMC2,SGCD,MMP7, etc. | 7.51e-02 |  |
| ∗The dot plots of a searched regulon are shown for all cell subpopulations in each disease state of each tissue based on the regulon specific score inferred using pySCENIC and by calculating the average expression. |
| Page: 1 2 3 |
Top |
Somatic mutation of malignant transformation related genes |
| Annotation of somatic variants for genes involved in malignant transformation |
| Hugo Symbol | Variant Class | Variant Classification | dbSNP RS | HGVSc | HGVSp | HGVSp Short | SWISSPROT | BIOTYPE | SIFT | PolyPhen | Tumor Sample Barcode | Tissue | Histology | Sex | Age | Stage | Therapy Types | Drugs | Outcome |
| ZNF316 | SNV | Missense_Mutation | novel | c.664N>T | p.Pro222Ser | p.P222S | A6NFI3 | protein_coding | deleterious(0.04) | probably_damaging(0.97) | TCGA-AC-A3W6-01 | Breast | breast invasive carcinoma | Female | >=65 | III/IV | Unknown | Unknown | SD |
| ZNF316 | SNV | Missense_Mutation | novel | c.1439N>T | p.Thr480Met | p.T480M | A6NFI3 | protein_coding | deleterious(0) | probably_damaging(0.978) | TCGA-EW-A6SA-01 | Breast | breast invasive carcinoma | Male | <65 | I/II | Unknown | Unknown | SD |
| ZNF316 | SNV | Missense_Mutation | rs566698996 | c.161N>T | p.Glu54Val | p.E54V | A6NFI3 | protein_coding | tolerated_low_confidence(0.13) | unknown(0) | TCGA-AJ-A8CW-01 | Endometrium | uterine corpus endometrioid carcinoma | Female | <65 | I/II | Unknown | Unknown | SD |
| ZNF316 | SNV | Missense_Mutation | novel | c.1301N>A | p.Cys434Tyr | p.C434Y | A6NFI3 | protein_coding | deleterious(0) | probably_damaging(0.994) | TCGA-AP-A1DK-01 | Endometrium | uterine corpus endometrioid carcinoma | Female | <65 | I/II | Unknown | Unknown | SD |
| ZNF316 | SNV | Missense_Mutation | novel | c.668N>A | p.Arg223Gln | p.R223Q | A6NFI3 | protein_coding | tolerated(0.24) | benign(0.129) | TCGA-AP-A1DV-01 | Endometrium | uterine corpus endometrioid carcinoma | Female | <65 | I/II | Unknown | Unknown | SD |
| ZNF316 | SNV | Missense_Mutation | novel | c.722N>T | p.Thr241Met | p.T241M | A6NFI3 | protein_coding | deleterious(0) | possibly_damaging(0.896) | TCGA-AX-A1C5-01 | Endometrium | uterine corpus endometrioid carcinoma | Female | <65 | III/IV | Unspecific | Carboplatin | SD |
| ZNF316 | SNV | Missense_Mutation | novel | c.303G>T | p.Gln101His | p.Q101H | A6NFI3 | protein_coding | deleterious_low_confidence(0.01) | probably_damaging(0.95) | TCGA-AX-A2HC-01 | Endometrium | uterine corpus endometrioid carcinoma | Female | <65 | III/IV | Chemotherapy | paclitaxel | PD |
| ZNF316 | SNV | Missense_Mutation | rs566698996 | c.161N>T | p.Glu54Val | p.E54V | A6NFI3 | protein_coding | tolerated_low_confidence(0.13) | unknown(0) | TCGA-AX-A2HD-01 | Endometrium | uterine corpus endometrioid carcinoma | Female | >=65 | III/IV | Unknown | Unknown | SD |
| ZNF316 | SNV | Missense_Mutation | novel | c.239N>G | p.Asp80Gly | p.D80G | A6NFI3 | protein_coding | tolerated_low_confidence(0.28) | unknown(0) | TCGA-B5-A3FA-01 | Endometrium | uterine corpus endometrioid carcinoma | Female | >=65 | I/II | Unknown | Unknown | SD |
| ZNF316 | SNV | Missense_Mutation | rs377600054 | c.317G>A | p.Arg106His | p.R106H | A6NFI3 | protein_coding | tolerated_low_confidence(0.56) | benign(0.001) | TCGA-B5-A3FC-01 | Endometrium | uterine corpus endometrioid carcinoma | Female | <65 | I/II | Unknown | Unknown | SD |
| Page: 1 2 3 |
Top |
Related drugs of malignant transformation related genes |
| Identification of chemicals and drugs interact with genes involved in malignant transfromation |
| (DGIdb 4.0) |
| Entrez ID | Symbol | Category | Interaction Types | Drug Claim Name | Drug Name | PMIDs |
| Page: 1 |

Copyright 2023-Present -The University of Texas Health Science Center at Houston |