
|
|||||
|
 | |
| |
| |
| |
| |
| |
|
Gene: ZNF302 |
Gene summary for ZNF302 |
| Gene information | Species | Human | Gene symbol | ZNF302 | Gene ID | 55900 |
| Gene name | zinc finger protein 302 | |
| Gene Alias | HSD16 | |
| Cytomap | 19q13.11 | |
| Gene Type | protein-coding | GO ID | GO:0006139 | UniProtAcc | Q9NR11 |
Top |
Malignant transformation analysis |
| Identification of the aberrant gene expression in precancerous and cancerous lesions by comparing the gene expression of stem-like cells in diseased tissues with normal stem cells |
| Entrez ID | Symbol | Replicates | Species | Organ | Tissue | Adj P-value | Log2FC | Malignancy |
| 55900 | ZNF302 | LZE4T | Human | Esophagus | ESCC | 2.16e-03 | 1.28e-01 | 0.0811 |
| 55900 | ZNF302 | LZE5T | Human | Esophagus | ESCC | 1.14e-05 | 2.63e-01 | 0.0514 |
| 55900 | ZNF302 | LZE7T | Human | Esophagus | ESCC | 4.39e-08 | 3.22e-01 | 0.0667 |
| 55900 | ZNF302 | LZE24T | Human | Esophagus | ESCC | 8.88e-16 | 4.11e-01 | 0.0596 |
| 55900 | ZNF302 | LZE21T | Human | Esophagus | ESCC | 4.67e-03 | 1.62e-01 | 0.0655 |
| 55900 | ZNF302 | LZE6T | Human | Esophagus | ESCC | 1.01e-02 | 1.75e-01 | 0.0845 |
| 55900 | ZNF302 | P1T-E | Human | Esophagus | ESCC | 5.16e-15 | 6.92e-01 | 0.0875 |
| 55900 | ZNF302 | P2T-E | Human | Esophagus | ESCC | 4.65e-18 | 3.20e-01 | 0.1177 |
| 55900 | ZNF302 | P4T-E | Human | Esophagus | ESCC | 7.21e-10 | 2.59e-01 | 0.1323 |
| 55900 | ZNF302 | P5T-E | Human | Esophagus | ESCC | 8.69e-10 | 1.83e-01 | 0.1327 |
| 55900 | ZNF302 | P8T-E | Human | Esophagus | ESCC | 5.03e-49 | 8.80e-01 | 0.0889 |
| 55900 | ZNF302 | P9T-E | Human | Esophagus | ESCC | 7.15e-23 | 5.38e-01 | 0.1131 |
| 55900 | ZNF302 | P10T-E | Human | Esophagus | ESCC | 1.89e-56 | 9.51e-01 | 0.116 |
| 55900 | ZNF302 | P11T-E | Human | Esophagus | ESCC | 1.95e-10 | 4.08e-01 | 0.1426 |
| 55900 | ZNF302 | P12T-E | Human | Esophagus | ESCC | 7.56e-21 | 4.39e-01 | 0.1122 |
| 55900 | ZNF302 | P15T-E | Human | Esophagus | ESCC | 1.47e-13 | 2.81e-01 | 0.1149 |
| 55900 | ZNF302 | P16T-E | Human | Esophagus | ESCC | 5.23e-16 | 2.58e-01 | 0.1153 |
| 55900 | ZNF302 | P19T-E | Human | Esophagus | ESCC | 3.81e-03 | 2.05e-01 | 0.1662 |
| 55900 | ZNF302 | P20T-E | Human | Esophagus | ESCC | 3.11e-16 | 4.43e-01 | 0.1124 |
| 55900 | ZNF302 | P21T-E | Human | Esophagus | ESCC | 1.10e-06 | 9.63e-02 | 0.1617 |
| Page: 1 2 3 4 5 |
| Tissue | Expression Dynamics | Abbreviation |
| Esophagus | 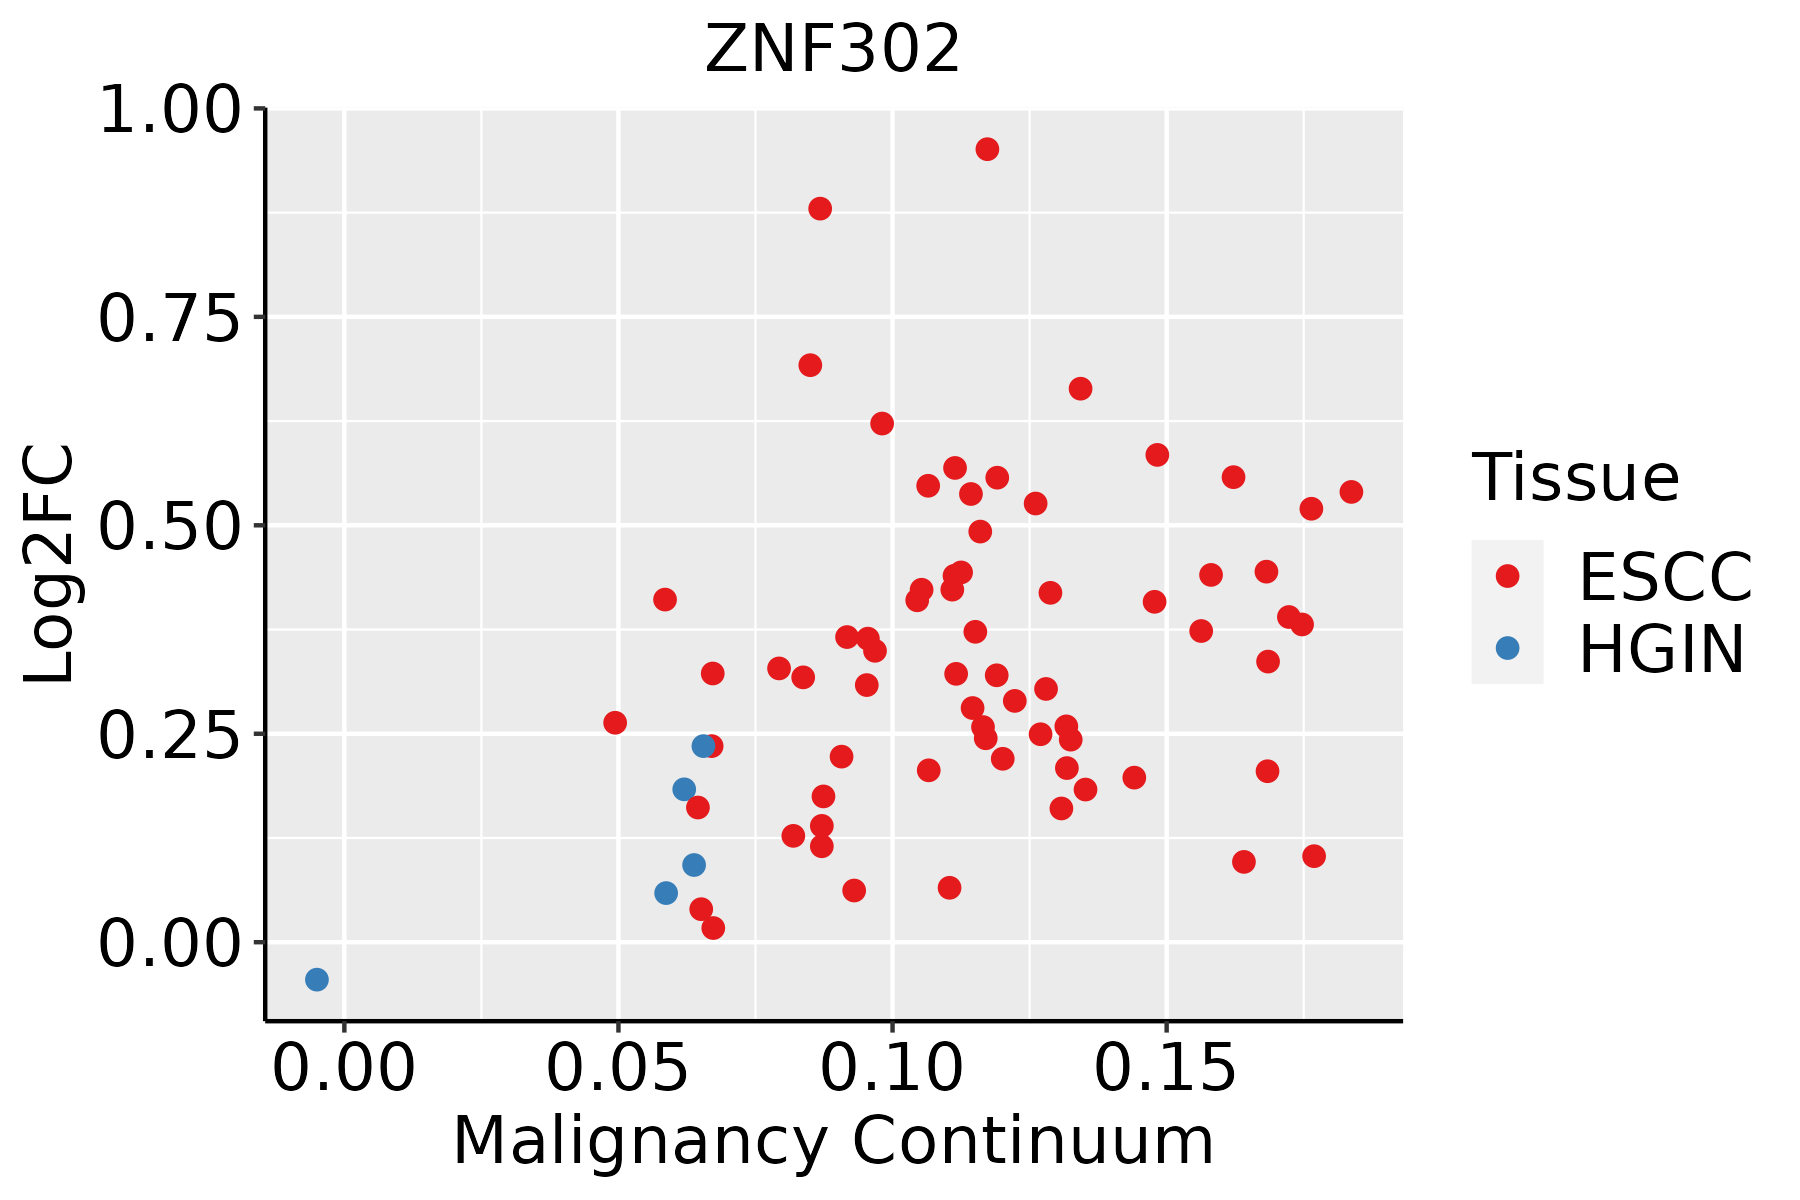 | ESCC: Esophageal squamous cell carcinoma |
| HGIN: High-grade intraepithelial neoplasias | ||
| LGIN: Low-grade intraepithelial neoplasias | ||
| Liver | 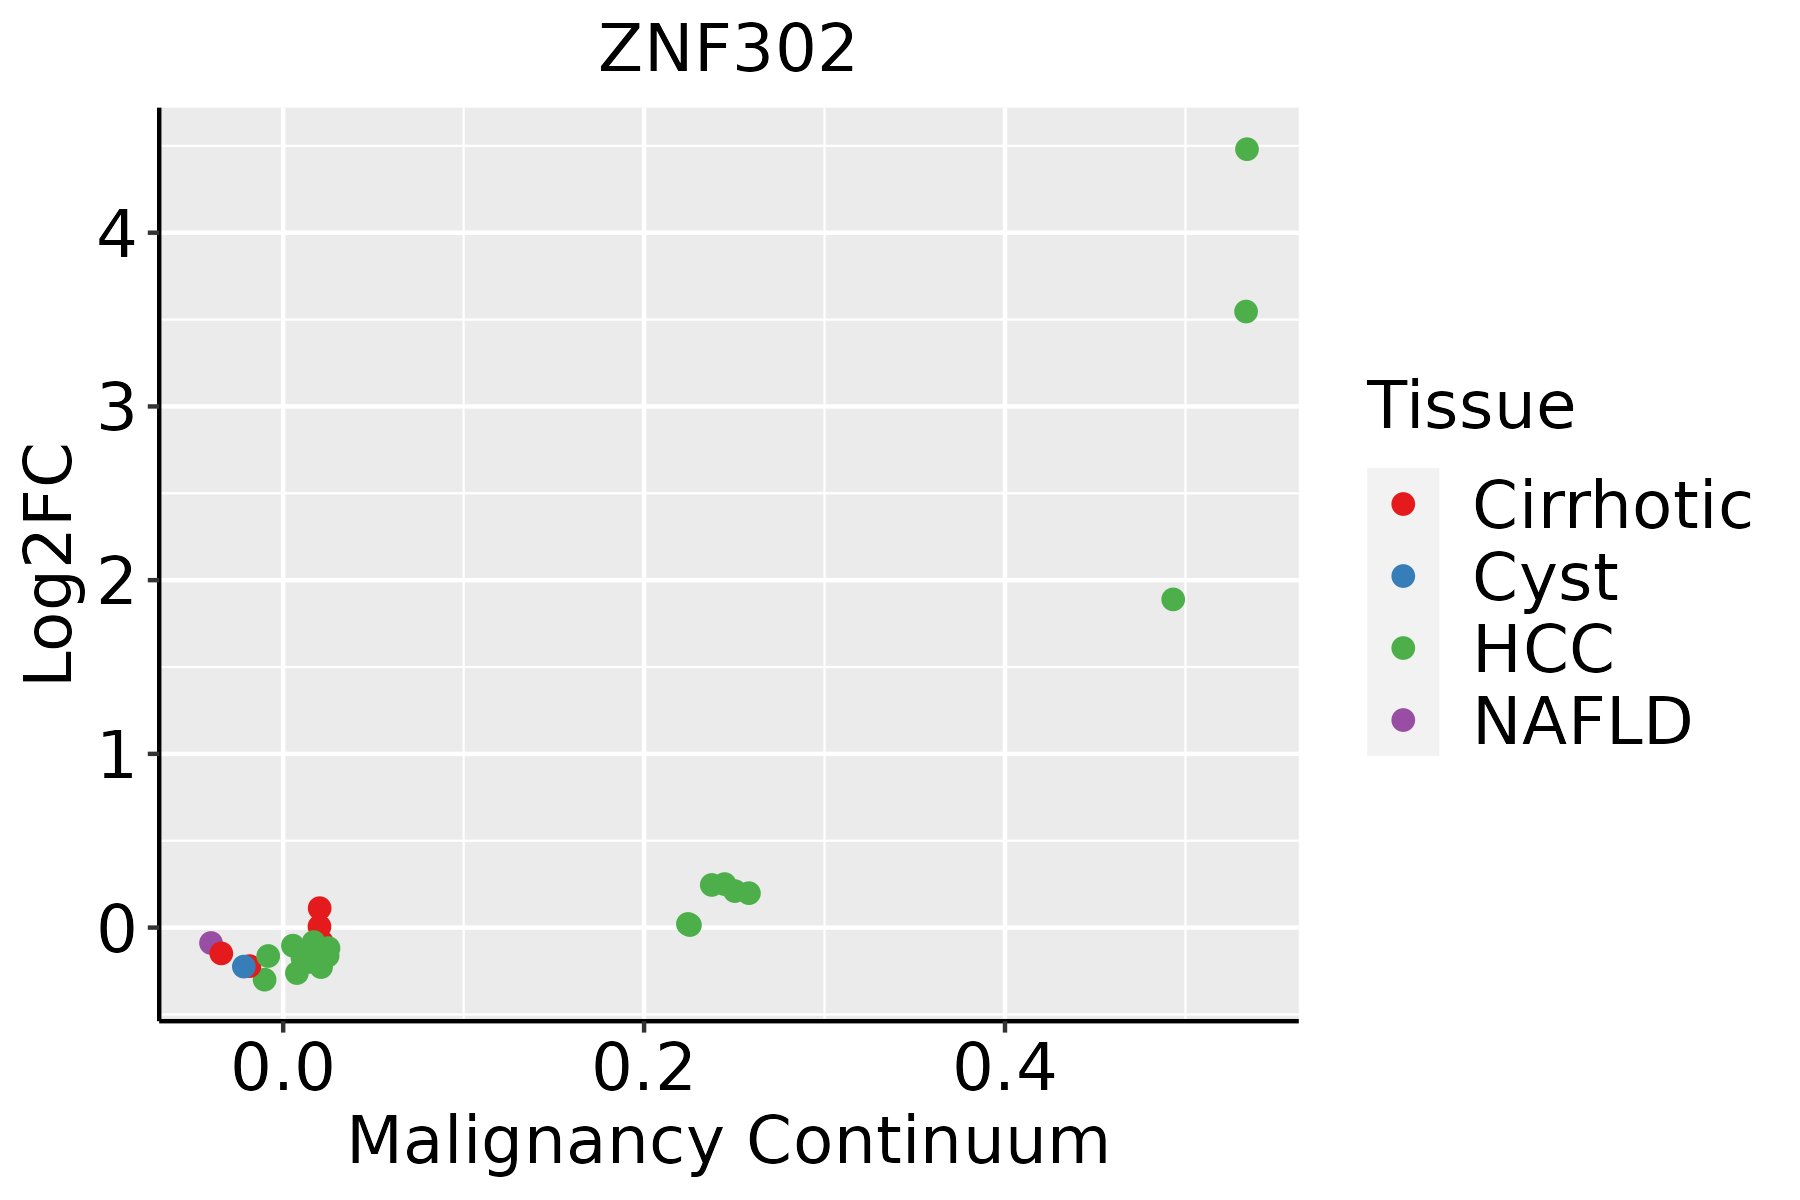 | HCC: Hepatocellular carcinoma |
| NAFLD: Non-alcoholic fatty liver disease | ||
| Thyroid | 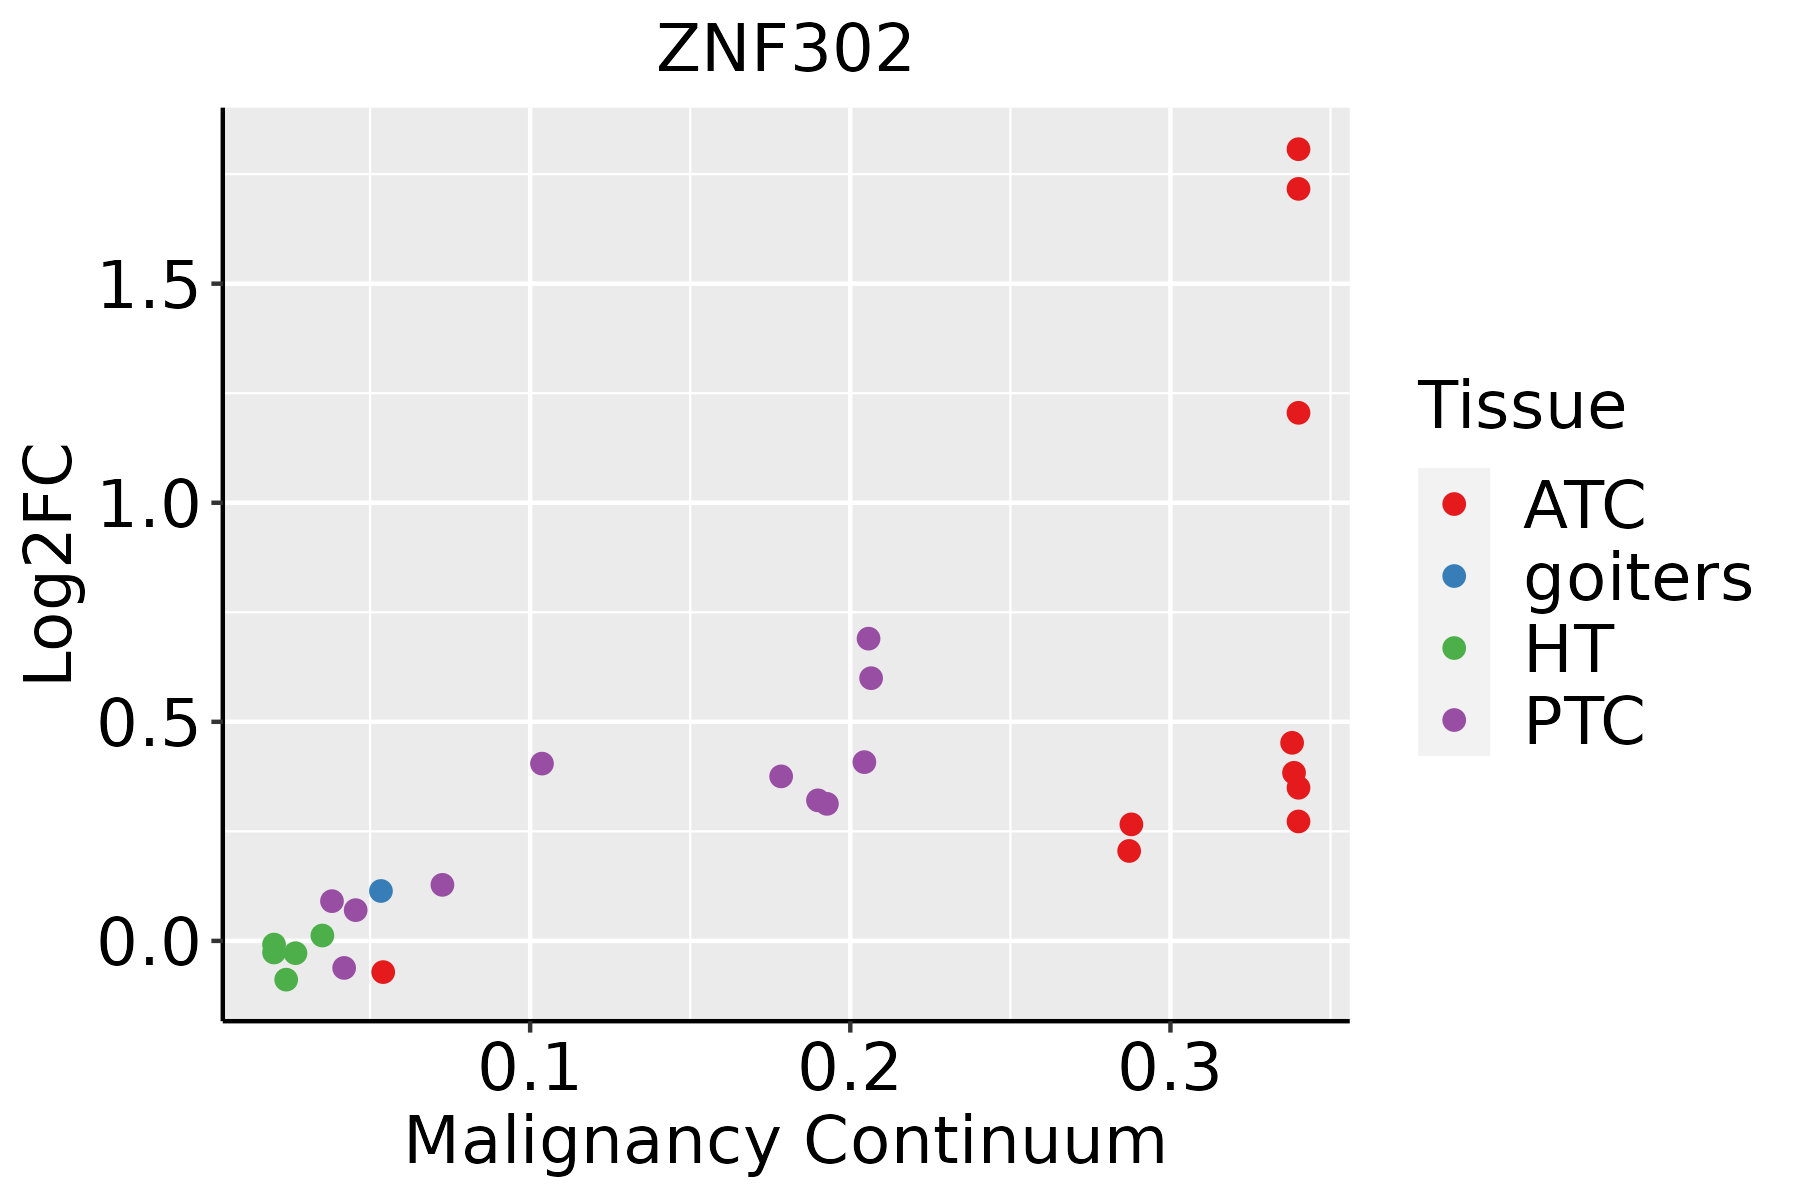 | ATC: Anaplastic thyroid cancer |
| HT: Hashimoto's thyroiditis | ||
| PTC: Papillary thyroid cancer |
| ∗log2FC in expression of this searched gene in stem-like cells from each diseased tissue sample relative to stem-like cells in normal samples in each tissue plotted against the malignancy continuum. Samples are colored based on if they are from different disease stage. |
Top |
Malignant transformation related pathway analysis |
| Find out the enriched GO biological processes and KEGG pathways involved in transition from healthy to precancer to cancer |
| Tissue | Disease Stage | Enriched GO biological Processes |
| Colorectum | AD |  |
| Colorectum | SER |  |
| Colorectum | MSS |  |
| Colorectum | MSI-H |  |
| Colorectum | FAP |  |
| ∗Top 15 enriched GO BP terms are showed in the bar plot of each disease state in each tissue. Each row represents a significant GO biological process which is colored according to the -log10(p.adjust). |
| Page: 1 2 3 4 5 6 7 8 9 |
| GO ID | Tissue | Disease Stage | Description | Gene Ratio | Bg Ratio | pvalue | p.adjust | Count |
| Page: 1 |
| Pathway ID | Tissue | Disease Stage | Description | Gene Ratio | Bg Ratio | pvalue | p.adjust | qvalue | Count |
| Page: 1 |
Top |
Cell-cell communication analysis |
| Identification of potential cell-cell interactions between two cell types and their ligand-receptor pairs for different disease states |
| Ligand | Receptor | LRpair | Pathway | Tissue | Disease Stage |
| Page: 1 |
Top |
Single-cell gene regulatory network inference analysis |
| Find out the significant the regulons (TFs) and the target genes of each regulon across cell types for different disease states |
| TF | Cell Type | Tissue | Disease Stage | Target Gene | RSS | Regulon Activity |
| ZNF302 | CYC | Skin | Healthy | SEPT4,LARP6,NRXN1, etc. | 3.07e-01 |  |
| ∗The dot plots of a searched regulon are shown for all cell subpopulations in each disease state of each tissue based on the regulon specific score inferred using pySCENIC and by calculating the average expression. |
| Page: 1 |
Top |
Somatic mutation of malignant transformation related genes |
| Annotation of somatic variants for genes involved in malignant transformation |
| Hugo Symbol | Variant Class | Variant Classification | dbSNP RS | HGVSc | HGVSp | HGVSp Short | SWISSPROT | BIOTYPE | SIFT | PolyPhen | Tumor Sample Barcode | Tissue | Histology | Sex | Age | Stage | Therapy Types | Drugs | Outcome |
| ZNF302 | SNV | Missense_Mutation | c.732N>G | p.Ile244Met | p.I244M | protein_coding | tolerated(0.05) | benign(0.293) | TCGA-AN-A0XW-01 | Breast | breast invasive carcinoma | Female | <65 | III/IV | Unknown | Unknown | SD | ||
| ZNF302 | SNV | Missense_Mutation | rs767107732 | c.1079N>A | p.Arg360His | p.R360H | protein_coding | tolerated(0.05) | possibly_damaging(0.809) | TCGA-BH-A0BC-01 | Breast | breast invasive carcinoma | Female | <65 | III/IV | Chemotherapy | doxorubicin | SD | |
| ZNF302 | SNV | Missense_Mutation | novel | c.1039N>T | p.His347Tyr | p.H347Y | protein_coding | deleterious(0) | probably_damaging(0.966) | TCGA-C5-A8XK-01 | Cervix | cervical & endocervical cancer | Female | <65 | I/II | Chemotherapy | cisplatin | SD | |
| ZNF302 | SNV | Missense_Mutation | c.1319N>G | p.Pro440Arg | p.P440R | protein_coding | deleterious(0) | probably_damaging(0.995) | TCGA-EA-A1QS-01 | Cervix | cervical & endocervical cancer | Female | <65 | I/II | Unknown | Unknown | SD | ||
| ZNF302 | SNV | Missense_Mutation | novel | c.78N>C | p.Met26Ile | p.M26I | protein_coding | tolerated_low_confidence(0.46) | benign(0) | TCGA-EK-A2PG-01 | Cervix | cervical & endocervical cancer | Female | >=65 | I/II | Unknown | Unknown | SD | |
| ZNF302 | SNV | Missense_Mutation | novel | c.1214G>A | p.Arg405Lys | p.R405K | protein_coding | tolerated(0.05) | benign(0.006) | TCGA-JW-A5VL-01 | Cervix | cervical & endocervical cancer | Female | <65 | I/II | Unknown | Unknown | SD | |
| ZNF302 | SNV | Missense_Mutation | c.439N>C | p.Val147Leu | p.V147L | protein_coding | tolerated(0.46) | benign(0.006) | TCGA-JX-A3Q0-01 | Cervix | cervical & endocervical cancer | Female | <65 | III/IV | Unknown | Unknown | SD | ||
| ZNF302 | SNV | Missense_Mutation | c.1265T>A | p.Phe422Tyr | p.F422Y | protein_coding | deleterious(0.05) | probably_damaging(0.92) | TCGA-AA-3506-01 | Colorectum | colon adenocarcinoma | Male | >=65 | I/II | Unknown | Unknown | SD | ||
| ZNF302 | SNV | Missense_Mutation | rs766941441 | c.826C>T | p.Arg276Cys | p.R276C | protein_coding | deleterious(0.02) | possibly_damaging(0.828) | TCGA-AA-A00N-01 | Colorectum | colon adenocarcinoma | Male | >=65 | I/II | Unknown | Unknown | PD | |
| ZNF302 | SNV | Missense_Mutation | c.151N>C | p.Ser51Arg | p.S51R | protein_coding | tolerated(1) | benign(0.165) | TCGA-AZ-6598-01 | Colorectum | colon adenocarcinoma | Female | >=65 | I/II | Unknown | Unknown | SD |
| Page: 1 2 3 4 5 |
Top |
Related drugs of malignant transformation related genes |
| Identification of chemicals and drugs interact with genes involved in malignant transfromation |
| (DGIdb 4.0) |
| Entrez ID | Symbol | Category | Interaction Types | Drug Claim Name | Drug Name | PMIDs |
| Page: 1 |

Copyright 2023-Present -The University of Texas Health Science Center at Houston |