
|
|||||
|
 | |
| |
| |
| |
| |
| |
|
Gene: ZNF281 |
Gene summary for ZNF281 |
| Gene information | Species | Human | Gene symbol | ZNF281 | Gene ID | 23528 |
| Gene name | zinc finger protein 281 | |
| Gene Alias | GZP1 | |
| Cytomap | 1q32.1 | |
| Gene Type | protein-coding | GO ID | GO:0000122 | UniProtAcc | Q9Y2X9 |
Top |
Malignant transformation analysis |
| Identification of the aberrant gene expression in precancerous and cancerous lesions by comparing the gene expression of stem-like cells in diseased tissues with normal stem cells |
| Entrez ID | Symbol | Replicates | Species | Organ | Tissue | Adj P-value | Log2FC | Malignancy |
| 23528 | ZNF281 | LZE4T | Human | Esophagus | ESCC | 8.94e-13 | 1.82e-01 | 0.0811 |
| 23528 | ZNF281 | LZE7T | Human | Esophagus | ESCC | 4.19e-02 | 3.72e-01 | 0.0667 |
| 23528 | ZNF281 | LZE20T | Human | Esophagus | ESCC | 9.42e-04 | -2.54e-02 | 0.0662 |
| 23528 | ZNF281 | LZE24T | Human | Esophagus | ESCC | 9.19e-11 | 1.21e-01 | 0.0596 |
| 23528 | ZNF281 | P2T-E | Human | Esophagus | ESCC | 6.49e-21 | 4.65e-01 | 0.1177 |
| 23528 | ZNF281 | P4T-E | Human | Esophagus | ESCC | 5.32e-09 | 3.00e-01 | 0.1323 |
| 23528 | ZNF281 | P5T-E | Human | Esophagus | ESCC | 7.05e-21 | 4.56e-01 | 0.1327 |
| 23528 | ZNF281 | P8T-E | Human | Esophagus | ESCC | 1.00e-18 | 2.31e-01 | 0.0889 |
| 23528 | ZNF281 | P9T-E | Human | Esophagus | ESCC | 8.07e-09 | 1.34e-01 | 0.1131 |
| 23528 | ZNF281 | P10T-E | Human | Esophagus | ESCC | 2.70e-24 | 3.34e-01 | 0.116 |
| 23528 | ZNF281 | P11T-E | Human | Esophagus | ESCC | 2.04e-02 | 2.93e-01 | 0.1426 |
| 23528 | ZNF281 | P12T-E | Human | Esophagus | ESCC | 6.46e-12 | 2.04e-01 | 0.1122 |
| 23528 | ZNF281 | P15T-E | Human | Esophagus | ESCC | 3.88e-24 | 3.75e-01 | 0.1149 |
| 23528 | ZNF281 | P16T-E | Human | Esophagus | ESCC | 6.46e-12 | 1.08e-01 | 0.1153 |
| 23528 | ZNF281 | P20T-E | Human | Esophagus | ESCC | 2.04e-03 | 1.51e-01 | 0.1124 |
| 23528 | ZNF281 | P21T-E | Human | Esophagus | ESCC | 4.02e-09 | 1.33e-01 | 0.1617 |
| 23528 | ZNF281 | P22T-E | Human | Esophagus | ESCC | 9.85e-11 | 2.55e-01 | 0.1236 |
| 23528 | ZNF281 | P23T-E | Human | Esophagus | ESCC | 4.83e-14 | 4.50e-01 | 0.108 |
| 23528 | ZNF281 | P24T-E | Human | Esophagus | ESCC | 8.64e-09 | 5.43e-02 | 0.1287 |
| 23528 | ZNF281 | P26T-E | Human | Esophagus | ESCC | 2.76e-23 | 4.37e-01 | 0.1276 |
| Page: 1 2 3 4 5 |
| Tissue | Expression Dynamics | Abbreviation |
| Esophagus |  | ESCC: Esophageal squamous cell carcinoma |
| HGIN: High-grade intraepithelial neoplasias | ||
| LGIN: Low-grade intraepithelial neoplasias | ||
| Liver |  | HCC: Hepatocellular carcinoma |
| NAFLD: Non-alcoholic fatty liver disease | ||
| Oral Cavity | 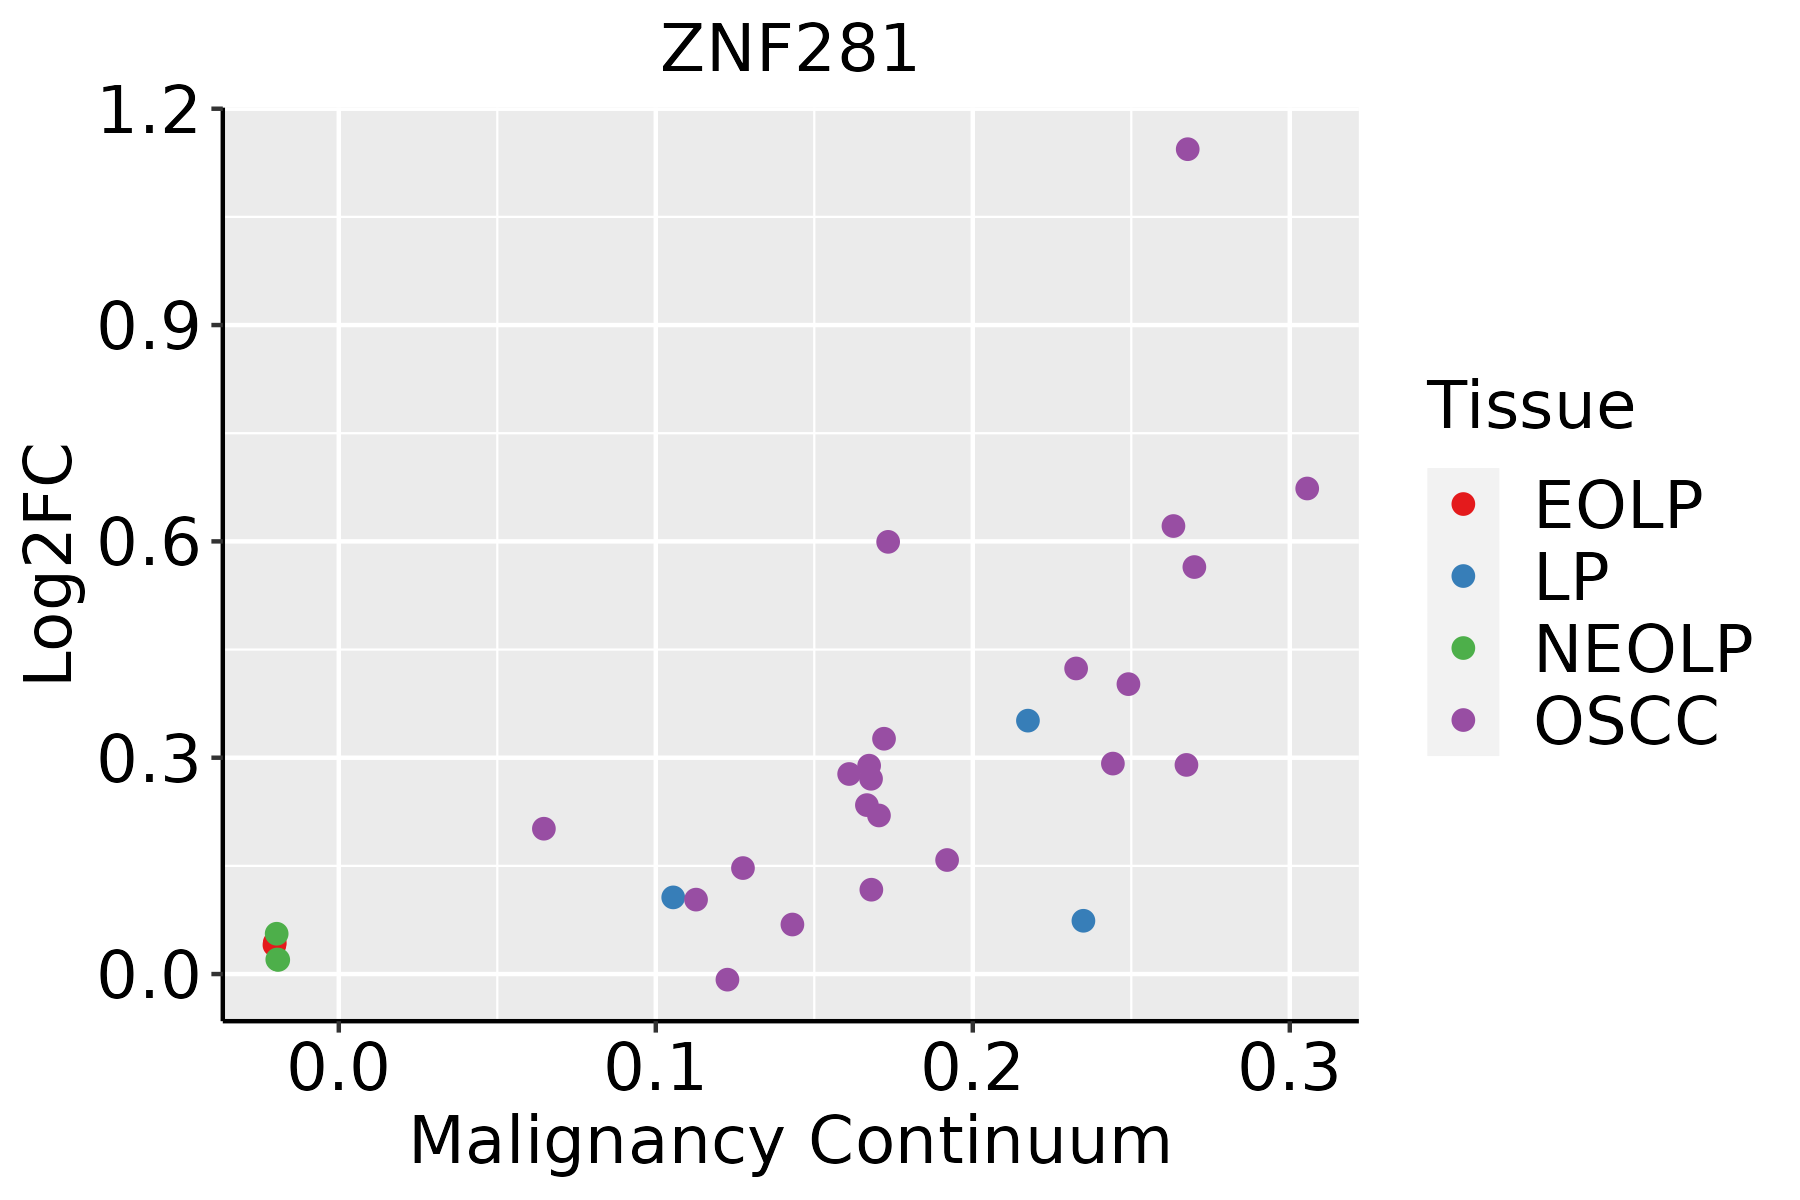 | EOLP: Erosive Oral lichen planus |
| LP: leukoplakia | ||
| NEOLP: Non-erosive oral lichen planus | ||
| OSCC: Oral squamous cell carcinoma | ||
| Thyroid | 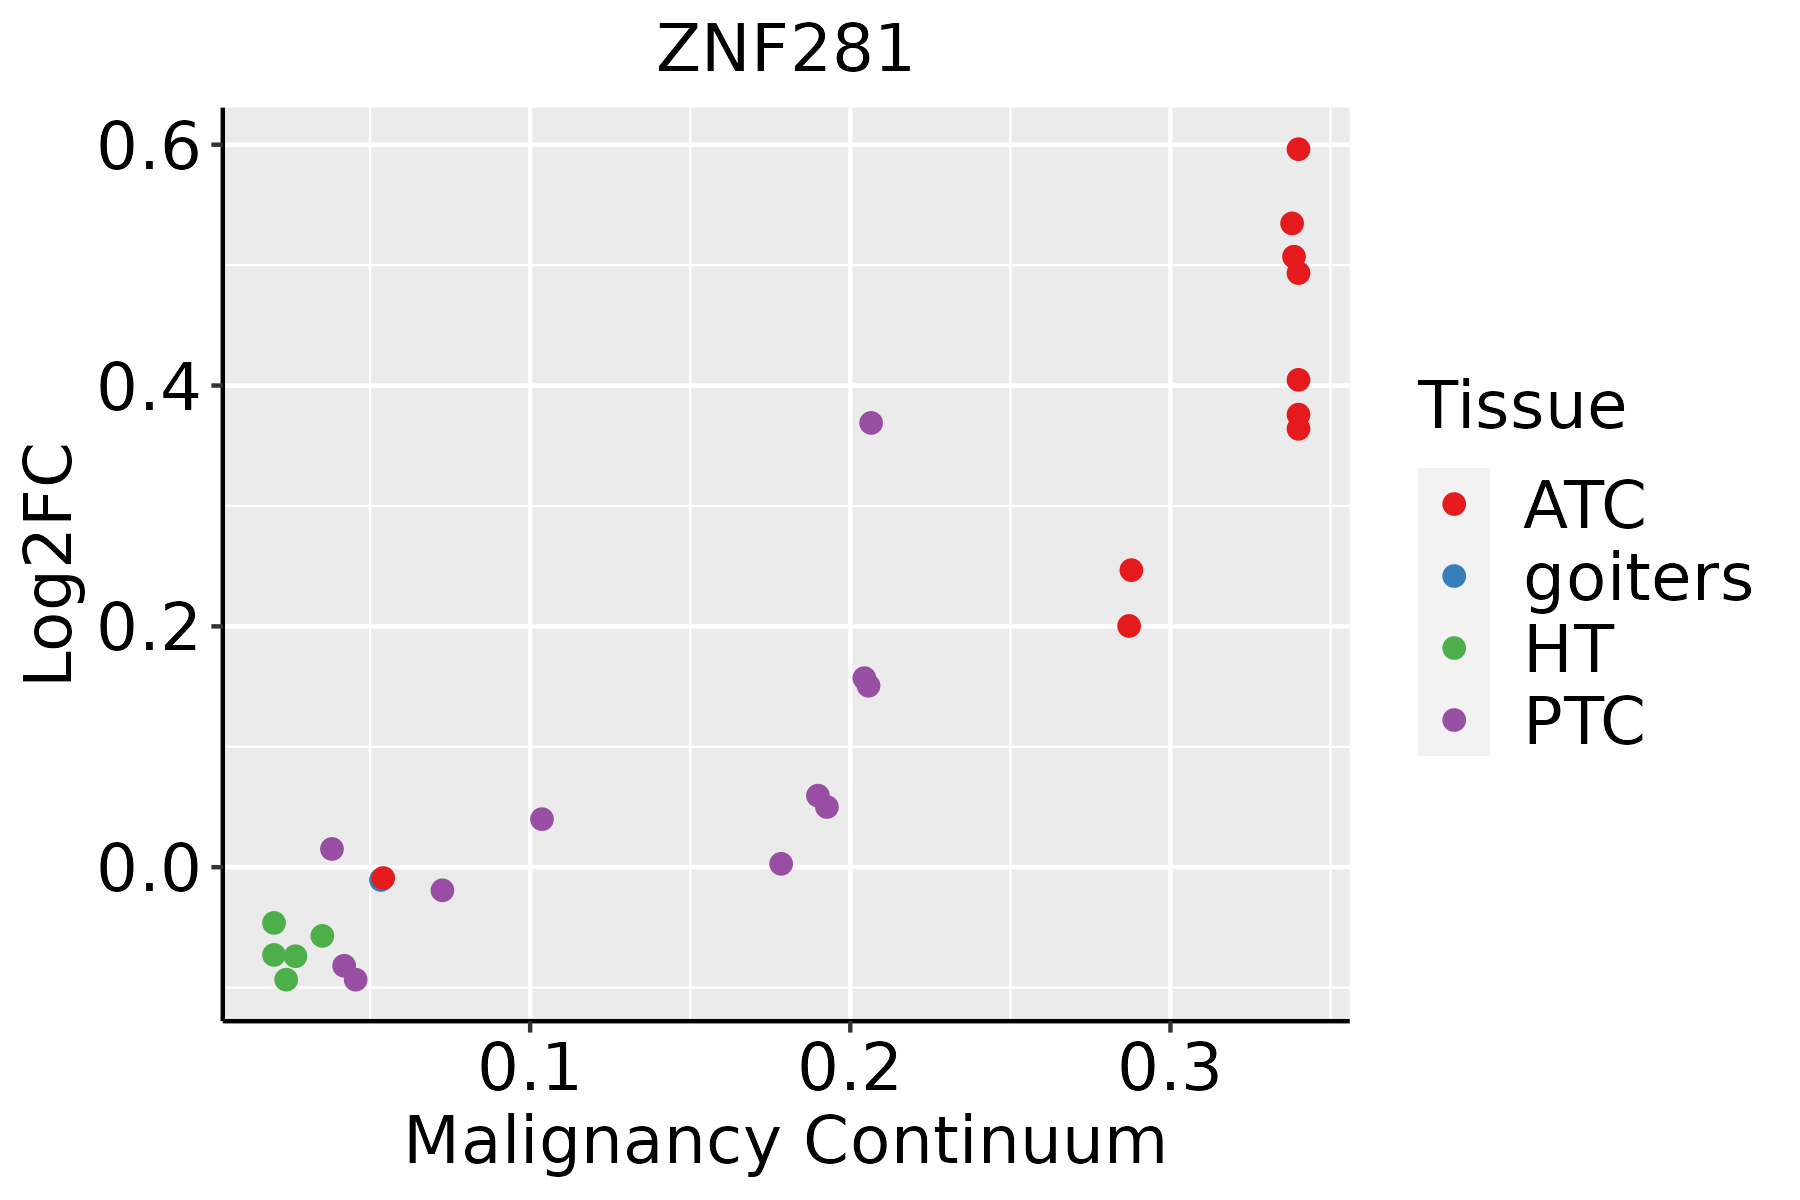 | ATC: Anaplastic thyroid cancer |
| HT: Hashimoto's thyroiditis | ||
| PTC: Papillary thyroid cancer |
| ∗log2FC in expression of this searched gene in stem-like cells from each diseased tissue sample relative to stem-like cells in normal samples in each tissue plotted against the malignancy continuum. Samples are colored based on if they are from different disease stage. |
Top |
Malignant transformation related pathway analysis |
| Find out the enriched GO biological processes and KEGG pathways involved in transition from healthy to precancer to cancer |
| Tissue | Disease Stage | Enriched GO biological Processes |
| Colorectum | AD |  |
| Colorectum | SER |  |
| Colorectum | MSS |  |
| Colorectum | MSI-H |  |
| Colorectum | FAP |  |
| ∗Top 15 enriched GO BP terms are showed in the bar plot of each disease state in each tissue. Each row represents a significant GO biological process which is colored according to the -log10(p.adjust). |
| Page: 1 2 3 4 5 6 7 8 9 |
| GO ID | Tissue | Disease Stage | Description | Gene Ratio | Bg Ratio | pvalue | p.adjust | Count |
| GO:00488638 | Esophagus | ESCC | stem cell differentiation | 122/8552 | 206/18723 | 5.95e-05 | 4.59e-04 | 122 |
| GO:00101711 | Esophagus | ESCC | body morphogenesis | 30/8552 | 43/18723 | 1.21e-03 | 5.88e-03 | 30 |
| GO:004886311 | Liver | Cirrhotic | stem cell differentiation | 66/4634 | 206/18723 | 1.06e-02 | 4.68e-02 | 66 |
| GO:00488637 | Oral cavity | OSCC | stem cell differentiation | 96/7305 | 206/18723 | 1.55e-02 | 4.99e-02 | 96 |
| GO:00101713 | Thyroid | PTC | body morphogenesis | 23/5968 | 43/18723 | 2.66e-03 | 1.35e-02 | 23 |
| GO:004886318 | Thyroid | PTC | stem cell differentiation | 85/5968 | 206/18723 | 2.71e-03 | 1.36e-02 | 85 |
| GO:001017111 | Thyroid | ATC | body morphogenesis | 28/6293 | 43/18723 | 2.35e-05 | 2.06e-04 | 28 |
| GO:004886321 | Thyroid | ATC | stem cell differentiation | 97/6293 | 206/18723 | 3.88e-05 | 3.15e-04 | 97 |
| Page: 1 |
| Pathway ID | Tissue | Disease Stage | Description | Gene Ratio | Bg Ratio | pvalue | p.adjust | qvalue | Count |
| Page: 1 |
Top |
Cell-cell communication analysis |
| Identification of potential cell-cell interactions between two cell types and their ligand-receptor pairs for different disease states |
| Ligand | Receptor | LRpair | Pathway | Tissue | Disease Stage |
| Page: 1 |
Top |
Single-cell gene regulatory network inference analysis |
| Find out the significant the regulons (TFs) and the target genes of each regulon across cell types for different disease states |
| TF | Cell Type | Tissue | Disease Stage | Target Gene | RSS | Regulon Activity |
| ZNF281 | INMON | Breast | DCIS | THBS1,EREG,ZC3H12C, etc. | 4.99e-02 |  |
| ZNF281 | cDC | Lung | MIAC | MAL,KLHL42,AL450998.2, etc. | 3.46e-02 |  |
| ZNF281 | NEUT | Lung | MIAC | MAL,KLHL42,AL450998.2, etc. | 8.38e-02 | |
| ∗The dot plots of a searched regulon are shown for all cell subpopulations in each disease state of each tissue based on the regulon specific score inferred using pySCENIC and by calculating the average expression. |
| Page: 1 |
Top |
Somatic mutation of malignant transformation related genes |
| Annotation of somatic variants for genes involved in malignant transformation |
| Hugo Symbol | Variant Class | Variant Classification | dbSNP RS | HGVSc | HGVSp | HGVSp Short | SWISSPROT | BIOTYPE | SIFT | PolyPhen | Tumor Sample Barcode | Tissue | Histology | Sex | Age | Stage | Therapy Types | Drugs | Outcome |
| ZNF281 | SNV | Missense_Mutation | c.2006N>G | p.Ser669Cys | p.S669C | Q9Y2X9 | protein_coding | deleterious(0) | probably_damaging(0.987) | TCGA-A8-A07B-01 | Breast | breast invasive carcinoma | Female | >=65 | I/II | Unknown | Unknown | SD | |
| ZNF281 | SNV | Missense_Mutation | c.715N>A | p.Ala239Thr | p.A239T | Q9Y2X9 | protein_coding | tolerated(0.55) | possibly_damaging(0.749) | TCGA-AO-A128-01 | Breast | breast invasive carcinoma | Female | <65 | I/II | Chemotherapy | doxorubicin | SD | |
| ZNF281 | SNV | Missense_Mutation | novel | c.919C>T | p.His307Tyr | p.H307Y | Q9Y2X9 | protein_coding | deleterious(0) | probably_damaging(0.998) | TCGA-AO-A1KR-01 | Breast | breast invasive carcinoma | Female | <65 | I/II | Chemotherapy | cyclophosphamide | SD |
| ZNF281 | SNV | Missense_Mutation | c.1318G>C | p.Glu440Gln | p.E440Q | Q9Y2X9 | protein_coding | deleterious(0.03) | possibly_damaging(0.446) | TCGA-C8-A1HM-01 | Breast | breast invasive carcinoma | Female | >=65 | I/II | Chemotherapy | doxorubicin | CR | |
| ZNF281 | SNV | Missense_Mutation | c.611N>T | p.Asp204Val | p.D204V | Q9Y2X9 | protein_coding | tolerated(0.19) | benign(0.023) | TCGA-D8-A140-01 | Breast | breast invasive carcinoma | Female | <65 | I/II | Chemotherapy | doxorubicin+cyclophosphamid | SD | |
| ZNF281 | SNV | Missense_Mutation | c.782N>G | p.His261Arg | p.H261R | Q9Y2X9 | protein_coding | deleterious(0) | probably_damaging(0.991) | TCGA-E9-A1RB-01 | Breast | breast invasive carcinoma | Female | <65 | I/II | Chemotherapy | methotrexate | SD | |
| ZNF281 | insertion | Nonsense_Mutation | novel | c.383_384insGTCAGAAACCTCATATCTGTGATCACTGTAGTG | p.Lys128_Gln129insSerGluThrSerTyrLeuTerSerLeuTerTer | p.K128_Q129insSETSYL*SL** | Q9Y2X9 | protein_coding | TCGA-A8-A07P-01 | Breast | breast invasive carcinoma | Female | >=65 | I/II | Chemotherapy | 5-fluorouracil | SD | ||
| ZNF281 | SNV | Missense_Mutation | novel | c.2486A>G | p.Glu829Gly | p.E829G | Q9Y2X9 | protein_coding | tolerated(0.06) | probably_damaging(0.994) | TCGA-2W-A8YY-01 | Cervix | cervical & endocervical cancer | Female | <65 | I/II | Chemotherapy | cisplatin | CR |
| ZNF281 | SNV | Missense_Mutation | novel | c.1076N>C | p.Arg359Thr | p.R359T | Q9Y2X9 | protein_coding | deleterious(0) | benign(0.32) | TCGA-C5-A8XK-01 | Cervix | cervical & endocervical cancer | Female | <65 | I/II | Chemotherapy | cisplatin | SD |
| ZNF281 | SNV | Missense_Mutation | c.2497C>G | p.Gln833Glu | p.Q833E | Q9Y2X9 | protein_coding | deleterious(0) | probably_damaging(0.956) | TCGA-EK-A2PG-01 | Cervix | cervical & endocervical cancer | Female | >=65 | I/II | Unknown | Unknown | SD |
| Page: 1 2 3 4 5 6 7 8 9 |
Top |
Related drugs of malignant transformation related genes |
| Identification of chemicals and drugs interact with genes involved in malignant transfromation |
| (DGIdb 4.0) |
| Entrez ID | Symbol | Category | Interaction Types | Drug Claim Name | Drug Name | PMIDs |
| Page: 1 |

Copyright 2023-Present -The University of Texas Health Science Center at Houston |