
|
|||||
|
 | |
| |
| |
| |
| |
| |
|
Gene: ZNF28 |
Gene summary for ZNF28 |
| Gene information | Species | Human | Gene symbol | ZNF28 | Gene ID | 7576 |
| Gene name | zinc finger protein 28 | |
| Gene Alias | KOX24 | |
| Cytomap | 19q13.41 | |
| Gene Type | protein-coding | GO ID | GO:0006139 | UniProtAcc | P17035 |
Top |
Malignant transformation analysis |
| Identification of the aberrant gene expression in precancerous and cancerous lesions by comparing the gene expression of stem-like cells in diseased tissues with normal stem cells |
| Entrez ID | Symbol | Replicates | Species | Organ | Tissue | Adj P-value | Log2FC | Malignancy |
| 7576 | ZNF28 | HCC1_Meng | Human | Liver | HCC | 2.43e-48 | 6.36e-02 | 0.0246 |
| 7576 | ZNF28 | HCC1 | Human | Liver | HCC | 1.50e-02 | 2.64e+00 | 0.5336 |
| 7576 | ZNF28 | HCC2 | Human | Liver | HCC | 3.70e-08 | 2.41e+00 | 0.5341 |
| 7576 | ZNF28 | S015 | Human | Liver | HCC | 5.56e-06 | 2.53e-01 | 0.2375 |
| Page: 1 |
| Tissue | Expression Dynamics | Abbreviation |
| Liver | 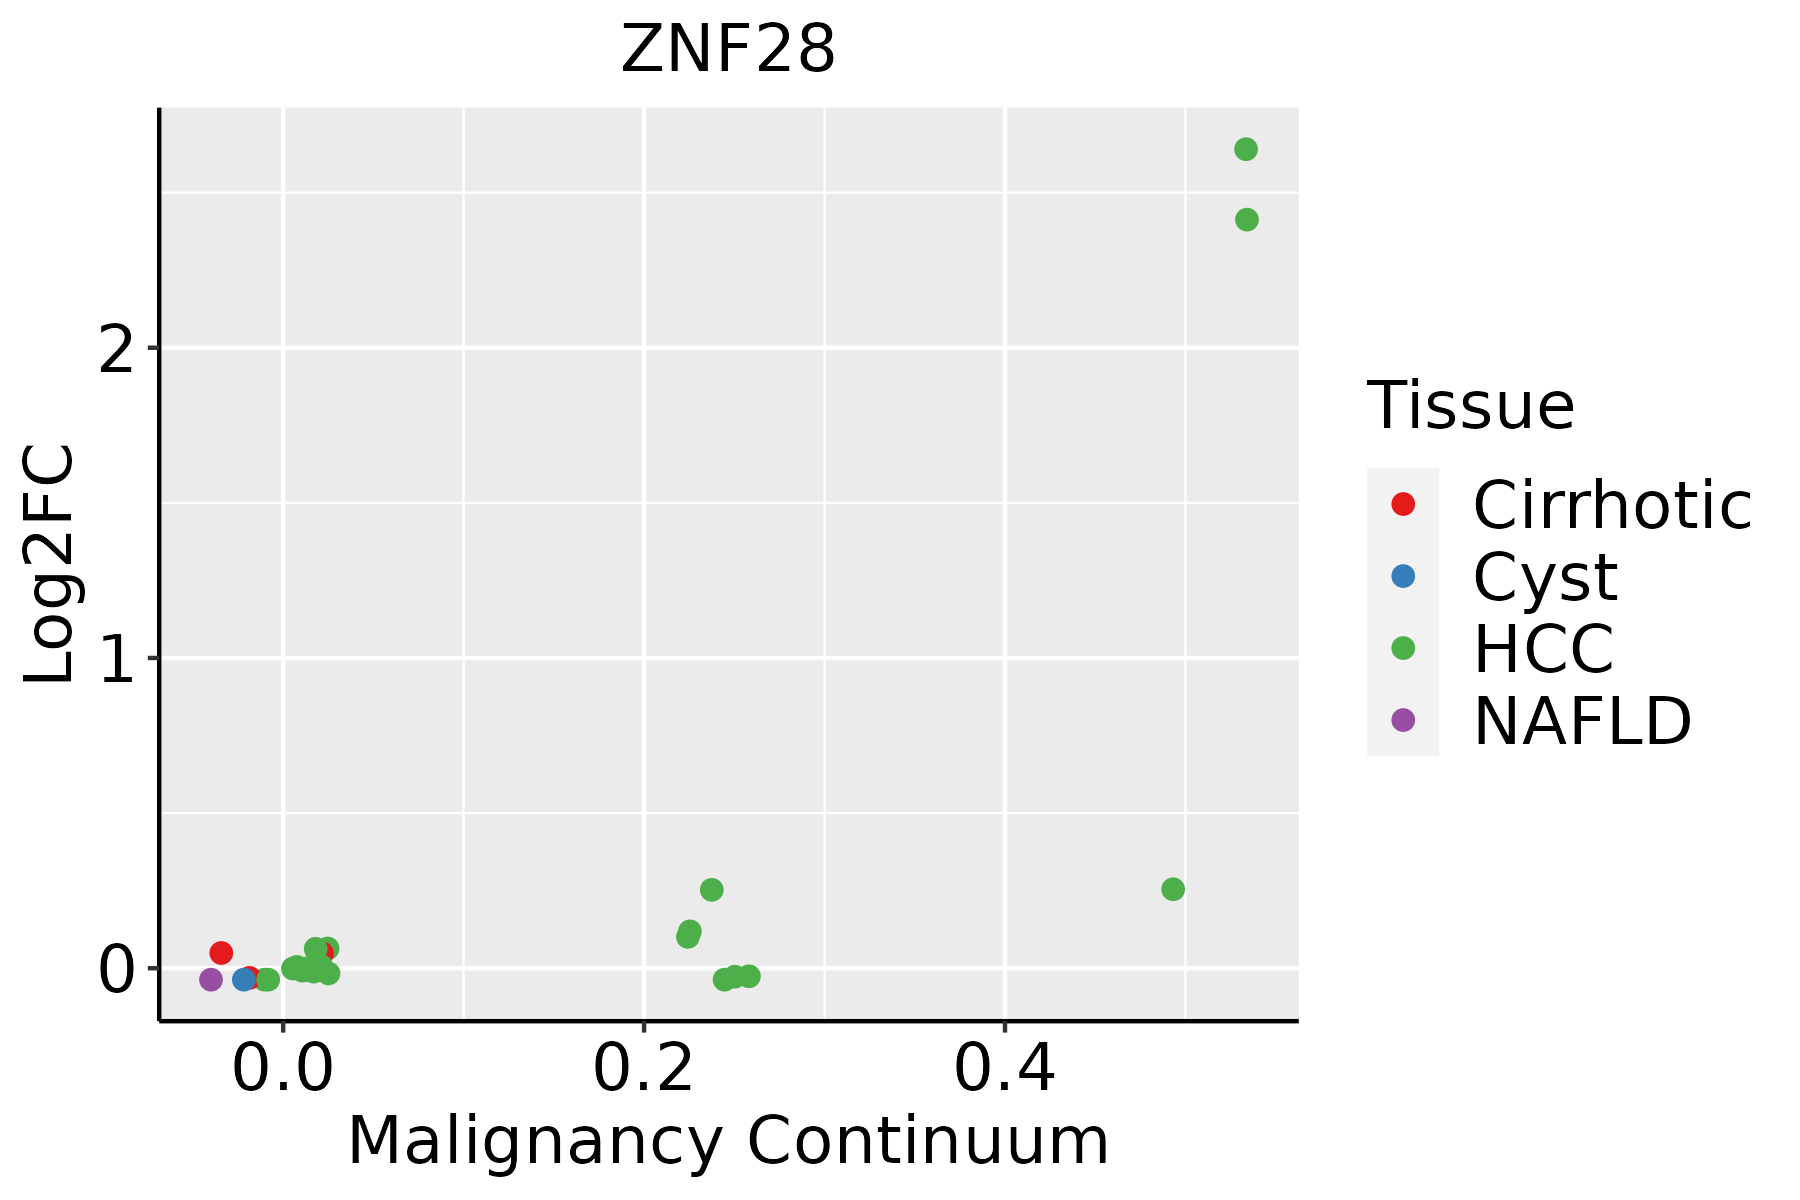 | HCC: Hepatocellular carcinoma |
| NAFLD: Non-alcoholic fatty liver disease |
| ∗log2FC in expression of this searched gene in stem-like cells from each diseased tissue sample relative to stem-like cells in normal samples in each tissue plotted against the malignancy continuum. Samples are colored based on if they are from different disease stage. |
Top |
Malignant transformation related pathway analysis |
| Find out the enriched GO biological processes and KEGG pathways involved in transition from healthy to precancer to cancer |
| Tissue | Disease Stage | Enriched GO biological Processes |
| Colorectum | AD |  |
| Colorectum | SER |  |
| Colorectum | MSS |  |
| Colorectum | MSI-H |  |
| Colorectum | FAP |  |
| ∗Top 15 enriched GO BP terms are showed in the bar plot of each disease state in each tissue. Each row represents a significant GO biological process which is colored according to the -log10(p.adjust). |
| Page: 1 2 3 4 5 6 7 8 9 |
| GO ID | Tissue | Disease Stage | Description | Gene Ratio | Bg Ratio | pvalue | p.adjust | Count |
| GO:00488638 | Esophagus | ESCC | stem cell differentiation | 122/8552 | 206/18723 | 5.95e-05 | 4.59e-04 | 122 |
| GO:00101711 | Esophagus | ESCC | body morphogenesis | 30/8552 | 43/18723 | 1.21e-03 | 5.88e-03 | 30 |
| GO:004886311 | Liver | Cirrhotic | stem cell differentiation | 66/4634 | 206/18723 | 1.06e-02 | 4.68e-02 | 66 |
| GO:00488637 | Oral cavity | OSCC | stem cell differentiation | 96/7305 | 206/18723 | 1.55e-02 | 4.99e-02 | 96 |
| GO:00101713 | Thyroid | PTC | body morphogenesis | 23/5968 | 43/18723 | 2.66e-03 | 1.35e-02 | 23 |
| GO:004886318 | Thyroid | PTC | stem cell differentiation | 85/5968 | 206/18723 | 2.71e-03 | 1.36e-02 | 85 |
| GO:001017111 | Thyroid | ATC | body morphogenesis | 28/6293 | 43/18723 | 2.35e-05 | 2.06e-04 | 28 |
| GO:004886321 | Thyroid | ATC | stem cell differentiation | 97/6293 | 206/18723 | 3.88e-05 | 3.15e-04 | 97 |
| Page: 1 |
| Pathway ID | Tissue | Disease Stage | Description | Gene Ratio | Bg Ratio | pvalue | p.adjust | qvalue | Count |
| Page: 1 |
Top |
Cell-cell communication analysis |
| Identification of potential cell-cell interactions between two cell types and their ligand-receptor pairs for different disease states |
| Ligand | Receptor | LRpair | Pathway | Tissue | Disease Stage |
| Page: 1 |
Top |
Single-cell gene regulatory network inference analysis |
| Find out the significant the regulons (TFs) and the target genes of each regulon across cell types for different disease states |
| TF | Cell Type | Tissue | Disease Stage | Target Gene | RSS | Regulon Activity |
| ZNF28 | LYMEND | Colorectum | AD | SEM1,EMCN,NUAK1, etc. | 0.00e+00 |  |
| ZNF28 | MVA | Colorectum | ADJ | SEM1,EMCN,NUAK1, etc. | 0.00e+00 |  |
| ZNF28 | PCV | Colorectum | CRC | SEM1,EMCN,NUAK1, etc. | 0.00e+00 |  |
| ZNF28 | GLIA | Colorectum | CRC | SEM1,EMCN,NUAK1, etc. | 0.00e+00 | |
| ZNF28 | MVA | Colorectum | FAP | SEM1,EMCN,NUAK1, etc. | 2.22e-16 |  |
| ZNF28 | ADIPO | Colorectum | FAP | SEM1,EMCN,NUAK1, etc. | 4.44e-16 | |
| ZNF28 | ICAF | Colorectum | FAP | SEM1,EMCN,NUAK1, etc. | 2.22e-16 | |
| ZNF28 | PCV | Colorectum | FAP | SEM1,EMCN,NUAK1, etc. | 2.22e-16 | |
| ZNF28 | MVA | Colorectum | Healthy | SEM1,EMCN,NUAK1, etc. | 0.00e+00 |  |
| ZNF28 | ADIPO | Colorectum | Healthy | SEM1,EMCN,NUAK1, etc. | 1.78e-02 | |
| ∗The dot plots of a searched regulon are shown for all cell subpopulations in each disease state of each tissue based on the regulon specific score inferred using pySCENIC and by calculating the average expression. |
| Page: 1 |
Top |
Somatic mutation of malignant transformation related genes |
| Annotation of somatic variants for genes involved in malignant transformation |
| Hugo Symbol | Variant Class | Variant Classification | dbSNP RS | HGVSc | HGVSp | HGVSp Short | SWISSPROT | BIOTYPE | SIFT | PolyPhen | Tumor Sample Barcode | Tissue | Histology | Sex | Age | Stage | Therapy Types | Drugs | Outcome |
| ZNF28 | SNV | Missense_Mutation | c.1297N>T | p.His433Tyr | p.H433Y | P17035 | protein_coding | deleterious(0) | probably_damaging(0.981) | TCGA-BH-A0HP-01 | Breast | breast invasive carcinoma | Female | >=65 | III/IV | Chemotherapy | doxorubicin | SD | |
| ZNF28 | SNV | Missense_Mutation | c.1636N>G | p.Thr546Ala | p.T546A | P17035 | protein_coding | deleterious(0) | benign(0.112) | TCGA-BH-A18G-01 | Breast | breast invasive carcinoma | Female | >=65 | I/II | Unknown | Unknown | SD | |
| ZNF28 | SNV | Missense_Mutation | c.700C>G | p.Gln234Glu | p.Q234E | P17035 | protein_coding | deleterious(0.04) | possibly_damaging(0.68) | TCGA-E2-A10C-01 | Breast | breast invasive carcinoma | Female | <65 | I/II | Chemotherapy | cytoxan | SD | |
| ZNF28 | SNV | Missense_Mutation | novel | c.1964N>T | p.Arg655Met | p.R655M | P17035 | protein_coding | deleterious(0.03) | possibly_damaging(0.575) | TCGA-2W-A8YY-01 | Cervix | cervical & endocervical cancer | Female | <65 | I/II | Chemotherapy | cisplatin | CR |
| ZNF28 | SNV | Missense_Mutation | novel | c.898G>A | p.Glu300Lys | p.E300K | P17035 | protein_coding | tolerated(1) | benign(0.003) | TCGA-C5-A2LZ-01 | Cervix | cervical & endocervical cancer | Female | >=65 | III/IV | Unknown | Unknown | PD |
| ZNF28 | SNV | Missense_Mutation | novel | c.460N>G | p.Phe154Val | p.F154V | P17035 | protein_coding | deleterious(0.03) | benign(0.242) | TCGA-PN-A8MA-01 | Cervix | cervical & endocervical cancer | Female | <65 | I/II | Chemotherapy | cisplatin | SD |
| ZNF28 | SNV | Missense_Mutation | c.322G>C | p.Asp108His | p.D108H | P17035 | protein_coding | tolerated(0.52) | benign(0.121) | TCGA-Q1-A5R2-01 | Cervix | cervical & endocervical cancer | Female | <65 | I/II | Chemotherapy | cisplatin | PR | |
| ZNF28 | SNV | Missense_Mutation | c.1424T>G | p.Val475Gly | p.V475G | P17035 | protein_coding | deleterious(0.05) | possibly_damaging(0.5) | TCGA-AA-3673-01 | Colorectum | colon adenocarcinoma | Female | <65 | I/II | Unknown | Unknown | SD | |
| ZNF28 | SNV | Missense_Mutation | c.778N>C | p.Cys260Arg | p.C260R | P17035 | protein_coding | tolerated(0.47) | benign(0.001) | TCGA-AA-3685-01 | Colorectum | colon adenocarcinoma | Male | >=65 | I/II | Unknown | Unknown | SD | |
| ZNF28 | SNV | Missense_Mutation | c.2062G>A | p.Glu688Lys | p.E688K | P17035 | protein_coding | deleterious(0.04) | benign(0.062) | TCGA-AA-A00N-01 | Colorectum | colon adenocarcinoma | Male | >=65 | I/II | Unknown | Unknown | PD |
| Page: 1 2 3 4 5 6 7 8 9 |
Top |
Related drugs of malignant transformation related genes |
| Identification of chemicals and drugs interact with genes involved in malignant transfromation |
| (DGIdb 4.0) |
| Entrez ID | Symbol | Category | Interaction Types | Drug Claim Name | Drug Name | PMIDs |
| Page: 1 |

Copyright 2023-Present -The University of Texas Health Science Center at Houston |