
|
|||||
|
 | |
| |
| |
| |
| |
| |
|
Gene: ZNF277 |
Gene summary for ZNF277 |
| Gene information | Species | Human | Gene symbol | ZNF277 | Gene ID | 11179 |
| Gene name | zinc finger protein 277 | |
| Gene Alias | NRIF4 | |
| Cytomap | 7q31.1 | |
| Gene Type | protein-coding | GO ID | GO:0000302 | UniProtAcc | Q9NRM2 |
Top |
Malignant transformation analysis |
| Identification of the aberrant gene expression in precancerous and cancerous lesions by comparing the gene expression of stem-like cells in diseased tissues with normal stem cells |
| Entrez ID | Symbol | Replicates | Species | Organ | Tissue | Adj P-value | Log2FC | Malignancy |
| 11179 | ZNF277 | LZE4T | Human | Esophagus | ESCC | 5.03e-05 | 1.12e-01 | 0.0811 |
| 11179 | ZNF277 | LZE22T | Human | Esophagus | ESCC | 5.19e-04 | 2.81e-01 | 0.068 |
| 11179 | ZNF277 | LZE24T | Human | Esophagus | ESCC | 1.92e-19 | 3.69e-01 | 0.0596 |
| 11179 | ZNF277 | LZE21T | Human | Esophagus | ESCC | 2.22e-03 | 1.25e-01 | 0.0655 |
| 11179 | ZNF277 | P1T-E | Human | Esophagus | ESCC | 4.02e-14 | 2.84e-01 | 0.0875 |
| 11179 | ZNF277 | P2T-E | Human | Esophagus | ESCC | 2.80e-11 | 1.71e-01 | 0.1177 |
| 11179 | ZNF277 | P4T-E | Human | Esophagus | ESCC | 1.09e-15 | 3.78e-01 | 0.1323 |
| 11179 | ZNF277 | P5T-E | Human | Esophagus | ESCC | 1.61e-09 | 1.92e-01 | 0.1327 |
| 11179 | ZNF277 | P8T-E | Human | Esophagus | ESCC | 1.81e-16 | 2.06e-01 | 0.0889 |
| 11179 | ZNF277 | P9T-E | Human | Esophagus | ESCC | 2.49e-12 | 2.86e-01 | 0.1131 |
| 11179 | ZNF277 | P10T-E | Human | Esophagus | ESCC | 3.04e-16 | 2.96e-01 | 0.116 |
| 11179 | ZNF277 | P11T-E | Human | Esophagus | ESCC | 2.25e-11 | 2.95e-01 | 0.1426 |
| 11179 | ZNF277 | P12T-E | Human | Esophagus | ESCC | 2.15e-30 | 6.24e-01 | 0.1122 |
| 11179 | ZNF277 | P15T-E | Human | Esophagus | ESCC | 3.27e-38 | 1.01e+00 | 0.1149 |
| 11179 | ZNF277 | P16T-E | Human | Esophagus | ESCC | 1.15e-18 | 2.59e-01 | 0.1153 |
| 11179 | ZNF277 | P19T-E | Human | Esophagus | ESCC | 2.14e-03 | 3.82e-01 | 0.1662 |
| 11179 | ZNF277 | P20T-E | Human | Esophagus | ESCC | 5.70e-38 | 1.01e+00 | 0.1124 |
| 11179 | ZNF277 | P21T-E | Human | Esophagus | ESCC | 1.76e-22 | 4.08e-01 | 0.1617 |
| 11179 | ZNF277 | P22T-E | Human | Esophagus | ESCC | 1.04e-12 | 2.06e-01 | 0.1236 |
| 11179 | ZNF277 | P23T-E | Human | Esophagus | ESCC | 5.31e-16 | 2.02e-01 | 0.108 |
| Page: 1 2 3 4 5 |
| Tissue | Expression Dynamics | Abbreviation |
| Esophagus | 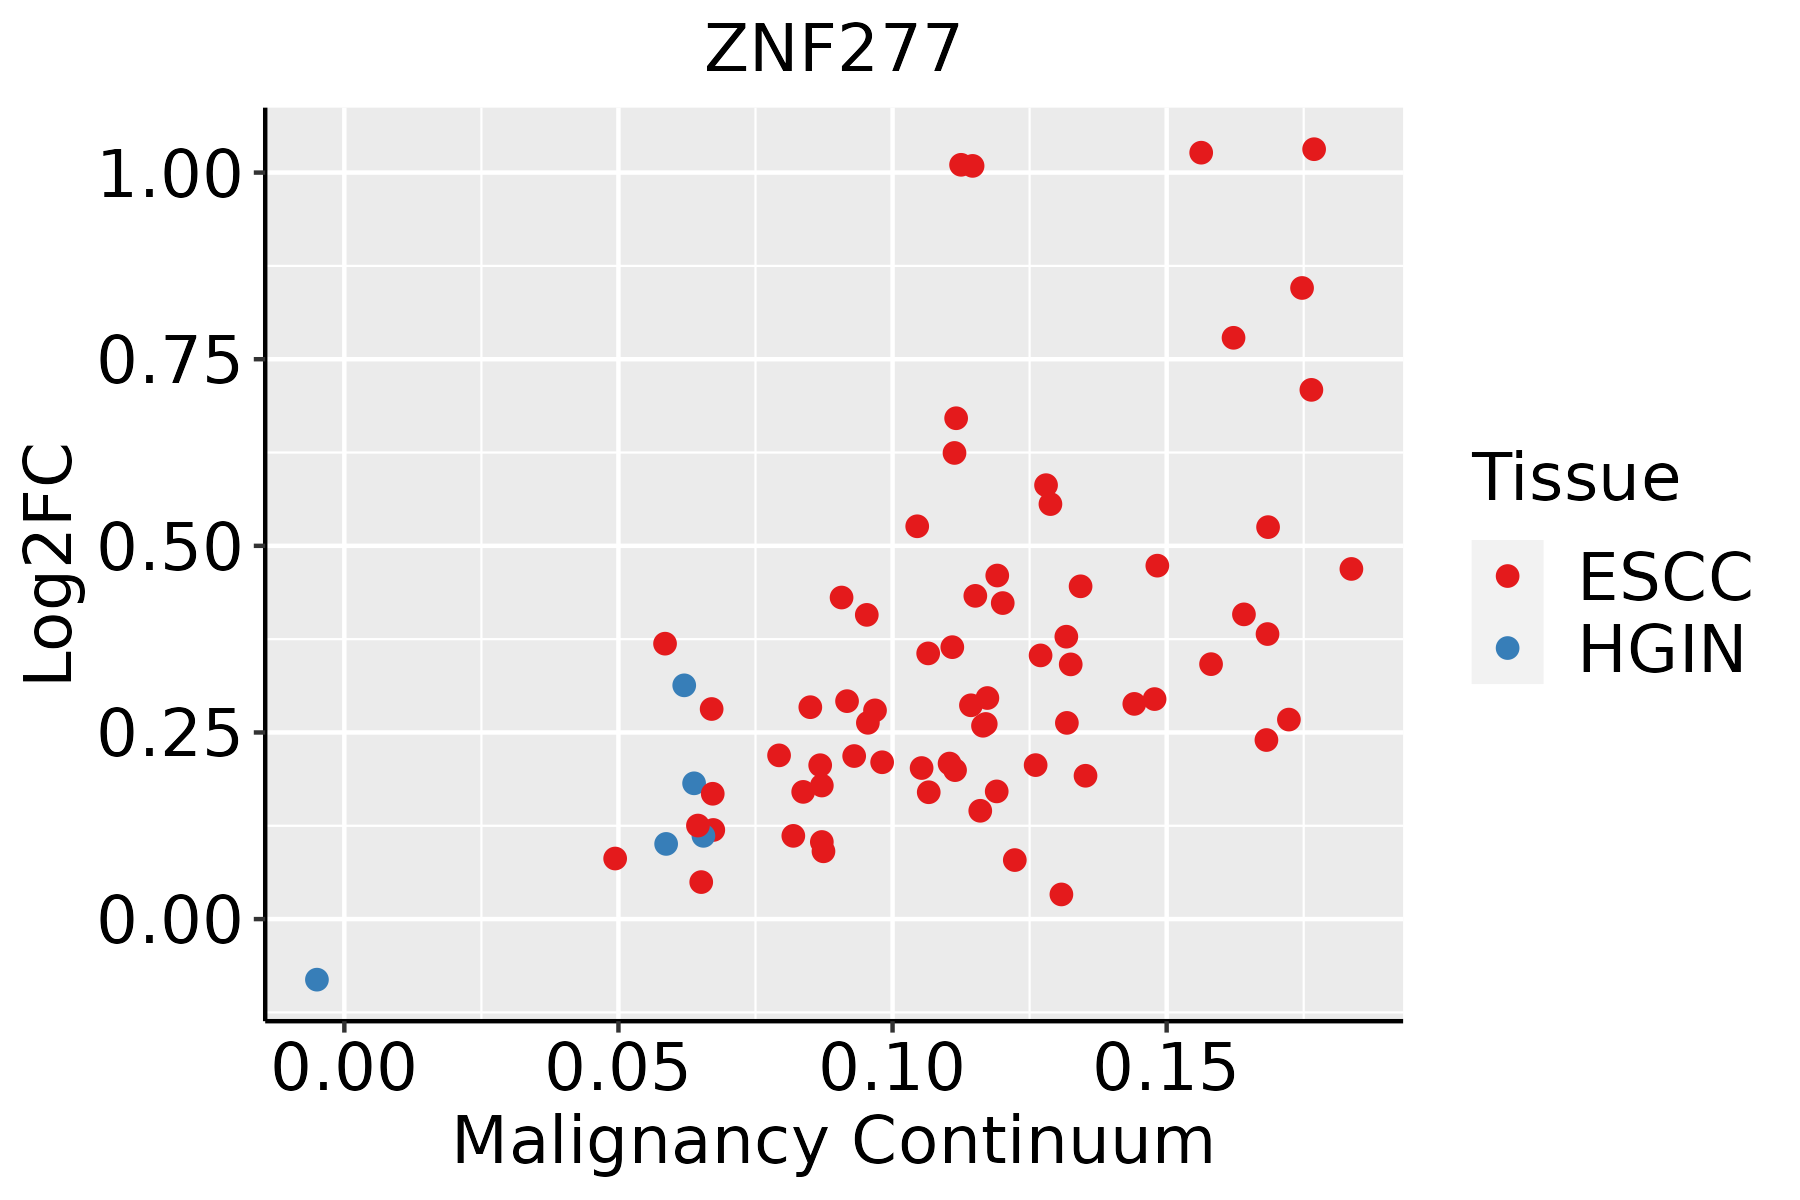 | ESCC: Esophageal squamous cell carcinoma |
| HGIN: High-grade intraepithelial neoplasias | ||
| LGIN: Low-grade intraepithelial neoplasias | ||
| Liver | 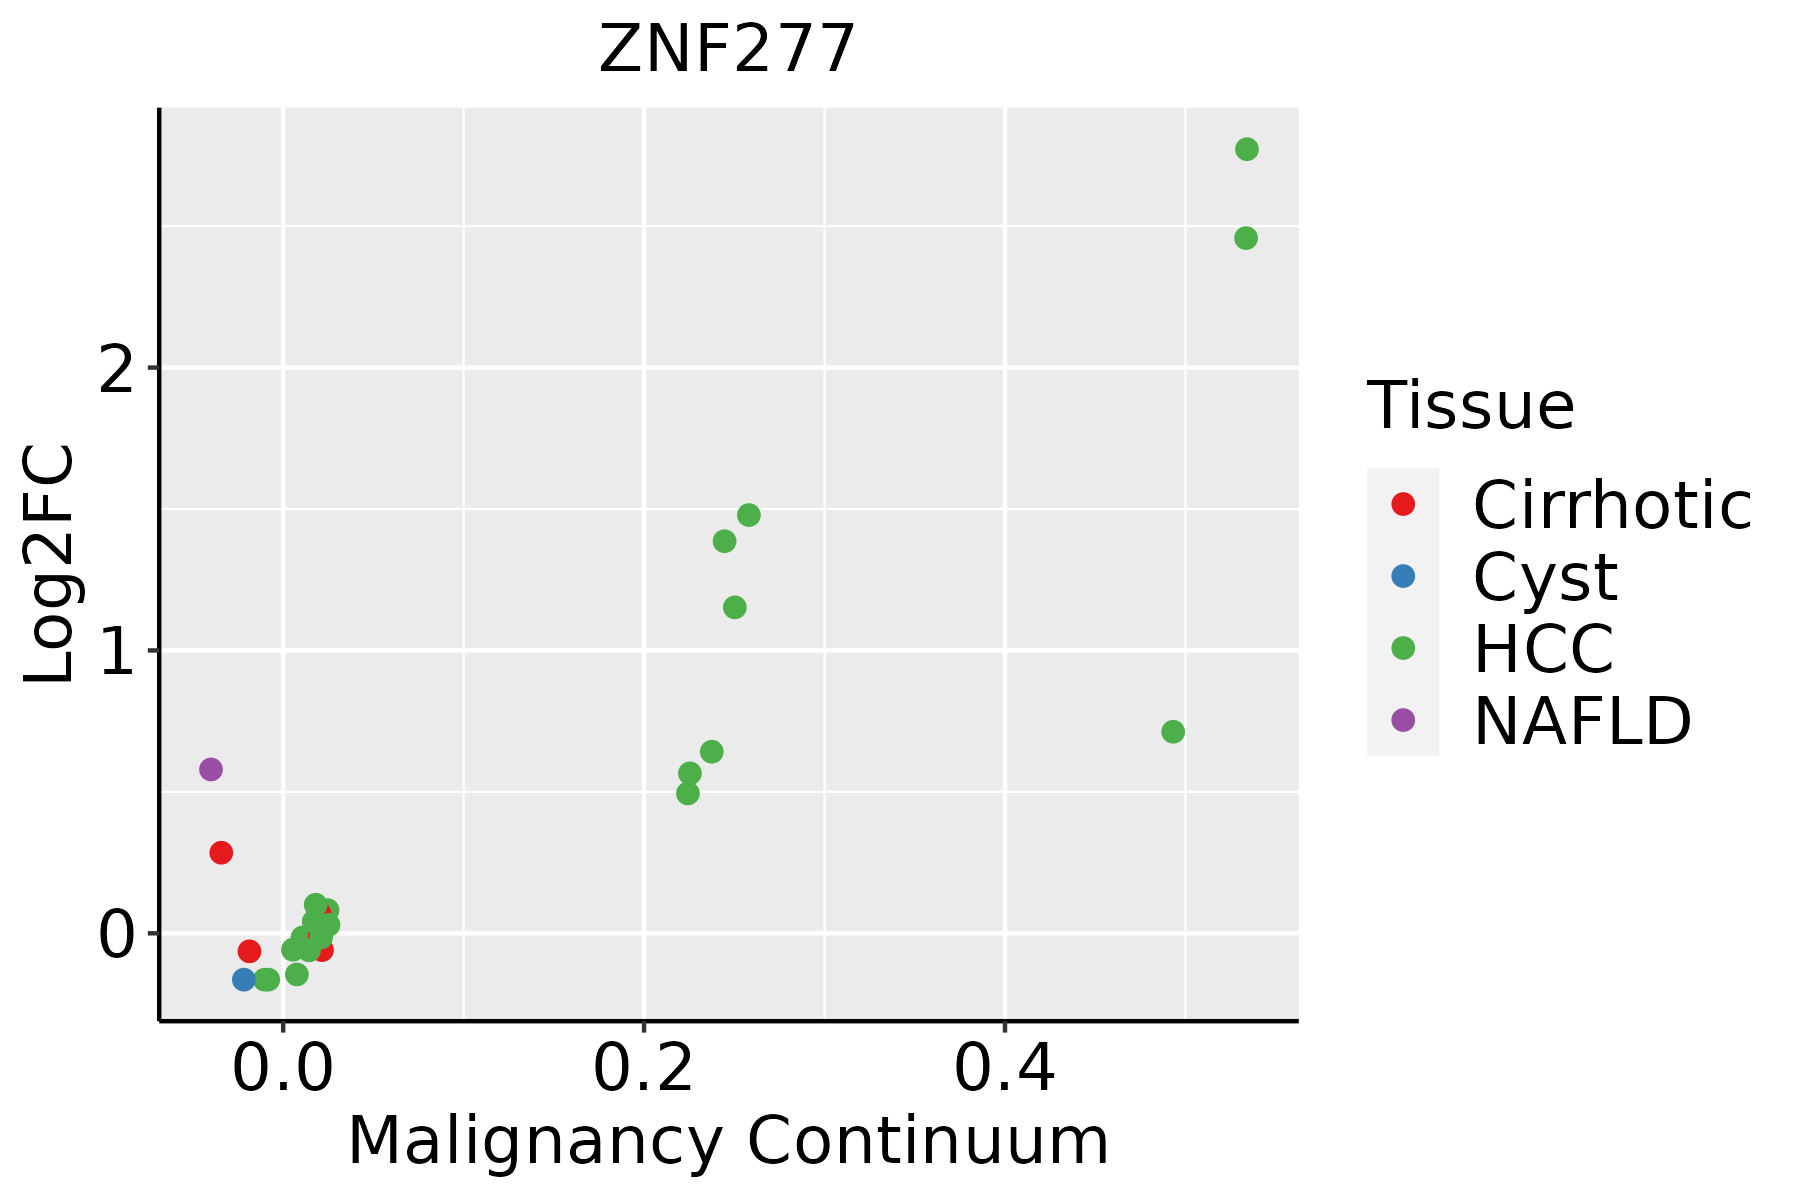 | HCC: Hepatocellular carcinoma |
| NAFLD: Non-alcoholic fatty liver disease | ||
| Lung |  | AAH: Atypical adenomatous hyperplasia |
| AIS: Adenocarcinoma in situ | ||
| IAC: Invasive lung adenocarcinoma | ||
| MIA: Minimally invasive adenocarcinoma | ||
| Oral Cavity |  | EOLP: Erosive Oral lichen planus |
| LP: leukoplakia | ||
| NEOLP: Non-erosive oral lichen planus | ||
| OSCC: Oral squamous cell carcinoma |
| ∗log2FC in expression of this searched gene in stem-like cells from each diseased tissue sample relative to stem-like cells in normal samples in each tissue plotted against the malignancy continuum. Samples are colored based on if they are from different disease stage. |
Top |
Malignant transformation related pathway analysis |
| Find out the enriched GO biological processes and KEGG pathways involved in transition from healthy to precancer to cancer |
| Tissue | Disease Stage | Enriched GO biological Processes |
| Colorectum | AD |  |
| Colorectum | SER |  |
| Colorectum | MSS |  |
| Colorectum | MSI-H |  |
| Colorectum | FAP |  |
| ∗Top 15 enriched GO BP terms are showed in the bar plot of each disease state in each tissue. Each row represents a significant GO biological process which is colored according to the -log10(p.adjust). |
| Page: 1 2 3 4 5 6 7 8 9 |
| GO ID | Tissue | Disease Stage | Description | Gene Ratio | Bg Ratio | pvalue | p.adjust | Count |
| GO:0006979111 | Esophagus | ESCC | response to oxidative stress | 303/8552 | 446/18723 | 7.15e-22 | 1.30e-19 | 303 |
| GO:0062197111 | Esophagus | ESCC | cellular response to chemical stress | 234/8552 | 337/18723 | 5.37e-19 | 5.97e-17 | 234 |
| GO:0034599111 | Esophagus | ESCC | cellular response to oxidative stress | 197/8552 | 288/18723 | 3.76e-15 | 2.15e-13 | 197 |
| GO:0000302111 | Esophagus | ESCC | response to reactive oxygen species | 150/8552 | 222/18723 | 3.06e-11 | 1.02e-09 | 150 |
| GO:0042542111 | Esophagus | ESCC | response to hydrogen peroxide | 102/8552 | 146/18723 | 2.64e-09 | 5.81e-08 | 102 |
| GO:003461420 | Esophagus | ESCC | cellular response to reactive oxygen species | 103/8552 | 155/18723 | 1.34e-07 | 2.17e-06 | 103 |
| GO:000756820 | Esophagus | ESCC | aging | 201/8552 | 339/18723 | 2.64e-07 | 3.94e-06 | 201 |
| GO:00703018 | Esophagus | ESCC | cellular response to hydrogen peroxide | 68/8552 | 98/18723 | 1.70e-06 | 2.03e-05 | 68 |
| GO:00075699 | Esophagus | ESCC | cell aging | 81/8552 | 132/18723 | 2.00e-04 | 1.27e-03 | 81 |
| GO:00903984 | Esophagus | ESCC | cellular senescence | 54/8552 | 93/18723 | 1.08e-02 | 3.67e-02 | 54 |
| GO:00069797 | Liver | NAFLD | response to oxidative stress | 78/1882 | 446/18723 | 7.85e-07 | 4.29e-05 | 78 |
| GO:00621977 | Liver | NAFLD | cellular response to chemical stress | 54/1882 | 337/18723 | 3.83e-04 | 5.73e-03 | 54 |
| GO:00425427 | Liver | NAFLD | response to hydrogen peroxide | 28/1882 | 146/18723 | 6.01e-04 | 7.97e-03 | 28 |
| GO:00003027 | Liver | NAFLD | response to reactive oxygen species | 38/1882 | 222/18723 | 7.63e-04 | 9.63e-03 | 38 |
| GO:00075687 | Liver | NAFLD | aging | 53/1882 | 339/18723 | 7.78e-04 | 9.77e-03 | 53 |
| GO:00345997 | Liver | NAFLD | cellular response to oxidative stress | 46/1882 | 288/18723 | 1.07e-03 | 1.25e-02 | 46 |
| GO:00075692 | Liver | NAFLD | cell aging | 23/1882 | 132/18723 | 6.18e-03 | 4.62e-02 | 23 |
| GO:000697922 | Liver | HCC | response to oxidative stress | 281/7958 | 446/18723 | 9.75e-19 | 1.24e-16 | 281 |
| GO:006219722 | Liver | HCC | cellular response to chemical stress | 216/7958 | 337/18723 | 6.86e-16 | 5.44e-14 | 216 |
| GO:003459922 | Liver | HCC | cellular response to oxidative stress | 183/7958 | 288/18723 | 3.65e-13 | 1.93e-11 | 183 |
| Page: 1 2 3 4 |
| Pathway ID | Tissue | Disease Stage | Description | Gene Ratio | Bg Ratio | pvalue | p.adjust | qvalue | Count |
| Page: 1 |
Top |
Cell-cell communication analysis |
| Identification of potential cell-cell interactions between two cell types and their ligand-receptor pairs for different disease states |
| Ligand | Receptor | LRpair | Pathway | Tissue | Disease Stage |
| Page: 1 |
Top |
Single-cell gene regulatory network inference analysis |
| Find out the significant the regulons (TFs) and the target genes of each regulon across cell types for different disease states |
| TF | Cell Type | Tissue | Disease Stage | Target Gene | RSS | Regulon Activity |
| ∗The dot plots of a searched regulon are shown for all cell subpopulations in each disease state of each tissue based on the regulon specific score inferred using pySCENIC and by calculating the average expression. |
| Page: 1 |
Top |
Somatic mutation of malignant transformation related genes |
| Annotation of somatic variants for genes involved in malignant transformation |
| Hugo Symbol | Variant Class | Variant Classification | dbSNP RS | HGVSc | HGVSp | HGVSp Short | SWISSPROT | BIOTYPE | SIFT | PolyPhen | Tumor Sample Barcode | Tissue | Histology | Sex | Age | Stage | Therapy Types | Drugs | Outcome |
| ZNF277 | SNV | Missense_Mutation | c.359N>A | p.Arg120Lys | p.R120K | Q9NRM2 | protein_coding | tolerated(0.43) | benign(0.017) | TCGA-AC-A23H-01 | Breast | breast invasive carcinoma | Female | >=65 | I/II | Unknown | Unknown | PD | |
| ZNF277 | SNV | Missense_Mutation | c.1321N>G | p.Gln441Glu | p.Q441E | Q9NRM2 | protein_coding | tolerated(0.08) | benign(0.003) | TCGA-AR-A24Q-01 | Breast | breast invasive carcinoma | Female | <65 | I/II | Chemotherapy | doxorubicin | SD | |
| ZNF277 | SNV | Missense_Mutation | c.49C>T | p.Arg17Cys | p.R17C | Q9NRM2 | protein_coding | tolerated_low_confidence(0.08) | benign(0) | TCGA-EW-A1PB-01 | Breast | breast invasive carcinoma | Female | >=65 | III/IV | Unknown | Unknown | SD | |
| ZNF277 | SNV | Missense_Mutation | novel | c.686N>C | p.Cys229Ser | p.C229S | Q9NRM2 | protein_coding | deleterious(0) | probably_damaging(0.999) | TCGA-LL-A8F5-01 | Breast | breast invasive carcinoma | Female | <65 | I/II | Chemotherapy | cyclophosphamide | SD |
| ZNF277 | insertion | Nonsense_Mutation | novel | c.43_44insTGGCTTCTTAATAGTCTCAACCCTAAAAGGAGTAACTGTC | p.Glu15ValfsTer4 | p.E15Vfs*4 | Q9NRM2 | protein_coding | TCGA-AN-A04C-01 | Breast | breast invasive carcinoma | Female | <65 | I/II | Unknown | Unknown | SD | ||
| ZNF277 | SNV | Missense_Mutation | c.86N>G | p.Tyr29Cys | p.Y29C | Q9NRM2 | protein_coding | tolerated_low_confidence(0.17) | benign(0) | TCGA-C5-A1ME-01 | Cervix | cervical & endocervical cancer | Female | <65 | I/II | Unknown | Unknown | SD | |
| ZNF277 | SNV | Missense_Mutation | novel | c.1123N>G | p.His375Asp | p.H375D | Q9NRM2 | protein_coding | deleterious(0) | probably_damaging(0.998) | TCGA-ZJ-AB0I-01 | Cervix | cervical & endocervical cancer | Female | <65 | I/II | Unknown | Unknown | SD |
| ZNF277 | deletion | Frame_Shift_Del | novel | c.21delN | p.Ala9LeufsTer19 | p.A9Lfs*19 | Q9NRM2 | protein_coding | TCGA-HG-A2PA-01 | Cervix | cervical & endocervical cancer | Female | <65 | I/II | Unspecific | Taxol | PD | ||
| ZNF277 | SNV | Missense_Mutation | novel | c.902C>A | p.Ser301Tyr | p.S301Y | Q9NRM2 | protein_coding | tolerated(0.51) | possibly_damaging(0.757) | TCGA-AA-3947-01 | Colorectum | colon adenocarcinoma | Female | <65 | I/II | Unknown | Unknown | SD |
| ZNF277 | SNV | Missense_Mutation | rs369502185 | c.1051N>T | p.Arg351Trp | p.R351W | Q9NRM2 | protein_coding | deleterious(0) | probably_damaging(1) | TCGA-AA-A00N-01 | Colorectum | colon adenocarcinoma | Male | >=65 | I/II | Unknown | Unknown | PD |
| Page: 1 2 3 4 5 |
Top |
Related drugs of malignant transformation related genes |
| Identification of chemicals and drugs interact with genes involved in malignant transfromation |
| (DGIdb 4.0) |
| Entrez ID | Symbol | Category | Interaction Types | Drug Claim Name | Drug Name | PMIDs |
| Page: 1 |

Copyright 2023-Present -The University of Texas Health Science Center at Houston |