
|
|||||
|
 | |
| |
| |
| |
| |
| |
|
Gene: ZNF276 |
Gene summary for ZNF276 |
| Gene information | Species | Human | Gene symbol | ZNF276 | Gene ID | 92822 |
| Gene name | zinc finger protein 276 | |
| Gene Alias | CENP-Z | |
| Cytomap | 16q24.3 | |
| Gene Type | protein-coding | GO ID | GO:0006139 | UniProtAcc | I6L9I3 |
Top |
Malignant transformation analysis |
| Identification of the aberrant gene expression in precancerous and cancerous lesions by comparing the gene expression of stem-like cells in diseased tissues with normal stem cells |
| Entrez ID | Symbol | Replicates | Species | Organ | Tissue | Adj P-value | Log2FC | Malignancy |
| 92822 | ZNF276 | HCC1_Meng | Human | Liver | HCC | 5.06e-11 | -1.11e-02 | 0.0246 |
| 92822 | ZNF276 | HCC2_Meng | Human | Liver | HCC | 1.04e-06 | 5.38e-02 | 0.0107 |
| 92822 | ZNF276 | HCC1 | Human | Liver | HCC | 4.55e-06 | 1.15e+00 | 0.5336 |
| 92822 | ZNF276 | HCC2 | Human | Liver | HCC | 1.25e-11 | 1.33e+00 | 0.5341 |
| 92822 | ZNF276 | HCC5 | Human | Liver | HCC | 3.60e-17 | 1.58e+00 | 0.4932 |
| 92822 | ZNF276 | S015 | Human | Liver | HCC | 3.01e-03 | 2.53e-01 | 0.2375 |
| 92822 | ZNF276 | S028 | Human | Liver | HCC | 3.82e-09 | 3.06e-01 | 0.2503 |
| 92822 | ZNF276 | S029 | Human | Liver | HCC | 3.11e-02 | 2.26e-01 | 0.2581 |
| Page: 1 |
| Tissue | Expression Dynamics | Abbreviation |
| Liver | 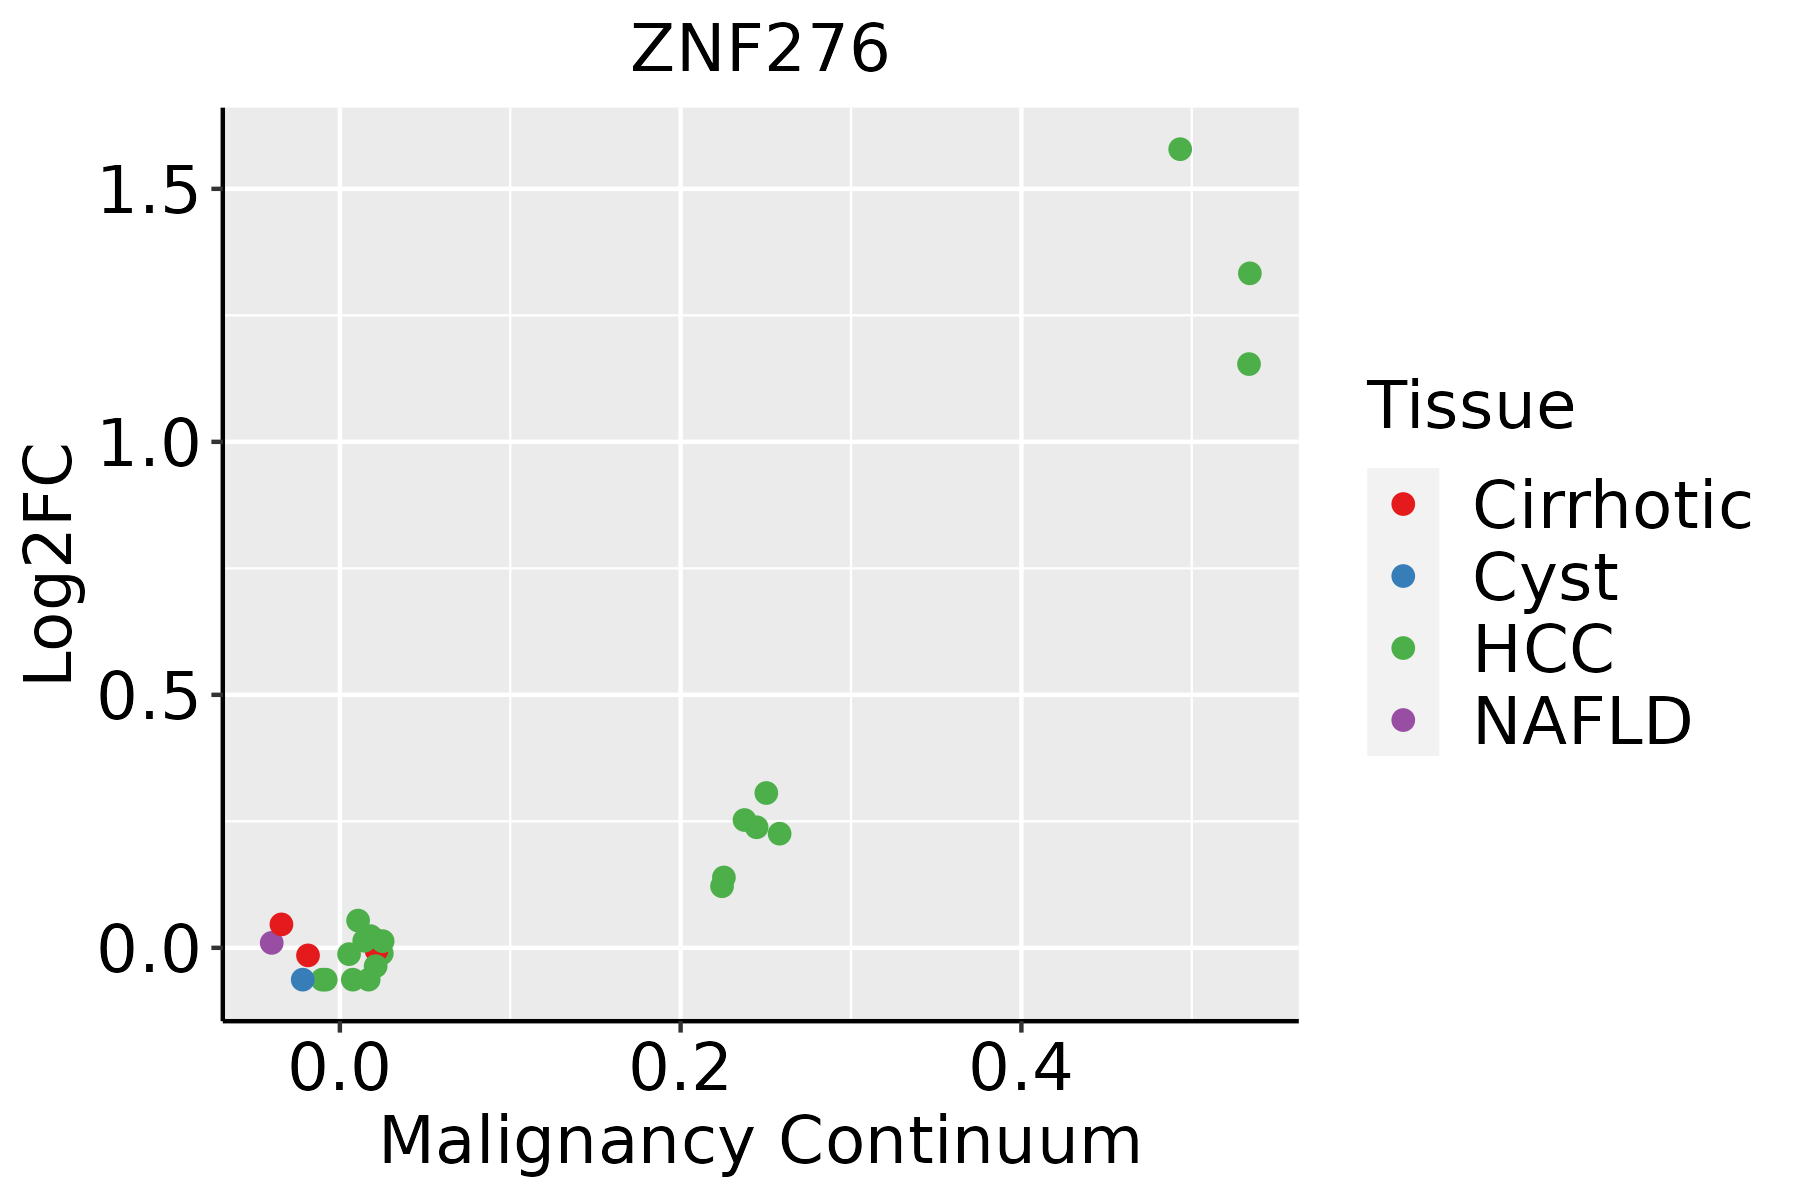 | HCC: Hepatocellular carcinoma |
| NAFLD: Non-alcoholic fatty liver disease |
| ∗log2FC in expression of this searched gene in stem-like cells from each diseased tissue sample relative to stem-like cells in normal samples in each tissue plotted against the malignancy continuum. Samples are colored based on if they are from different disease stage. |
Top |
Malignant transformation related pathway analysis |
| Find out the enriched GO biological processes and KEGG pathways involved in transition from healthy to precancer to cancer |
| Tissue | Disease Stage | Enriched GO biological Processes |
| Colorectum | AD |  |
| Colorectum | SER |  |
| Colorectum | MSS |  |
| Colorectum | MSI-H |  |
| Colorectum | FAP |  |
| ∗Top 15 enriched GO BP terms are showed in the bar plot of each disease state in each tissue. Each row represents a significant GO biological process which is colored according to the -log10(p.adjust). |
| Page: 1 2 3 4 5 6 7 8 9 |
| GO ID | Tissue | Disease Stage | Description | Gene Ratio | Bg Ratio | pvalue | p.adjust | Count |
| Page: 1 |
| Pathway ID | Tissue | Disease Stage | Description | Gene Ratio | Bg Ratio | pvalue | p.adjust | qvalue | Count |
| Page: 1 |
Top |
Cell-cell communication analysis |
| Identification of potential cell-cell interactions between two cell types and their ligand-receptor pairs for different disease states |
| Ligand | Receptor | LRpair | Pathway | Tissue | Disease Stage |
| Page: 1 |
Top |
Single-cell gene regulatory network inference analysis |
| Find out the significant the regulons (TFs) and the target genes of each regulon across cell types for different disease states |
| TF | Cell Type | Tissue | Disease Stage | Target Gene | RSS | Regulon Activity |
| ZNF276 | BMEM | Endometrium | ADJ | TUBA4A,RP5-1171I10.5,ZNF230, etc. | 1.37e-01 |  |
| ZNF276 | CD8TCM | Endometrium | AEH | TUBA4A,RP5-1171I10.5,ZNF230, etc. | 1.94e-01 |  |
| ZNF276 | BMEM | Endometrium | AEH | TUBA4A,RP5-1171I10.5,ZNF230, etc. | 1.45e-01 | |
| ZNF276 | BMEM | Liver | Cirrhotic | MCUB,PRKRIP1,ZMIZ1, etc. | 1.69e-02 |  |
| ZNF276 | pDC | Liver | Healthy | MCUB,PRKRIP1,ZMIZ1, etc. | 3.22e-01 |  |
| ZNF276 | CD8TEXINT | Liver | Healthy | MCUB,PRKRIP1,ZMIZ1, etc. | 1.78e-03 | |
| ZNF276 | pDC | Liver | NAFLD | MCUB,PRKRIP1,ZMIZ1, etc. | 5.25e-01 |  |
| ZNF276 | BAS | Lung | AAH | MIR205HG,AKR1C1,GPX2, etc. | 1.86e-02 |  |
| ZNF276 | BAS | Lung | ADJ | MIR205HG,AKR1C1,GPX2, etc. | 5.04e-02 |  |
| ZNF276 | BAS | Lung | MIAC | MIR205HG,AKR1C1,GPX2, etc. | 1.81e-02 |  |
| ∗The dot plots of a searched regulon are shown for all cell subpopulations in each disease state of each tissue based on the regulon specific score inferred using pySCENIC and by calculating the average expression. |
| Page: 1 2 |
Top |
Somatic mutation of malignant transformation related genes |
| Annotation of somatic variants for genes involved in malignant transformation |
| Hugo Symbol | Variant Class | Variant Classification | dbSNP RS | HGVSc | HGVSp | HGVSp Short | SWISSPROT | BIOTYPE | SIFT | PolyPhen | Tumor Sample Barcode | Tissue | Histology | Sex | Age | Stage | Therapy Types | Drugs | Outcome |
| ZNF276 | SNV | Missense_Mutation | c.1018N>A | p.Glu340Lys | p.E340K | Q8N554 | protein_coding | tolerated(0.28) | benign(0.34) | TCGA-AC-A23H-01 | Breast | breast invasive carcinoma | Female | >=65 | I/II | Unknown | Unknown | PD | |
| ZNF276 | insertion | Frame_Shift_Ins | novel | c.1622_1623insTCTTAATAAACGAGGC | p.His542LeufsTer13 | p.H542Lfs*13 | Q8N554 | protein_coding | TCGA-A2-A0CT-01 | Breast | breast invasive carcinoma | Female | >=65 | I/II | Chemotherapy | cytoxan | SD | ||
| ZNF276 | SNV | Missense_Mutation | novel | c.703G>A | p.Asp235Asn | p.D235N | Q8N554 | protein_coding | tolerated(0.49) | benign(0.003) | TCGA-2W-A8YY-01 | Cervix | cervical & endocervical cancer | Female | <65 | I/II | Chemotherapy | cisplatin | CR |
| ZNF276 | SNV | Missense_Mutation | c.1556C>T | p.Ser519Leu | p.S519L | Q8N554 | protein_coding | deleterious(0) | probably_damaging(0.992) | TCGA-DR-A0ZM-01 | Cervix | cervical & endocervical cancer | Female | <65 | III/IV | Unspecific | Cisplatin | SD | |
| ZNF276 | SNV | Missense_Mutation | novel | c.361C>T | p.Leu121Phe | p.L121F | Q8N554 | protein_coding | deleterious(0.02) | probably_damaging(0.974) | TCGA-5M-AAT6-01 | Colorectum | colon adenocarcinoma | Female | <65 | III/IV | Unknown | Unknown | PD |
| ZNF276 | SNV | Missense_Mutation | rs201072734 | c.377N>A | p.Arg126His | p.R126H | Q8N554 | protein_coding | tolerated(0.66) | benign(0.007) | TCGA-A6-5661-01 | Colorectum | colon adenocarcinoma | Female | >=65 | I/II | Unknown | Unknown | SD |
| ZNF276 | SNV | Missense_Mutation | rs764775504 | c.1393N>T | p.Arg465Trp | p.R465W | Q8N554 | protein_coding | deleterious(0) | probably_damaging(0.993) | TCGA-AA-3864-01 | Colorectum | colon adenocarcinoma | Male | >=65 | I/II | Unknown | Unknown | SD |
| ZNF276 | SNV | Missense_Mutation | novel | c.1247N>G | p.Lys416Arg | p.K416R | Q8N554 | protein_coding | deleterious(0.01) | probably_damaging(0.994) | TCGA-AA-3875-01 | Colorectum | colon adenocarcinoma | Female | >=65 | I/II | Unknown | Unknown | SD |
| ZNF276 | SNV | Missense_Mutation | novel | c.341T>C | p.Val114Ala | p.V114A | Q8N554 | protein_coding | tolerated(0.47) | benign(0.138) | TCGA-AM-5821-01 | Colorectum | colon adenocarcinoma | Female | >=65 | I/II | Unknown | Unknown | SD |
| ZNF276 | SNV | Missense_Mutation | rs761132636 | c.691G>A | p.Val231Met | p.V231M | Q8N554 | protein_coding | tolerated(0.08) | benign(0.14) | TCGA-CK-4951-01 | Colorectum | colon adenocarcinoma | Female | >=65 | I/II | Unknown | Unknown | PD |
| Page: 1 2 3 4 5 |
Top |
Related drugs of malignant transformation related genes |
| Identification of chemicals and drugs interact with genes involved in malignant transfromation |
| (DGIdb 4.0) |
| Entrez ID | Symbol | Category | Interaction Types | Drug Claim Name | Drug Name | PMIDs |
| Page: 1 |

Copyright 2023-Present -The University of Texas Health Science Center at Houston |