
|
|||||
|
 | |
| |
| |
| |
| |
| |
|
Gene: ZNF274 |
Gene summary for ZNF274 |
| Gene information | Species | Human | Gene symbol | ZNF274 | Gene ID | 10782 |
| Gene name | zinc finger protein 274 | |
| Gene Alias | HFB101 | |
| Cytomap | 19q13.43 | |
| Gene Type | protein-coding | GO ID | GO:0000122 | UniProtAcc | A0A0A0MR47 |
Top |
Malignant transformation analysis |
| Identification of the aberrant gene expression in precancerous and cancerous lesions by comparing the gene expression of stem-like cells in diseased tissues with normal stem cells |
| Entrez ID | Symbol | Replicates | Species | Organ | Tissue | Adj P-value | Log2FC | Malignancy |
| 10782 | ZNF274 | LZE4T | Human | Esophagus | ESCC | 1.27e-03 | 1.28e-01 | 0.0811 |
| 10782 | ZNF274 | LZE7T | Human | Esophagus | ESCC | 6.76e-03 | 1.66e-01 | 0.0667 |
| 10782 | ZNF274 | LZE20T | Human | Esophagus | ESCC | 4.19e-02 | 6.57e-02 | 0.0662 |
| 10782 | ZNF274 | LZE24T | Human | Esophagus | ESCC | 2.28e-03 | 1.34e-01 | 0.0596 |
| 10782 | ZNF274 | P1T-E | Human | Esophagus | ESCC | 1.84e-10 | 4.45e-01 | 0.0875 |
| 10782 | ZNF274 | P2T-E | Human | Esophagus | ESCC | 1.43e-21 | 2.48e-01 | 0.1177 |
| 10782 | ZNF274 | P5T-E | Human | Esophagus | ESCC | 2.72e-04 | 7.80e-02 | 0.1327 |
| 10782 | ZNF274 | P8T-E | Human | Esophagus | ESCC | 6.68e-35 | 6.74e-01 | 0.0889 |
| 10782 | ZNF274 | P10T-E | Human | Esophagus | ESCC | 1.62e-07 | 1.01e-01 | 0.116 |
| 10782 | ZNF274 | P11T-E | Human | Esophagus | ESCC | 2.12e-09 | 5.08e-01 | 0.1426 |
| 10782 | ZNF274 | P12T-E | Human | Esophagus | ESCC | 2.65e-07 | 1.44e-01 | 0.1122 |
| 10782 | ZNF274 | P15T-E | Human | Esophagus | ESCC | 4.17e-11 | 1.44e-01 | 0.1149 |
| 10782 | ZNF274 | P16T-E | Human | Esophagus | ESCC | 1.61e-07 | 1.34e-01 | 0.1153 |
| 10782 | ZNF274 | P17T-E | Human | Esophagus | ESCC | 3.80e-02 | 2.19e-01 | 0.1278 |
| 10782 | ZNF274 | P20T-E | Human | Esophagus | ESCC | 1.43e-05 | 1.25e-01 | 0.1124 |
| 10782 | ZNF274 | P21T-E | Human | Esophagus | ESCC | 3.90e-11 | 1.87e-01 | 0.1617 |
| 10782 | ZNF274 | P22T-E | Human | Esophagus | ESCC | 2.74e-15 | 2.82e-01 | 0.1236 |
| 10782 | ZNF274 | P23T-E | Human | Esophagus | ESCC | 2.47e-03 | 1.42e-01 | 0.108 |
| 10782 | ZNF274 | P24T-E | Human | Esophagus | ESCC | 1.75e-05 | 1.40e-01 | 0.1287 |
| 10782 | ZNF274 | P26T-E | Human | Esophagus | ESCC | 1.65e-05 | 3.91e-02 | 0.1276 |
| Page: 1 2 3 4 |
| Tissue | Expression Dynamics | Abbreviation |
| Esophagus | 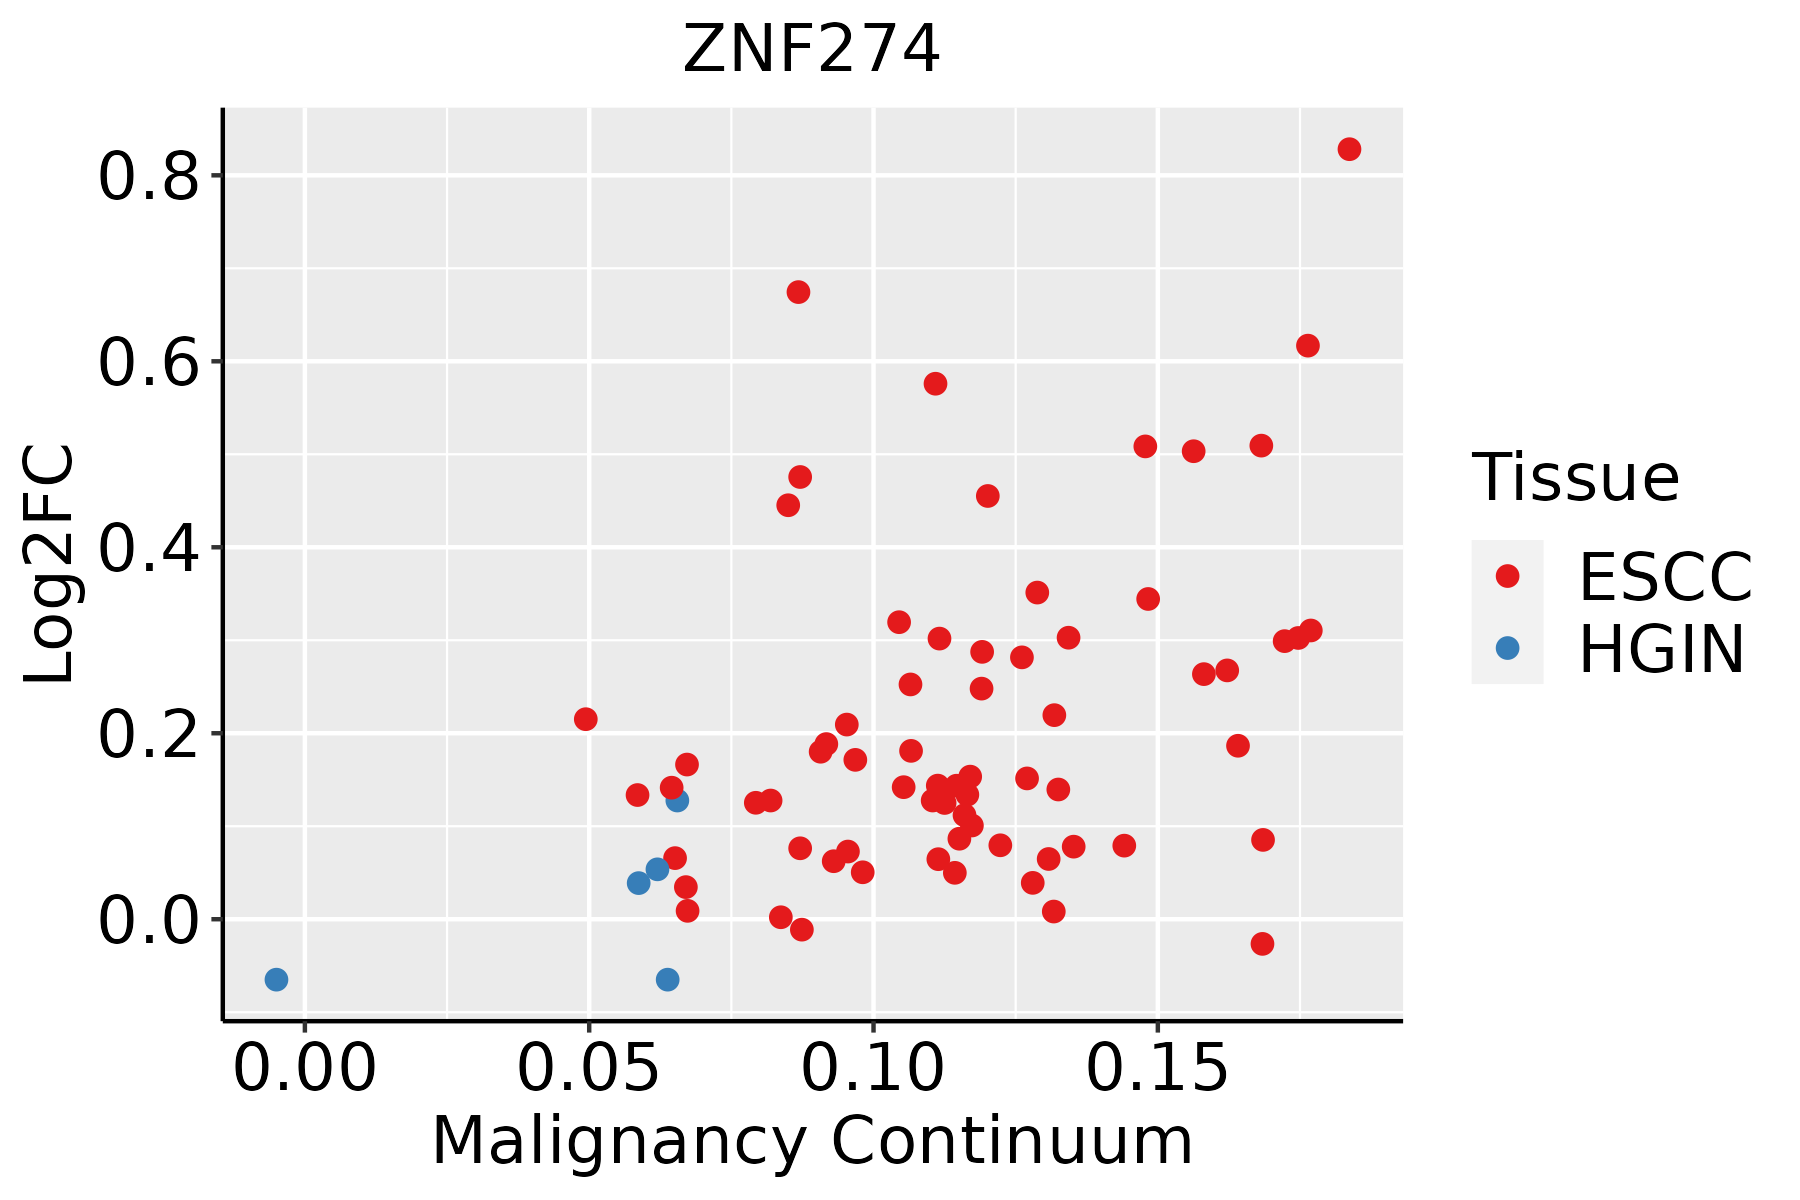 | ESCC: Esophageal squamous cell carcinoma |
| HGIN: High-grade intraepithelial neoplasias | ||
| LGIN: Low-grade intraepithelial neoplasias | ||
| Lung | 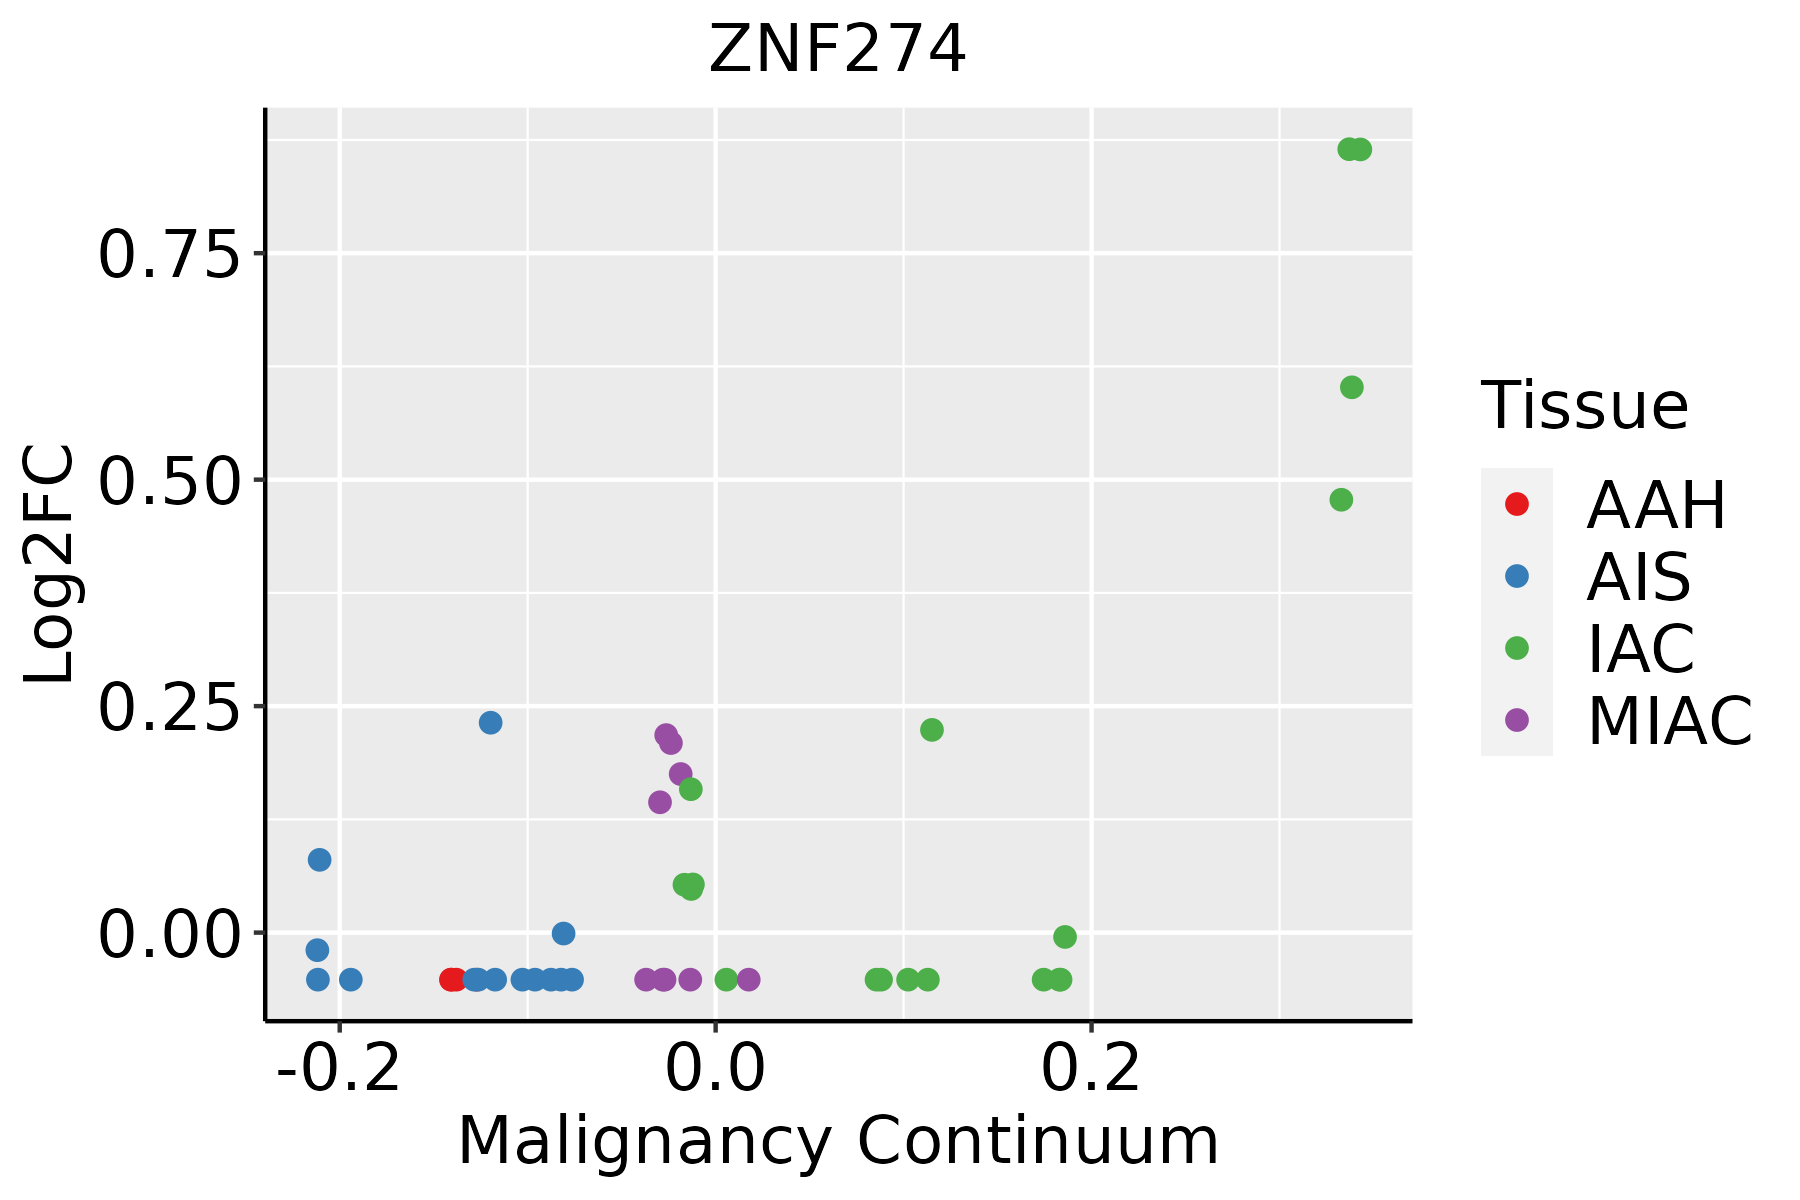 | AAH: Atypical adenomatous hyperplasia |
| AIS: Adenocarcinoma in situ | ||
| IAC: Invasive lung adenocarcinoma | ||
| MIA: Minimally invasive adenocarcinoma | ||
| Thyroid | 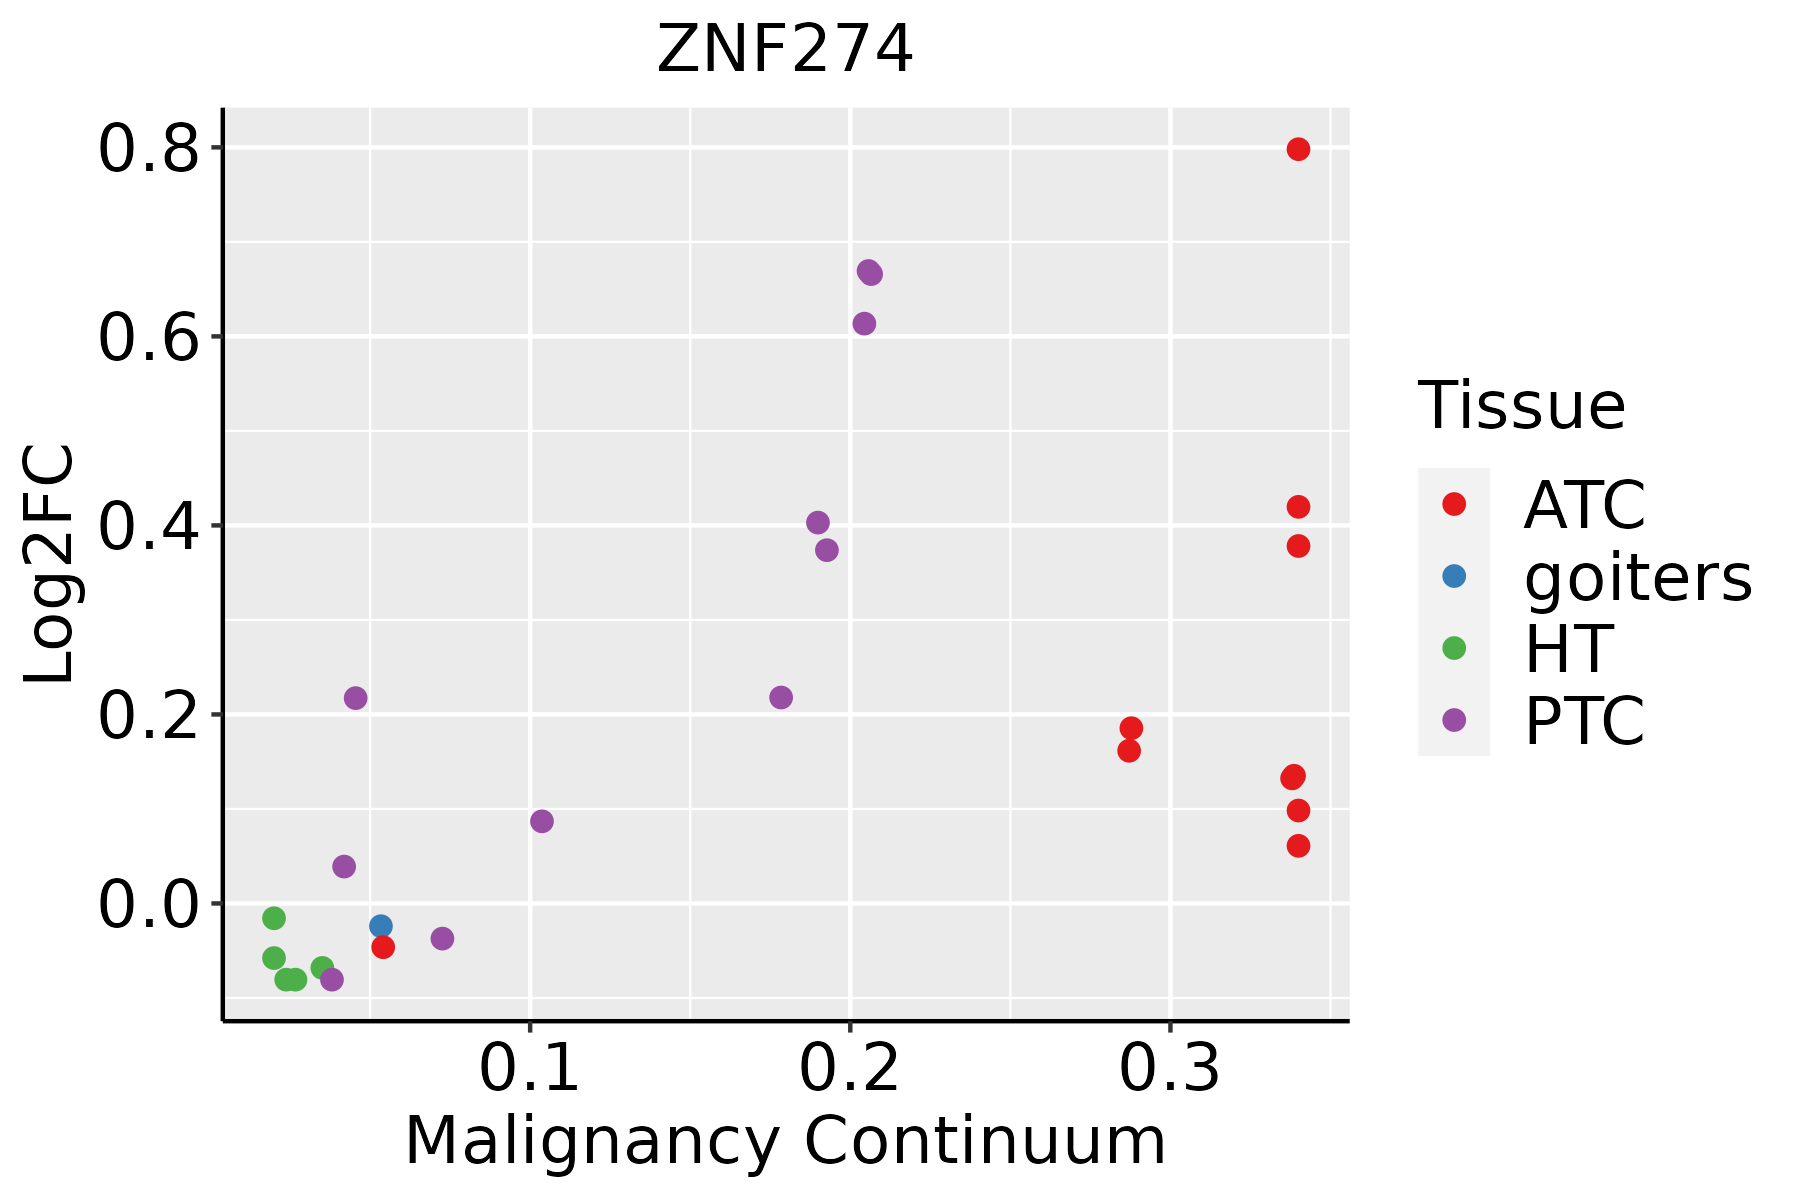 | ATC: Anaplastic thyroid cancer |
| HT: Hashimoto's thyroiditis | ||
| PTC: Papillary thyroid cancer |
| ∗log2FC in expression of this searched gene in stem-like cells from each diseased tissue sample relative to stem-like cells in normal samples in each tissue plotted against the malignancy continuum. Samples are colored based on if they are from different disease stage. |
Top |
Malignant transformation related pathway analysis |
| Find out the enriched GO biological processes and KEGG pathways involved in transition from healthy to precancer to cancer |
| Tissue | Disease Stage | Enriched GO biological Processes |
| Colorectum | AD |  |
| Colorectum | SER |  |
| Colorectum | MSS |  |
| Colorectum | MSI-H |  |
| Colorectum | FAP |  |
| ∗Top 15 enriched GO BP terms are showed in the bar plot of each disease state in each tissue. Each row represents a significant GO biological process which is colored according to the -log10(p.adjust). |
| Page: 1 2 3 4 5 6 7 8 9 |
| GO ID | Tissue | Disease Stage | Description | Gene Ratio | Bg Ratio | pvalue | p.adjust | Count |
| GO:001657015 | Esophagus | ESCC | histone modification | 323/8552 | 463/18723 | 2.61e-26 | 7.88e-24 | 323 |
| GO:001820514 | Esophagus | ESCC | peptidyl-lysine modification | 259/8552 | 376/18723 | 3.90e-20 | 5.26e-18 | 259 |
| GO:00434143 | Esophagus | ESCC | macromolecule methylation | 199/8552 | 316/18723 | 3.44e-10 | 9.57e-09 | 199 |
| GO:003105614 | Esophagus | ESCC | regulation of histone modification | 106/8552 | 152/18723 | 1.52e-09 | 3.55e-08 | 106 |
| GO:00322592 | Esophagus | ESCC | methylation | 222/8552 | 364/18723 | 2.26e-09 | 5.09e-08 | 222 |
| GO:000647914 | Esophagus | ESCC | protein methylation | 115/8552 | 181/18723 | 9.07e-07 | 1.16e-05 | 115 |
| GO:000821314 | Esophagus | ESCC | protein alkylation | 115/8552 | 181/18723 | 9.07e-07 | 1.16e-05 | 115 |
| GO:00165718 | Esophagus | ESCC | histone methylation | 89/8552 | 141/18723 | 2.17e-05 | 1.87e-04 | 89 |
| GO:003496814 | Esophagus | ESCC | histone lysine methylation | 72/8552 | 115/18723 | 1.85e-04 | 1.18e-03 | 72 |
| GO:003106013 | Esophagus | ESCC | regulation of histone methylation | 46/8552 | 69/18723 | 3.46e-04 | 2.03e-03 | 46 |
| GO:001802214 | Esophagus | ESCC | peptidyl-lysine methylation | 79/8552 | 131/18723 | 5.17e-04 | 2.86e-03 | 79 |
| GO:00180231 | Esophagus | ESCC | peptidyl-lysine trimethylation | 31/8552 | 50/18723 | 1.48e-02 | 4.79e-02 | 31 |
| GO:00165704 | Lung | IAC | histone modification | 93/2061 | 463/18723 | 5.41e-09 | 8.03e-07 | 93 |
| GO:00349684 | Lung | IAC | histone lysine methylation | 25/2061 | 115/18723 | 6.35e-04 | 8.68e-03 | 25 |
| GO:00182053 | Lung | IAC | peptidyl-lysine modification | 62/2061 | 376/18723 | 7.55e-04 | 9.82e-03 | 62 |
| GO:00180223 | Lung | IAC | peptidyl-lysine methylation | 27/2061 | 131/18723 | 9.41e-04 | 1.14e-02 | 27 |
| GO:00310564 | Lung | IAC | regulation of histone modification | 30/2061 | 152/18723 | 1.07e-03 | 1.26e-02 | 30 |
| GO:00064794 | Lung | IAC | protein methylation | 34/2061 | 181/18723 | 1.28e-03 | 1.45e-02 | 34 |
| GO:00082134 | Lung | IAC | protein alkylation | 34/2061 | 181/18723 | 1.28e-03 | 1.45e-02 | 34 |
| GO:00165714 | Lung | IAC | histone methylation | 28/2061 | 141/18723 | 1.39e-03 | 1.53e-02 | 28 |
| Page: 1 2 3 |
| Pathway ID | Tissue | Disease Stage | Description | Gene Ratio | Bg Ratio | pvalue | p.adjust | qvalue | Count |
| hsa0472225 | Esophagus | ESCC | Neurotrophin signaling pathway | 80/4205 | 119/8465 | 7.33e-05 | 3.07e-04 | 1.57e-04 | 80 |
| hsa04722111 | Esophagus | ESCC | Neurotrophin signaling pathway | 80/4205 | 119/8465 | 7.33e-05 | 3.07e-04 | 1.57e-04 | 80 |
| hsa0472212 | Lung | IAC | Neurotrophin signaling pathway | 29/1053 | 119/8465 | 2.34e-04 | 2.54e-03 | 1.68e-03 | 29 |
| hsa0472213 | Lung | IAC | Neurotrophin signaling pathway | 29/1053 | 119/8465 | 2.34e-04 | 2.54e-03 | 1.68e-03 | 29 |
| Page: 1 |
Top |
Cell-cell communication analysis |
| Identification of potential cell-cell interactions between two cell types and their ligand-receptor pairs for different disease states |
| Ligand | Receptor | LRpair | Pathway | Tissue | Disease Stage |
| Page: 1 |
Top |
Single-cell gene regulatory network inference analysis |
| Find out the significant the regulons (TFs) and the target genes of each regulon across cell types for different disease states |
| TF | Cell Type | Tissue | Disease Stage | Target Gene | RSS | Regulon Activity |
| ZNF274 | CD8TCM | Breast | ADJ | FXYD7,NIF3L1,AC078883.1, etc. | 4.67e-01 |  |
| ZNF274 | CD8TCM | Cervix | ADJ | GCSAML,SPATA2L,IL1RN, etc. | 8.25e-02 |  |
| ZNF274 | PERI | Endometrium | ADJ | NOP14,BCHE,P2RY11, etc. | 2.94e-01 |  |
| ZNF274 | NK | Lung | ADJ | AF228727.1,BTD,DOP1B, etc. | 2.87e-01 |  |
| ZNF274 | PLA | Lung | ADJ | AF228727.1,BTD,DOP1B, etc. | 9.27e-03 | |
| ZNF274 | MAST | Lung | ADJ | AF228727.1,BTD,DOP1B, etc. | 4.16e-02 | |
| ZNF274 | NEUT | Lung | ADJ | AF228727.1,BTD,DOP1B, etc. | 4.69e-03 | |
| ZNF274 | MMC | Lung | ADJ | AF228727.1,BTD,DOP1B, etc. | 5.93e-03 | |
| ∗The dot plots of a searched regulon are shown for all cell subpopulations in each disease state of each tissue based on the regulon specific score inferred using pySCENIC and by calculating the average expression. |
| Page: 1 |
Top |
Somatic mutation of malignant transformation related genes |
| Annotation of somatic variants for genes involved in malignant transformation |
| Hugo Symbol | Variant Class | Variant Classification | dbSNP RS | HGVSc | HGVSp | HGVSp Short | SWISSPROT | BIOTYPE | SIFT | PolyPhen | Tumor Sample Barcode | Tissue | Histology | Sex | Age | Stage | Therapy Types | Drugs | Outcome |
| ZNF274 | SNV | Missense_Mutation | c.1588N>G | p.Thr530Ala | p.T530A | Q96GC6 | protein_coding | deleterious(0.01) | benign(0.325) | TCGA-AC-A23C-01 | Breast | breast invasive carcinoma | Female | <65 | I/II | Chemotherapy | chemo | CR | |
| ZNF274 | SNV | Missense_Mutation | novel | c.211N>A | p.Asp71Asn | p.D71N | Q96GC6 | protein_coding | tolerated(0.06) | benign(0.157) | TCGA-AC-A23H-01 | Breast | breast invasive carcinoma | Female | >=65 | I/II | Unknown | Unknown | PD |
| ZNF274 | SNV | Missense_Mutation | c.1568N>T | p.Ser523Phe | p.S523F | Q96GC6 | protein_coding | deleterious(0) | probably_damaging(0.973) | TCGA-AN-A046-01 | Breast | breast invasive carcinoma | Female | >=65 | I/II | Unknown | Unknown | SD | |
| ZNF274 | SNV | Missense_Mutation | novel | c.304N>A | p.Glu102Lys | p.E102K | Q96GC6 | protein_coding | tolerated(0.5) | benign(0.003) | TCGA-C8-A26Y-01 | Breast | breast invasive carcinoma | Female | >=65 | I/II | Unknown | Unknown | SD |
| ZNF274 | SNV | Missense_Mutation | rs752792284 | c.181N>C | p.Asp61His | p.D61H | Q96GC6 | protein_coding | deleterious(0.03) | benign(0.142) | TCGA-E9-A1ND-01 | Breast | breast invasive carcinoma | Female | >=65 | I/II | Hormone Therapy | aromasin | SD |
| ZNF274 | SNV | Missense_Mutation | rs368884351 | c.653N>A | p.Arg218Gln | p.R218Q | Q96GC6 | protein_coding | tolerated(0.12) | benign(0.068) | TCGA-LL-A73Z-01 | Breast | breast invasive carcinoma | Female | <65 | III/IV | Chemotherapy | adriamycin | PD |
| ZNF274 | insertion | Frame_Shift_Ins | novel | c.1405_1406insTG | p.His469LeufsTer31 | p.H469Lfs*31 | Q96GC6 | protein_coding | TCGA-A2-A0CU-01 | Breast | breast invasive carcinoma | Female | >=65 | I/II | Hormone Therapy | tamoxiphen | SD | ||
| ZNF274 | insertion | Frame_Shift_Ins | novel | c.1406_1407insCCACTGGGGTAGTGGTATGTATGTGTCATTGG | p.Gln470HisfsTer40 | p.Q470Hfs*40 | Q96GC6 | protein_coding | TCGA-A2-A0CU-01 | Breast | breast invasive carcinoma | Female | >=65 | I/II | Hormone Therapy | tamoxiphen | SD | ||
| ZNF274 | insertion | Frame_Shift_Ins | novel | c.1526_1527insTAAGTGGAACTGTAGACCTAGAGGGGTGAGGT | p.Ser510LysfsTer84 | p.S510Kfs*84 | Q96GC6 | protein_coding | TCGA-A8-A0A4-01 | Breast | breast invasive carcinoma | Female | >=65 | I/II | Hormone Therapy | tamoxiphen | CR | ||
| ZNF274 | SNV | Missense_Mutation | c.604N>A | p.Glu202Lys | p.E202K | Q96GC6 | protein_coding | deleterious(0) | probably_damaging(0.996) | TCGA-JX-A3Q0-01 | Cervix | cervical & endocervical cancer | Female | <65 | III/IV | Unknown | Unknown | SD |
| Page: 1 2 3 4 5 6 7 |
Top |
Related drugs of malignant transformation related genes |
| Identification of chemicals and drugs interact with genes involved in malignant transfromation |
| (DGIdb 4.0) |
| Entrez ID | Symbol | Category | Interaction Types | Drug Claim Name | Drug Name | PMIDs |
| Page: 1 |

Copyright 2023-Present -The University of Texas Health Science Center at Houston |