
|
|||||
|
 | |
| |
| |
| |
| |
| |
|
Gene: ZNF266 |
Gene summary for ZNF266 |
| Gene information | Species | Human | Gene symbol | ZNF266 | Gene ID | 10781 |
| Gene name | zinc finger protein 266 | |
| Gene Alias | HZF1 | |
| Cytomap | 19p13.2 | |
| Gene Type | protein-coding | GO ID | GO:0000122 | UniProtAcc | A0A024R7B6 |
Top |
Malignant transformation analysis |
| Identification of the aberrant gene expression in precancerous and cancerous lesions by comparing the gene expression of stem-like cells in diseased tissues with normal stem cells |
| Entrez ID | Symbol | Replicates | Species | Organ | Tissue | Adj P-value | Log2FC | Malignancy |
| 10781 | ZNF266 | Dong_P3 | Human | Prostate | Tumor | 1.97e-05 | 7.79e-02 | 0.0278 |
| 10781 | ZNF266 | GSM5353221_PA_PB2A_Pool_1_3_S25_L001 | Human | Prostate | Tumor | 1.22e-03 | 3.23e-01 | 0.1633 |
| 10781 | ZNF266 | GSM5353222_PA_PB2B_Pool_1_3_S52_L002 | Human | Prostate | Tumor | 1.00e-07 | 4.32e-01 | 0.1608 |
| 10781 | ZNF266 | GSM5353223_PA_PB2B_Pool_2_S26_L001 | Human | Prostate | Tumor | 3.16e-10 | 5.85e-01 | 0.1604 |
| 10781 | ZNF266 | GSM5353228_PA_PR5199-640K_Pool_1_3_S108_L004 | Human | Prostate | Tumor | 4.78e-02 | 7.02e-01 | 0.1537 |
| 10781 | ZNF266 | GSM5353240_PA_PR5254_T1_S15_L001 | Human | Prostate | Tumor | 4.22e-02 | 2.90e-01 | 0.1575 |
| Page: 1 |
| Tissue | Expression Dynamics | Abbreviation |
| Prostate | 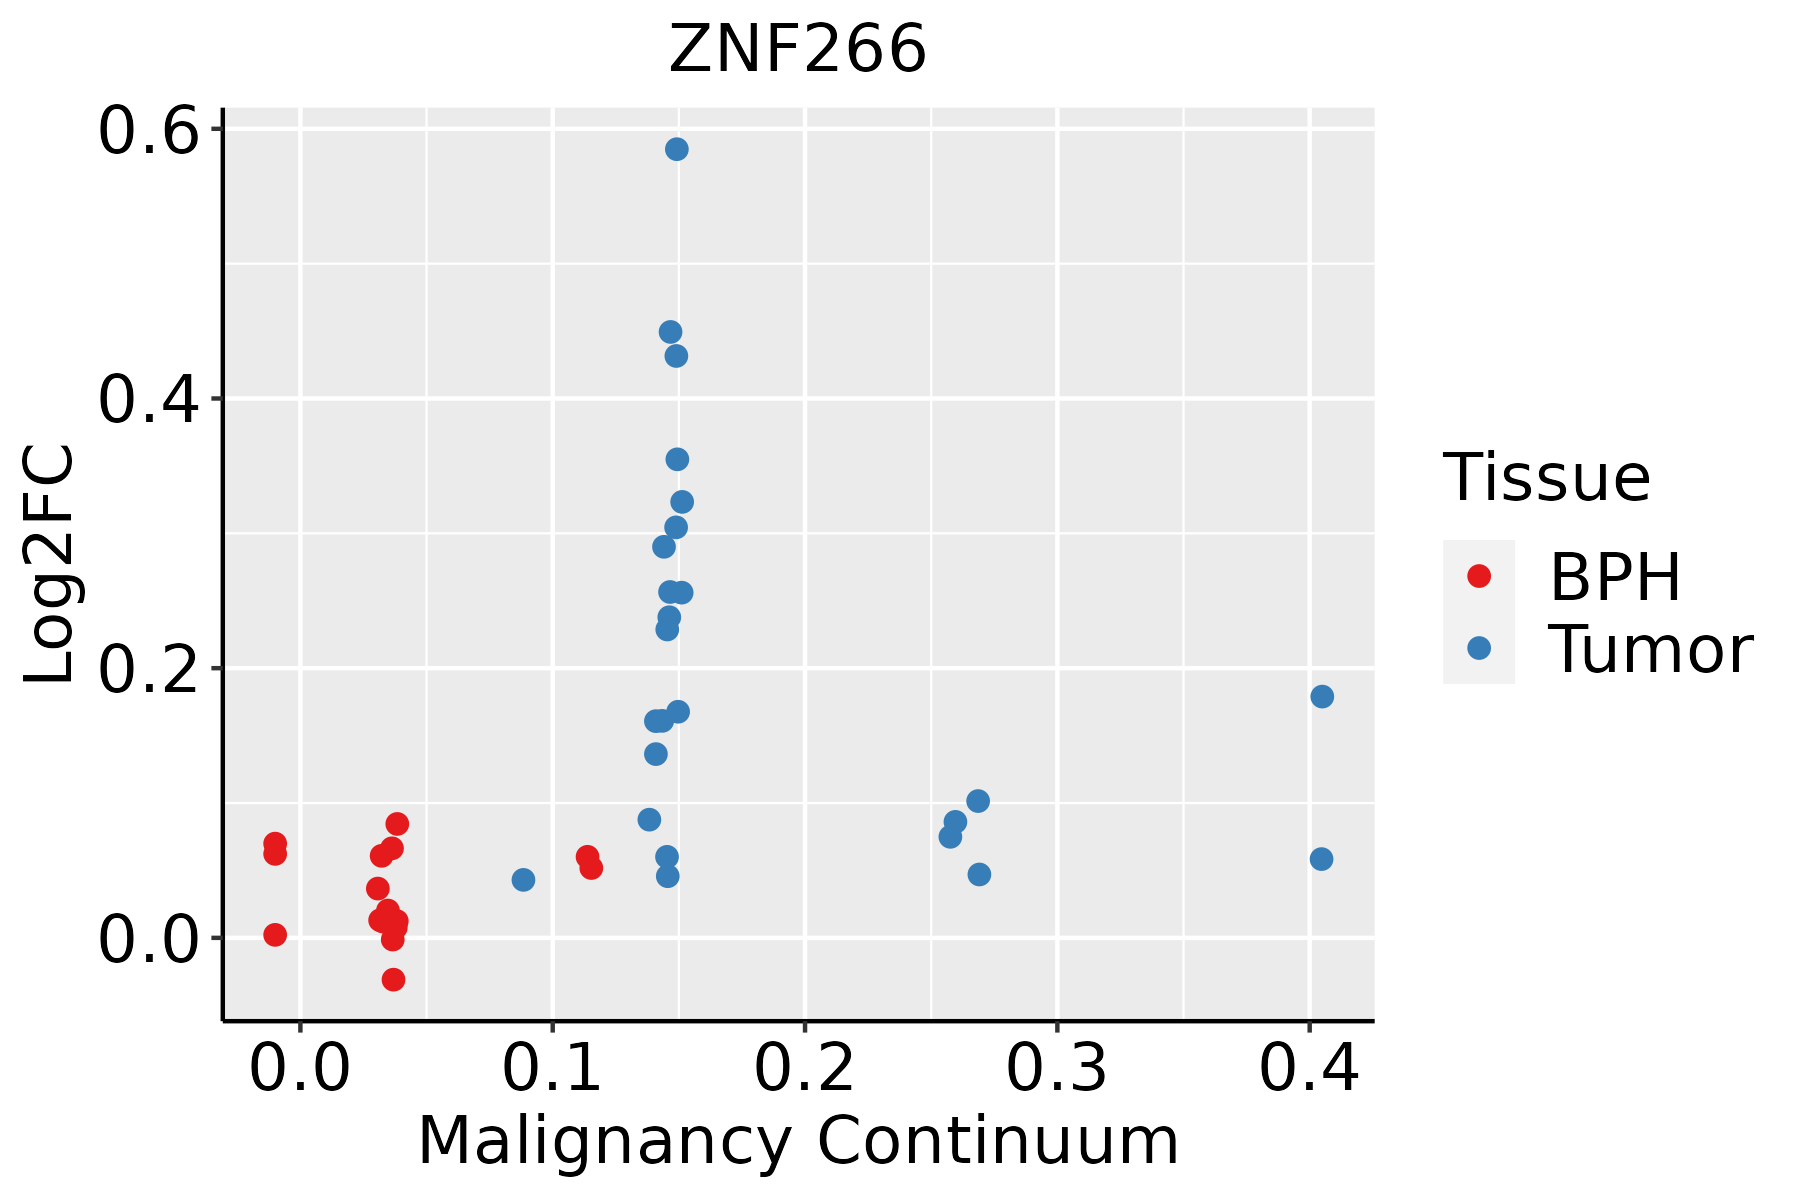 | BPH: Benign Prostatic Hyperplasia |
| ∗log2FC in expression of this searched gene in stem-like cells from each diseased tissue sample relative to stem-like cells in normal samples in each tissue plotted against the malignancy continuum. Samples are colored based on if they are from different disease stage. |
Top |
Malignant transformation related pathway analysis |
| Find out the enriched GO biological processes and KEGG pathways involved in transition from healthy to precancer to cancer |
| Tissue | Disease Stage | Enriched GO biological Processes |
| Colorectum | AD |  |
| Colorectum | SER |  |
| Colorectum | MSS |  |
| Colorectum | MSI-H |  |
| Colorectum | FAP |  |
| ∗Top 15 enriched GO BP terms are showed in the bar plot of each disease state in each tissue. Each row represents a significant GO biological process which is colored according to the -log10(p.adjust). |
| Page: 1 2 3 4 5 6 7 8 9 |
| GO ID | Tissue | Disease Stage | Description | Gene Ratio | Bg Ratio | pvalue | p.adjust | Count |
| Page: 1 |
| Pathway ID | Tissue | Disease Stage | Description | Gene Ratio | Bg Ratio | pvalue | p.adjust | qvalue | Count |
| Page: 1 |
Top |
Cell-cell communication analysis |
| Identification of potential cell-cell interactions between two cell types and their ligand-receptor pairs for different disease states |
| Ligand | Receptor | LRpair | Pathway | Tissue | Disease Stage |
| Page: 1 |
Top |
Single-cell gene regulatory network inference analysis |
| Find out the significant the regulons (TFs) and the target genes of each regulon across cell types for different disease states |
| TF | Cell Type | Tissue | Disease Stage | Target Gene | RSS | Regulon Activity |
| ZNF266 | PVA | Prostate | BPH | VILL,SUSD5,BST1, etc. | 3.34e-01 |  |
| ZNF266 | PVA | Prostate | Healthy | VILL,SUSD5,BST1, etc. | 1.92e-01 |  |
| ZNF266 | CD8TCM | Skin | ADJ | LNCAROD,SIGLEC7,CD14, etc. | 2.41e-02 |  |
| ZNF266 | CD8TCM | Skin | Healthy | LNCAROD,SIGLEC7,CD14, etc. | 5.54e-02 |  |
| ZNF266 | CD8TEREX | Skin | SCCIS | LNCAROD,SIGLEC7,CD14, etc. | 2.65e-02 |  |
| ∗The dot plots of a searched regulon are shown for all cell subpopulations in each disease state of each tissue based on the regulon specific score inferred using pySCENIC and by calculating the average expression. |
| Page: 1 |
Top |
Somatic mutation of malignant transformation related genes |
| Annotation of somatic variants for genes involved in malignant transformation |
| Hugo Symbol | Variant Class | Variant Classification | dbSNP RS | HGVSc | HGVSp | HGVSp Short | SWISSPROT | BIOTYPE | SIFT | PolyPhen | Tumor Sample Barcode | Tissue | Histology | Sex | Age | Stage | Therapy Types | Drugs | Outcome |
| ZNF266 | SNV | Missense_Mutation | rs780683331 | c.382N>T | p.Arg128Cys | p.R128C | Q14584 | protein_coding | tolerated(0.16) | benign(0) | TCGA-A8-A076-01 | Breast | breast invasive carcinoma | Female | >=65 | I/II | Hormone Therapy | anastrozole | SD |
| ZNF266 | SNV | Missense_Mutation | c.1343N>A | p.Ser448Tyr | p.S448Y | Q14584 | protein_coding | tolerated(0.21) | benign(0.057) | TCGA-A8-A095-01 | Breast | breast invasive carcinoma | Female | <65 | I/II | Chemotherapy | 5-fluorouracil | CR | |
| ZNF266 | SNV | Missense_Mutation | c.1288N>T | p.His430Tyr | p.H430Y | Q14584 | protein_coding | deleterious(0) | probably_damaging(0.998) | TCGA-A8-A09X-01 | Breast | breast invasive carcinoma | Female | <65 | III/IV | Unknown | Unknown | SD | |
| ZNF266 | insertion | Frame_Shift_Ins | novel | c.872_873insAAACACAAAAGCAATCACA | p.Gly292AsnfsTer8 | p.G292Nfs*8 | Q14584 | protein_coding | TCGA-A8-A0A4-01 | Breast | breast invasive carcinoma | Female | >=65 | I/II | Hormone Therapy | tamoxiphen | CR | ||
| ZNF266 | SNV | Missense_Mutation | c.1172N>A | p.Arg391Lys | p.R391K | Q14584 | protein_coding | tolerated(0.91) | benign(0.003) | TCGA-C5-A1MK-01 | Cervix | cervical & endocervical cancer | Female | >=65 | III/IV | Chemotherapy | carboplatin | PD | |
| ZNF266 | SNV | Missense_Mutation | novel | c.1360N>G | p.His454Asp | p.H454D | Q14584 | protein_coding | deleterious(0) | probably_damaging(0.999) | TCGA-HM-A4S6-01 | Cervix | cervical & endocervical cancer | Female | <65 | III/IV | Chemotherapy | cisplatin | CR |
| ZNF266 | SNV | Missense_Mutation | c.1543N>G | p.Thr515Ala | p.T515A | Q14584 | protein_coding | deleterious(0) | benign(0.106) | TCGA-A6-2686-01 | Colorectum | colon adenocarcinoma | Female | >=65 | I/II | Unknown | Unknown | SD | |
| ZNF266 | SNV | Missense_Mutation | rs763653840 | c.1607N>A | p.Arg536Gln | p.R536Q | Q14584 | protein_coding | tolerated(0.69) | benign(0) | TCGA-AA-3492-01 | Colorectum | colon adenocarcinoma | Female | >=65 | I/II | Unknown | Unknown | SD |
| ZNF266 | SNV | Missense_Mutation | novel | c.574G>T | p.Gly192Cys | p.G192C | Q14584 | protein_coding | deleterious(0.01) | benign(0.187) | TCGA-AA-3947-01 | Colorectum | colon adenocarcinoma | Female | <65 | I/II | Unknown | Unknown | SD |
| ZNF266 | SNV | Missense_Mutation | rs146314378 | c.1535G>A | p.Arg512Gln | p.R512Q | Q14584 | protein_coding | tolerated(0.11) | probably_damaging(0.958) | TCGA-AA-3977-01 | Colorectum | colon adenocarcinoma | Male | >=65 | I/II | Unknown | Unknown | SD |
| Page: 1 2 3 4 5 6 7 8 |
Top |
Related drugs of malignant transformation related genes |
| Identification of chemicals and drugs interact with genes involved in malignant transfromation |
| (DGIdb 4.0) |
| Entrez ID | Symbol | Category | Interaction Types | Drug Claim Name | Drug Name | PMIDs |
| Page: 1 |

Copyright 2023-Present -The University of Texas Health Science Center at Houston |