
|
|||||
|
 | |
| |
| |
| |
| |
| |
|
Gene: ZNF263 |
Gene summary for ZNF263 |
| Gene information | Species | Human | Gene symbol | ZNF263 | Gene ID | 10127 |
| Gene name | zinc finger protein 263 | |
| Gene Alias | FPM315 | |
| Cytomap | 16p13.3 | |
| Gene Type | protein-coding | GO ID | GO:0000122 | UniProtAcc | O14978 |
Top |
Malignant transformation analysis |
| Identification of the aberrant gene expression in precancerous and cancerous lesions by comparing the gene expression of stem-like cells in diseased tissues with normal stem cells |
| Entrez ID | Symbol | Replicates | Species | Organ | Tissue | Adj P-value | Log2FC | Malignancy |
| 10127 | ZNF263 | LZE7T | Human | Esophagus | ESCC | 4.11e-03 | 1.10e-01 | 0.0667 |
| 10127 | ZNF263 | LZE20T | Human | Esophagus | ESCC | 1.05e-03 | 1.30e-01 | 0.0662 |
| 10127 | ZNF263 | LZE24T | Human | Esophagus | ESCC | 1.10e-15 | 3.48e-01 | 0.0596 |
| 10127 | ZNF263 | LZE21T | Human | Esophagus | ESCC | 5.66e-03 | 1.39e-01 | 0.0655 |
| 10127 | ZNF263 | P1T-E | Human | Esophagus | ESCC | 8.29e-04 | 3.64e-01 | 0.0875 |
| 10127 | ZNF263 | P2T-E | Human | Esophagus | ESCC | 5.62e-28 | 5.17e-01 | 0.1177 |
| 10127 | ZNF263 | P4T-E | Human | Esophagus | ESCC | 1.93e-03 | 1.62e-01 | 0.1323 |
| 10127 | ZNF263 | P5T-E | Human | Esophagus | ESCC | 4.73e-10 | 8.58e-02 | 0.1327 |
| 10127 | ZNF263 | P8T-E | Human | Esophagus | ESCC | 5.16e-11 | 2.38e-01 | 0.0889 |
| 10127 | ZNF263 | P9T-E | Human | Esophagus | ESCC | 1.03e-09 | 1.35e-01 | 0.1131 |
| 10127 | ZNF263 | P10T-E | Human | Esophagus | ESCC | 4.90e-10 | 2.13e-01 | 0.116 |
| 10127 | ZNF263 | P11T-E | Human | Esophagus | ESCC | 1.24e-10 | 5.18e-01 | 0.1426 |
| 10127 | ZNF263 | P12T-E | Human | Esophagus | ESCC | 3.49e-17 | 4.17e-01 | 0.1122 |
| 10127 | ZNF263 | P15T-E | Human | Esophagus | ESCC | 5.35e-16 | 3.72e-01 | 0.1149 |
| 10127 | ZNF263 | P16T-E | Human | Esophagus | ESCC | 1.53e-17 | 1.83e-01 | 0.1153 |
| 10127 | ZNF263 | P17T-E | Human | Esophagus | ESCC | 2.28e-03 | 1.39e-01 | 0.1278 |
| 10127 | ZNF263 | P19T-E | Human | Esophagus | ESCC | 1.64e-05 | 2.47e-01 | 0.1662 |
| 10127 | ZNF263 | P20T-E | Human | Esophagus | ESCC | 4.23e-13 | 2.69e-01 | 0.1124 |
| 10127 | ZNF263 | P21T-E | Human | Esophagus | ESCC | 2.21e-14 | 1.66e-01 | 0.1617 |
| 10127 | ZNF263 | P22T-E | Human | Esophagus | ESCC | 3.06e-16 | 2.28e-01 | 0.1236 |
| Page: 1 2 3 4 |
| Tissue | Expression Dynamics | Abbreviation |
| Esophagus | 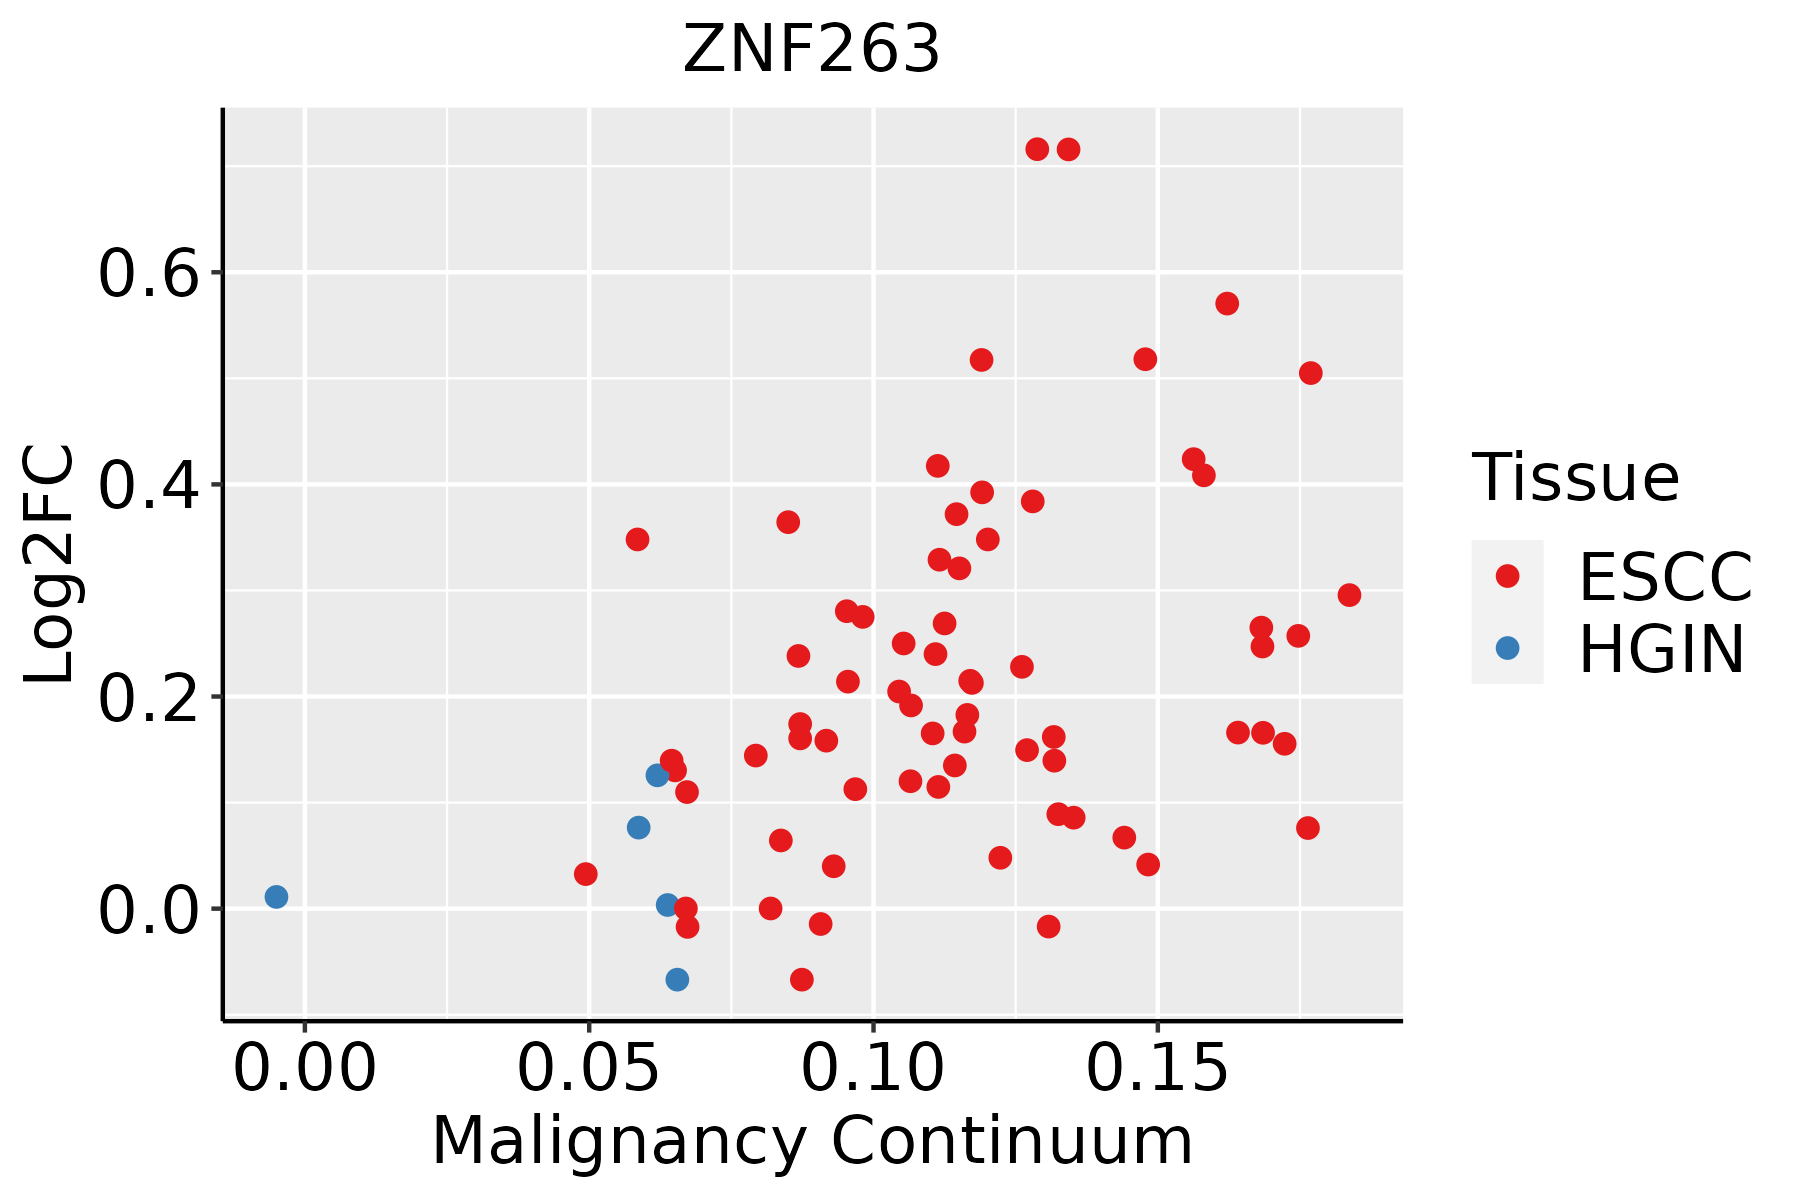 | ESCC: Esophageal squamous cell carcinoma |
| HGIN: High-grade intraepithelial neoplasias | ||
| LGIN: Low-grade intraepithelial neoplasias | ||
| Liver | 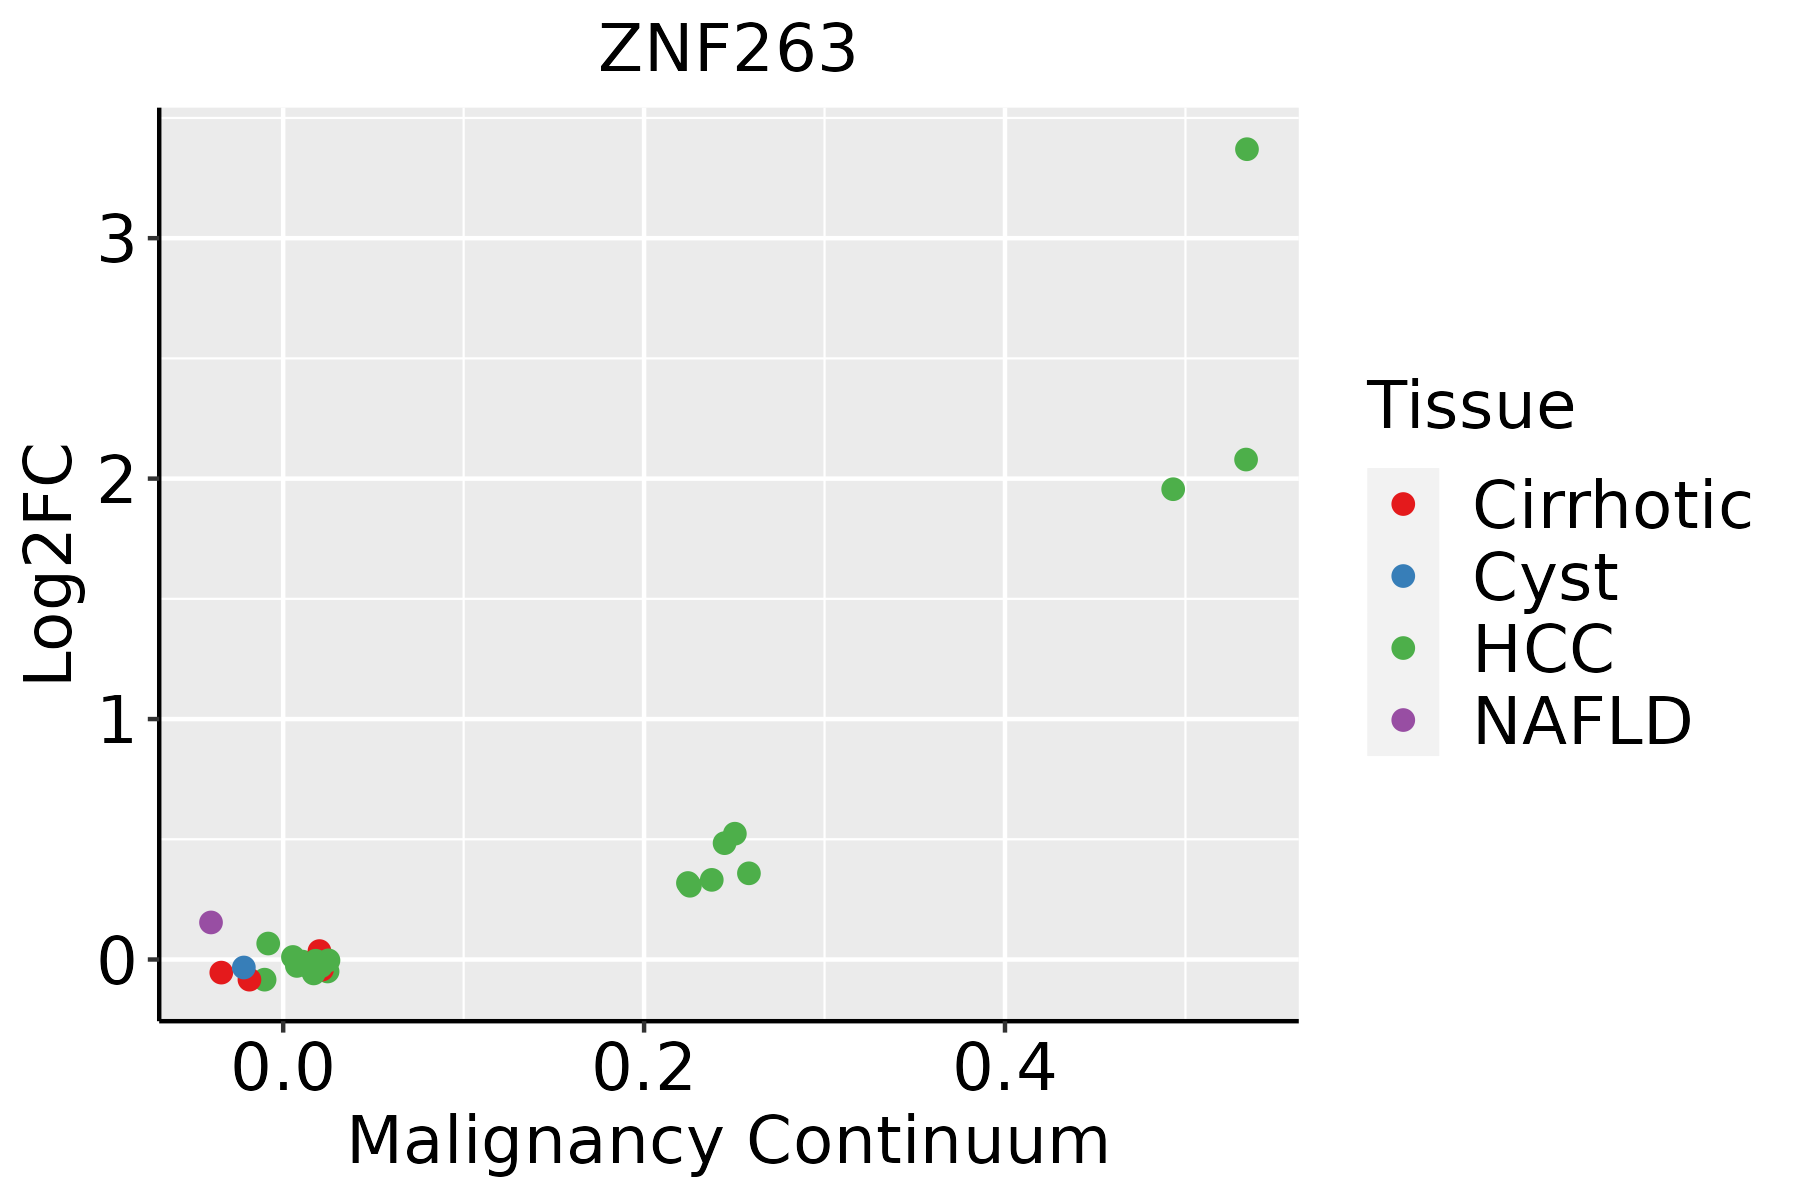 | HCC: Hepatocellular carcinoma |
| NAFLD: Non-alcoholic fatty liver disease |
| ∗log2FC in expression of this searched gene in stem-like cells from each diseased tissue sample relative to stem-like cells in normal samples in each tissue plotted against the malignancy continuum. Samples are colored based on if they are from different disease stage. |
Top |
Malignant transformation related pathway analysis |
| Find out the enriched GO biological processes and KEGG pathways involved in transition from healthy to precancer to cancer |
| Tissue | Disease Stage | Enriched GO biological Processes |
| Colorectum | AD |  |
| Colorectum | SER |  |
| Colorectum | MSS |  |
| Colorectum | MSI-H |  |
| Colorectum | FAP |  |
| ∗Top 15 enriched GO BP terms are showed in the bar plot of each disease state in each tissue. Each row represents a significant GO biological process which is colored according to the -log10(p.adjust). |
| Page: 1 2 3 4 5 6 7 8 9 |
| GO ID | Tissue | Disease Stage | Description | Gene Ratio | Bg Ratio | pvalue | p.adjust | Count |
| Page: 1 |
| Pathway ID | Tissue | Disease Stage | Description | Gene Ratio | Bg Ratio | pvalue | p.adjust | qvalue | Count |
| Page: 1 |
Top |
Cell-cell communication analysis |
| Identification of potential cell-cell interactions between two cell types and their ligand-receptor pairs for different disease states |
| Ligand | Receptor | LRpair | Pathway | Tissue | Disease Stage |
| Page: 1 |
Top |
Single-cell gene regulatory network inference analysis |
| Find out the significant the regulons (TFs) and the target genes of each regulon across cell types for different disease states |
| TF | Cell Type | Tissue | Disease Stage | Target Gene | RSS | Regulon Activity |
| ZNF263 | TUF | Colorectum | FAP | NEK10,AC087386.1,C17orf67, etc. | 3.24e-02 |  |
| ZNF263 | CT | Colorectum | FAP | NEK10,AC087386.1,C17orf67, etc. | 1.68e-03 | |
| ZNF263 | EE | Colorectum | FAP | NEK10,AC087386.1,C17orf67, etc. | 1.28e-03 | |
| ZNF263 | SSC | Colorectum | FAP | NEK10,AC087386.1,C17orf67, etc. | 0.00e+00 | |
| ZNF263 | DC | Colorectum | CRC | OSBPL3,ABCA5,PTEN, etc. | 7.50e-02 |  |
| ZNF263 | DC | Colorectum | FAP | OSBPL3,ABCA5,PTEN, etc. | 9.78e-02 | |
| ZNF263 | CHO | Liver | NAFLD | RABGAP1,NR2F2-AS1,MSI2, etc. | 3.93e-01 |  |
| ZNF263 | CILIA | Lung | Healthy | SFT2D1,ETFB,SMURF1, etc. | 1.99e-02 |  |
| ZNF263 | NUER | Prostate | Tumor | TSPAN12,GPR37,KMT2E-AS1, etc. | 2.36e-03 |  |
| ∗The dot plots of a searched regulon are shown for all cell subpopulations in each disease state of each tissue based on the regulon specific score inferred using pySCENIC and by calculating the average expression. |
| Page: 1 |
Top |
Somatic mutation of malignant transformation related genes |
| Annotation of somatic variants for genes involved in malignant transformation |
| Hugo Symbol | Variant Class | Variant Classification | dbSNP RS | HGVSc | HGVSp | HGVSp Short | SWISSPROT | BIOTYPE | SIFT | PolyPhen | Tumor Sample Barcode | Tissue | Histology | Sex | Age | Stage | Therapy Types | Drugs | Outcome |
| ZNF263 | SNV | Missense_Mutation | novel | c.404G>T | p.Arg135Leu | p.R135L | O14978 | protein_coding | deleterious(0.02) | benign(0.062) | TCGA-A7-A0DB-01 | Breast | breast invasive carcinoma | Female | <65 | I/II | Hormone Therapy | arimidex | SD |
| ZNF263 | SNV | Missense_Mutation | c.716N>C | p.Arg239Thr | p.R239T | O14978 | protein_coding | deleterious(0.01) | benign(0.133) | TCGA-A8-A08L-01 | Breast | breast invasive carcinoma | Female | >=65 | III/IV | Unknown | Unknown | SD | |
| ZNF263 | SNV | Missense_Mutation | novel | c.1193G>T | p.Arg398Ile | p.R398I | O14978 | protein_coding | tolerated(0.14) | possibly_damaging(0.82) | TCGA-AN-A046-01 | Breast | breast invasive carcinoma | Female | >=65 | I/II | Unknown | Unknown | SD |
| ZNF263 | SNV | Missense_Mutation | novel | c.1207N>A | p.Glu403Lys | p.E403K | O14978 | protein_coding | deleterious(0) | probably_damaging(0.963) | TCGA-BH-A2L8-01 | Breast | breast invasive carcinoma | Female | <65 | I/II | Chemotherapy | cytoxan | CR |
| ZNF263 | SNV | Missense_Mutation | rs750738145 | c.1012N>T | p.His338Tyr | p.H338Y | O14978 | protein_coding | deleterious(0.04) | benign(0.011) | TCGA-D8-A1XW-01 | Breast | breast invasive carcinoma | Female | <65 | I/II | Chemotherapy | adriamycin+cyclophosphamide | SD |
| ZNF263 | insertion | Nonsense_Mutation | novel | c.429_430insACCTGACGATGGCGTCGGGC | p.Pro144ThrfsTer2 | p.P144Tfs*2 | O14978 | protein_coding | TCGA-AN-A0FX-01 | Breast | breast invasive carcinoma | Female | <65 | I/II | Unknown | Unknown | SD | ||
| ZNF263 | insertion | Frame_Shift_Ins | novel | c.1038_1039insA | p.Pro347ThrfsTer43 | p.P347Tfs*43 | O14978 | protein_coding | TCGA-B6-A0IK-01 | Breast | breast invasive carcinoma | Female | <65 | III/IV | Unknown | Unknown | PD | ||
| ZNF263 | insertion | In_Frame_Ins | novel | c.1039_1040insAGAGTGAGACTCTGT | p.Pro347delinsGlnSerGluThrLeuSer | p.P347delinsQSETLS | O14978 | protein_coding | TCGA-B6-A0IK-01 | Breast | breast invasive carcinoma | Female | <65 | III/IV | Unknown | Unknown | PD | ||
| ZNF263 | deletion | Frame_Shift_Del | novel | c.544delG | p.Asp182ThrfsTer5 | p.D182Tfs*5 | O14978 | protein_coding | TCGA-D8-A27V-01 | Breast | breast invasive carcinoma | Female | <65 | I/II | Hormone Therapy | tamoxiphen | SD | ||
| ZNF263 | SNV | Missense_Mutation | novel | c.1907N>A | p.Cys636Tyr | p.C636Y | O14978 | protein_coding | deleterious(0) | probably_damaging(1) | TCGA-EA-A3HS-01 | Cervix | cervical & endocervical cancer | Female | <65 | I/II | Unknown | Unknown | SD |
| Page: 1 2 3 4 5 6 7 8 |
Top |
Related drugs of malignant transformation related genes |
| Identification of chemicals and drugs interact with genes involved in malignant transfromation |
| (DGIdb 4.0) |
| Entrez ID | Symbol | Category | Interaction Types | Drug Claim Name | Drug Name | PMIDs |
| Page: 1 |

Copyright 2023-Present -The University of Texas Health Science Center at Houston |