
|
|||||
|
 | |
| |
| |
| |
| |
| |
|
Gene: ZNF260 |
Gene summary for ZNF260 |
| Gene information | Species | Human | Gene symbol | ZNF260 | Gene ID | 339324 |
| Gene name | zinc finger protein 260 | |
| Gene Alias | OZRF1 | |
| Cytomap | 19q13.12 | |
| Gene Type | protein-coding | GO ID | GO:0006139 | UniProtAcc | Q3ZCT1 |
Top |
Malignant transformation analysis |
| Identification of the aberrant gene expression in precancerous and cancerous lesions by comparing the gene expression of stem-like cells in diseased tissues with normal stem cells |
| Entrez ID | Symbol | Replicates | Species | Organ | Tissue | Adj P-value | Log2FC | Malignancy |
| 339324 | ZNF260 | HCC1_Meng | Human | Liver | HCC | 2.14e-21 | 1.08e-02 | 0.0246 |
| 339324 | ZNF260 | HCC2_Meng | Human | Liver | HCC | 2.02e-05 | -1.38e-02 | 0.0107 |
| 339324 | ZNF260 | HCC1 | Human | Liver | HCC | 1.37e-10 | 3.15e+00 | 0.5336 |
| 339324 | ZNF260 | HCC2 | Human | Liver | HCC | 7.86e-18 | 3.63e+00 | 0.5341 |
| 339324 | ZNF260 | S028 | Human | Liver | HCC | 6.00e-07 | 3.75e-01 | 0.2503 |
| 339324 | ZNF260 | S029 | Human | Liver | HCC | 4.21e-08 | 3.76e-01 | 0.2581 |
| 339324 | ZNF260 | male-WTA | Human | Thyroid | PTC | 9.70e-03 | 4.47e-02 | 0.1037 |
| 339324 | ZNF260 | PTC05 | Human | Thyroid | PTC | 2.81e-03 | 1.55e-01 | 0.2065 |
| 339324 | ZNF260 | PTC06 | Human | Thyroid | PTC | 2.25e-10 | 2.04e-01 | 0.2057 |
| 339324 | ZNF260 | PTC07 | Human | Thyroid | PTC | 5.44e-11 | 1.18e-01 | 0.2044 |
| 339324 | ZNF260 | ATC13 | Human | Thyroid | ATC | 1.88e-99 | 1.92e+00 | 0.34 |
| 339324 | ZNF260 | ATC2 | Human | Thyroid | ATC | 4.52e-04 | 6.22e-01 | 0.34 |
| 339324 | ZNF260 | ATC5 | Human | Thyroid | ATC | 4.00e-104 | 2.02e+00 | 0.34 |
| Page: 1 |
| Tissue | Expression Dynamics | Abbreviation |
| Liver | 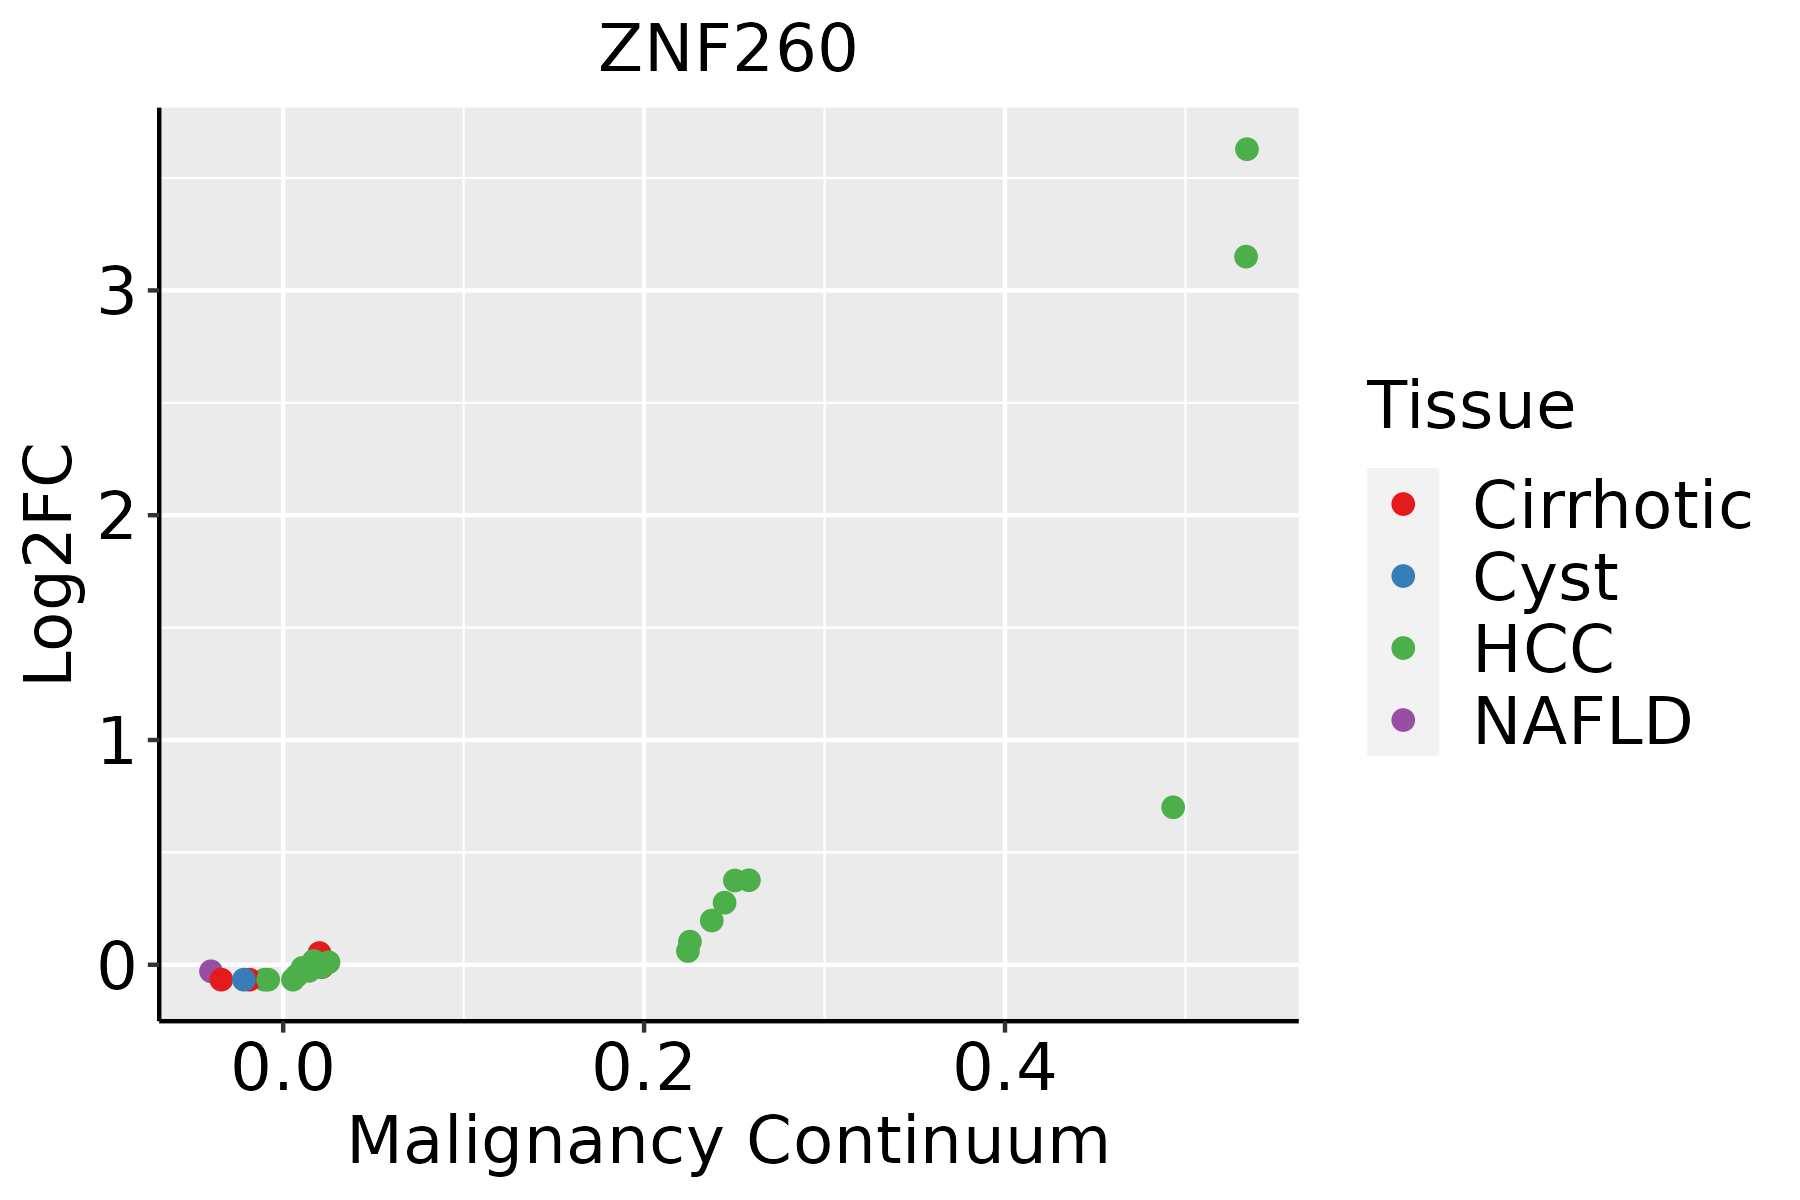 | HCC: Hepatocellular carcinoma |
| NAFLD: Non-alcoholic fatty liver disease | ||
| Thyroid | 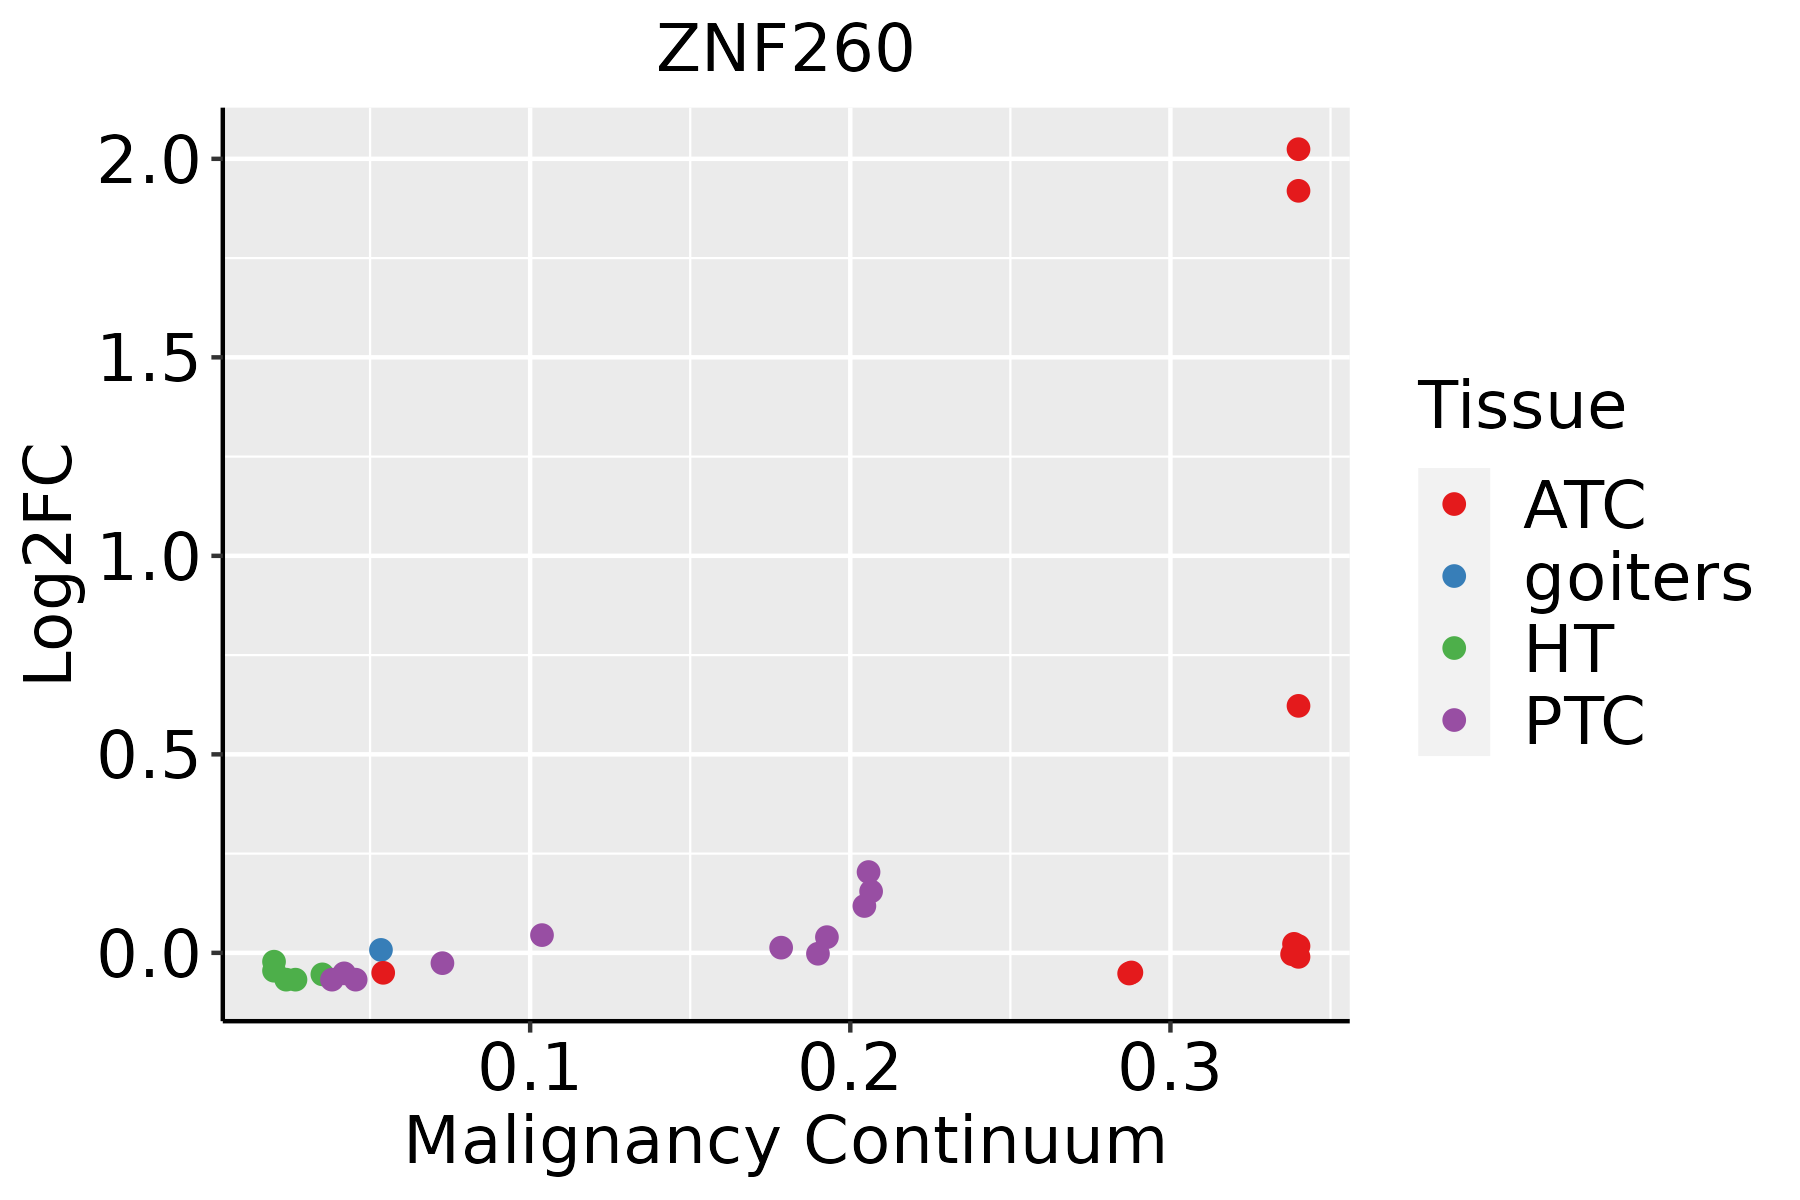 | ATC: Anaplastic thyroid cancer |
| HT: Hashimoto's thyroiditis | ||
| PTC: Papillary thyroid cancer |
| ∗log2FC in expression of this searched gene in stem-like cells from each diseased tissue sample relative to stem-like cells in normal samples in each tissue plotted against the malignancy continuum. Samples are colored based on if they are from different disease stage. |
Top |
Malignant transformation related pathway analysis |
| Find out the enriched GO biological processes and KEGG pathways involved in transition from healthy to precancer to cancer |
| Tissue | Disease Stage | Enriched GO biological Processes |
| Colorectum | AD |  |
| Colorectum | SER |  |
| Colorectum | MSS |  |
| Colorectum | MSI-H |  |
| Colorectum | FAP |  |
| ∗Top 15 enriched GO BP terms are showed in the bar plot of each disease state in each tissue. Each row represents a significant GO biological process which is colored according to the -log10(p.adjust). |
| Page: 1 2 3 4 5 6 7 8 9 |
| GO ID | Tissue | Disease Stage | Description | Gene Ratio | Bg Ratio | pvalue | p.adjust | Count |
| Page: 1 |
| Pathway ID | Tissue | Disease Stage | Description | Gene Ratio | Bg Ratio | pvalue | p.adjust | qvalue | Count |
| Page: 1 |
Top |
Cell-cell communication analysis |
| Identification of potential cell-cell interactions between two cell types and their ligand-receptor pairs for different disease states |
| Ligand | Receptor | LRpair | Pathway | Tissue | Disease Stage |
| Page: 1 |
Top |
Single-cell gene regulatory network inference analysis |
| Find out the significant the regulons (TFs) and the target genes of each regulon across cell types for different disease states |
| TF | Cell Type | Tissue | Disease Stage | Target Gene | RSS | Regulon Activity |
| ZNF260 | CD8TEREX | Liver | Cirrhotic | FAM129A,RAB18,ADK, etc. | 1.03e-02 |  |
| ZNF260 | TFH | Liver | HCC | FAM129A,RAB18,ADK, etc. | 1.46e-01 |  |
| ZNF260 | INCAF | Oral cavity | ADJ | CGNL1,SUSD1,SPEF2, etc. | 7.07e-02 |  |
| ZNF260 | DUCT2 | Pancreas | PDAC | SUPT5H,SAMD4B,EID2, etc. | 7.62e-03 |  |
| ZNF260 | LYMEND | Stomach | CSG | KIF27,ANGPT1,INTS4, etc. | 5.19e-02 |  |
| ZNF260 | ICAF | Stomach | SIM | KIF27,ANGPT1,INTS4, etc. | 1.32e-01 |  |
| ZNF260 | MSC | Stomach | SIM | KIF27,ANGPT1,INTS4, etc. | 1.31e-01 | |
| ∗The dot plots of a searched regulon are shown for all cell subpopulations in each disease state of each tissue based on the regulon specific score inferred using pySCENIC and by calculating the average expression. |
| Page: 1 |
Top |
Somatic mutation of malignant transformation related genes |
| Annotation of somatic variants for genes involved in malignant transformation |
| Hugo Symbol | Variant Class | Variant Classification | dbSNP RS | HGVSc | HGVSp | HGVSp Short | SWISSPROT | BIOTYPE | SIFT | PolyPhen | Tumor Sample Barcode | Tissue | Histology | Sex | Age | Stage | Therapy Types | Drugs | Outcome |
| ZNF260 | SNV | Missense_Mutation | c.971N>A | p.Arg324Lys | p.R324K | Q3ZCT1 | protein_coding | tolerated(0.08) | possibly_damaging(0.644) | TCGA-A2-A0CL-01 | Breast | breast invasive carcinoma | Female | <65 | III/IV | Chemotherapy | cytoxan | SD | |
| ZNF260 | insertion | In_Frame_Ins | novel | c.187_188insGAA | p.Val63delinsGlyMet | p.V63delinsGM | Q3ZCT1 | protein_coding | TCGA-BH-A0AY-01 | Breast | breast invasive carcinoma | Female | <65 | I/II | Chemotherapy | SD | |||
| ZNF260 | insertion | Frame_Shift_Ins | novel | c.185_186insCTTGAGGAGAGGTTTGGAGGTGCTGAGA | p.Lys62AsnfsTer23 | p.K62Nfs*23 | Q3ZCT1 | protein_coding | TCGA-BH-A0AY-01 | Breast | breast invasive carcinoma | Female | <65 | I/II | Chemotherapy | SD | |||
| ZNF260 | insertion | Nonsense_Mutation | novel | c.778_779insTGAAGGCTTAACCCTTTAGGGCTAAGATTAGTATATTCTAAAACTC | p.Lys260MetfsTer4 | p.K260Mfs*4 | Q3ZCT1 | protein_coding | TCGA-EW-A1PA-01 | Breast | breast invasive carcinoma | Female | <65 | I/II | Chemotherapy | cyclophosphamide | SD | ||
| ZNF260 | SNV | Missense_Mutation | c.838G>C | p.Glu280Gln | p.E280Q | Q3ZCT1 | protein_coding | tolerated(0.31) | benign(0.061) | TCGA-EK-A3GK-01 | Cervix | cervical & endocervical cancer | Female | <65 | I/II | Unknown | Unknown | SD | |
| ZNF260 | SNV | Missense_Mutation | c.1234N>G | p.His412Asp | p.H412D | Q3ZCT1 | protein_coding | deleterious_low_confidence(0.01) | benign(0.351) | TCGA-FU-A2QG-01 | Cervix | cervical & endocervical cancer | Female | <65 | I/II | Unknown | Unknown | SD | |
| ZNF260 | SNV | Missense_Mutation | novel | c.661N>A | p.Glu221Lys | p.E221K | Q3ZCT1 | protein_coding | tolerated(0.25) | benign(0.038) | TCGA-VS-A8EL-01 | Cervix | cervical & endocervical cancer | Female | <65 | I/II | Chemotherapy | cisplatin | CR |
| ZNF260 | SNV | Missense_Mutation | c.281N>G | p.Gln94Arg | p.Q94R | Q3ZCT1 | protein_coding | tolerated(0.22) | benign(0.084) | TCGA-A6-2677-01 | Colorectum | colon adenocarcinoma | Female | >=65 | III/IV | Ancillary | leucovorin | SD | |
| ZNF260 | SNV | Missense_Mutation | novel | c.182N>A | p.Gly61Asp | p.G61D | Q3ZCT1 | protein_coding | deleterious(0.01) | probably_damaging(1) | TCGA-D5-6540-01 | Colorectum | colon adenocarcinoma | Male | >=65 | I/II | Unknown | Unknown | SD |
| ZNF260 | SNV | Missense_Mutation | c.1148N>T | p.Thr383Ile | p.T383I | Q3ZCT1 | protein_coding | deleterious(0.01) | benign(0.264) | TCGA-F4-6703-01 | Colorectum | colon adenocarcinoma | Male | <65 | I/II | Unknown | Unknown | SD |
| Page: 1 2 3 4 5 |
Top |
Related drugs of malignant transformation related genes |
| Identification of chemicals and drugs interact with genes involved in malignant transfromation |
| (DGIdb 4.0) |
| Entrez ID | Symbol | Category | Interaction Types | Drug Claim Name | Drug Name | PMIDs |
| Page: 1 |

Copyright 2023-Present -The University of Texas Health Science Center at Houston |