
|
|||||
|
 | |
| |
| |
| |
| |
| |
|
Gene: ZNF251 |
Gene summary for ZNF251 |
| Gene information | Species | Human | Gene symbol | ZNF251 | Gene ID | 90987 |
| Gene name | zinc finger protein 251 | |
| Gene Alias | ZNF251 | |
| Cytomap | 8q24.3 | |
| Gene Type | protein-coding | GO ID | GO:0006139 | UniProtAcc | Q9BRH9 |
Top |
Malignant transformation analysis |
| Identification of the aberrant gene expression in precancerous and cancerous lesions by comparing the gene expression of stem-like cells in diseased tissues with normal stem cells |
| Entrez ID | Symbol | Replicates | Species | Organ | Tissue | Adj P-value | Log2FC | Malignancy |
| 90987 | ZNF251 | LZE20T | Human | Esophagus | ESCC | 9.24e-03 | 8.35e-02 | 0.0662 |
| 90987 | ZNF251 | LZE24T | Human | Esophagus | ESCC | 2.71e-10 | 2.49e-01 | 0.0596 |
| 90987 | ZNF251 | P2T-E | Human | Esophagus | ESCC | 6.03e-10 | 1.42e-01 | 0.1177 |
| 90987 | ZNF251 | P4T-E | Human | Esophagus | ESCC | 1.55e-05 | 1.14e-01 | 0.1323 |
| 90987 | ZNF251 | P5T-E | Human | Esophagus | ESCC | 3.13e-02 | 1.10e-01 | 0.1327 |
| 90987 | ZNF251 | P8T-E | Human | Esophagus | ESCC | 9.03e-10 | 1.37e-01 | 0.0889 |
| 90987 | ZNF251 | P9T-E | Human | Esophagus | ESCC | 3.06e-04 | 9.97e-02 | 0.1131 |
| 90987 | ZNF251 | P10T-E | Human | Esophagus | ESCC | 1.74e-09 | 1.20e-01 | 0.116 |
| 90987 | ZNF251 | P11T-E | Human | Esophagus | ESCC | 1.96e-05 | 2.58e-01 | 0.1426 |
| 90987 | ZNF251 | P12T-E | Human | Esophagus | ESCC | 1.25e-14 | 1.71e-01 | 0.1122 |
| 90987 | ZNF251 | P15T-E | Human | Esophagus | ESCC | 5.31e-05 | 1.10e-01 | 0.1149 |
| 90987 | ZNF251 | P16T-E | Human | Esophagus | ESCC | 7.72e-09 | 2.46e-01 | 0.1153 |
| 90987 | ZNF251 | P20T-E | Human | Esophagus | ESCC | 3.50e-09 | 2.20e-01 | 0.1124 |
| 90987 | ZNF251 | P21T-E | Human | Esophagus | ESCC | 2.53e-07 | 8.79e-02 | 0.1617 |
| 90987 | ZNF251 | P22T-E | Human | Esophagus | ESCC | 3.29e-04 | 6.65e-02 | 0.1236 |
| 90987 | ZNF251 | P23T-E | Human | Esophagus | ESCC | 1.14e-09 | 2.27e-01 | 0.108 |
| 90987 | ZNF251 | P24T-E | Human | Esophagus | ESCC | 2.38e-05 | 5.64e-02 | 0.1287 |
| 90987 | ZNF251 | P26T-E | Human | Esophagus | ESCC | 2.57e-38 | 6.25e-01 | 0.1276 |
| 90987 | ZNF251 | P27T-E | Human | Esophagus | ESCC | 5.65e-09 | 1.21e-01 | 0.1055 |
| 90987 | ZNF251 | P28T-E | Human | Esophagus | ESCC | 4.35e-07 | 1.58e-01 | 0.1149 |
| Page: 1 2 3 |
| Tissue | Expression Dynamics | Abbreviation |
| Esophagus | 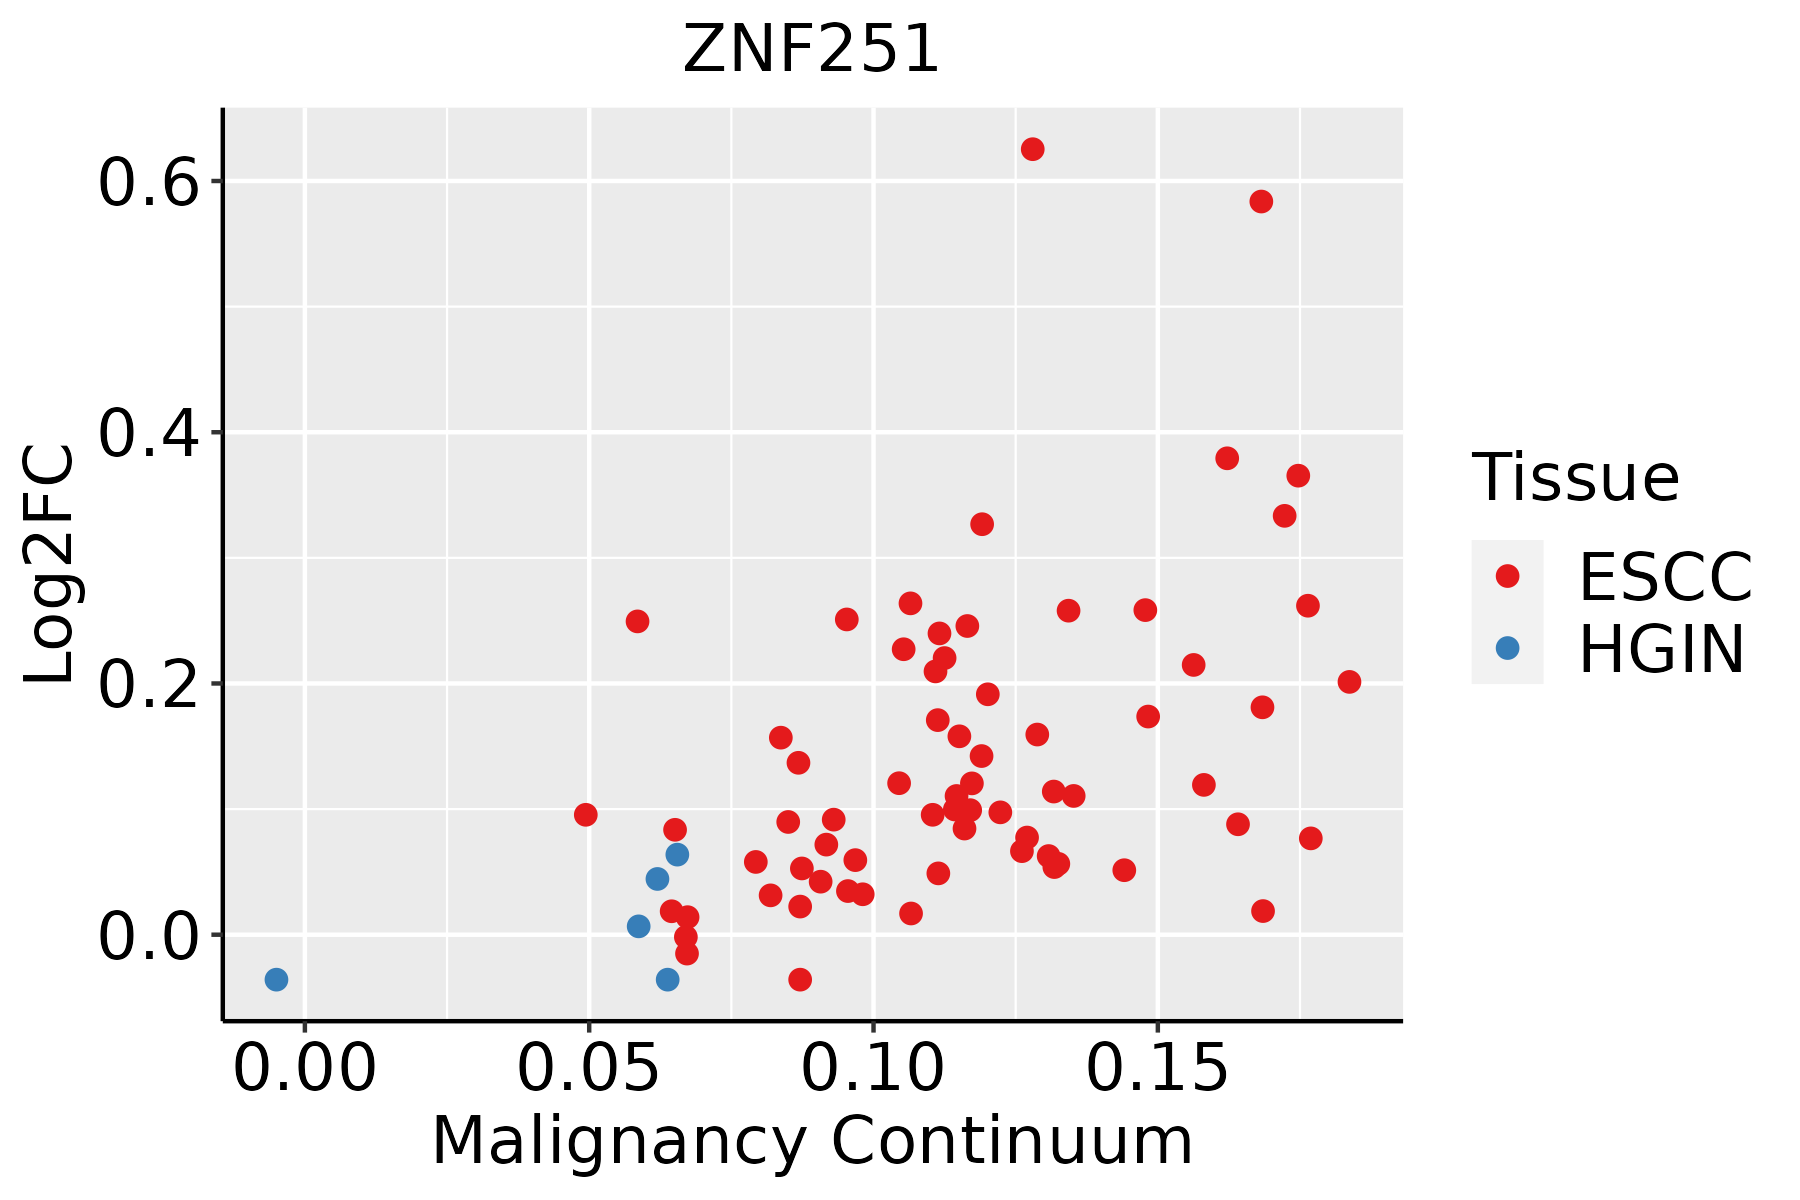 | ESCC: Esophageal squamous cell carcinoma |
| HGIN: High-grade intraepithelial neoplasias | ||
| LGIN: Low-grade intraepithelial neoplasias |
| ∗log2FC in expression of this searched gene in stem-like cells from each diseased tissue sample relative to stem-like cells in normal samples in each tissue plotted against the malignancy continuum. Samples are colored based on if they are from different disease stage. |
Top |
Malignant transformation related pathway analysis |
| Find out the enriched GO biological processes and KEGG pathways involved in transition from healthy to precancer to cancer |
| Tissue | Disease Stage | Enriched GO biological Processes |
| Colorectum | AD |  |
| Colorectum | SER |  |
| Colorectum | MSS |  |
| Colorectum | MSI-H |  |
| Colorectum | FAP |  |
| ∗Top 15 enriched GO BP terms are showed in the bar plot of each disease state in each tissue. Each row represents a significant GO biological process which is colored according to the -log10(p.adjust). |
| Page: 1 2 3 4 5 6 7 8 9 |
| GO ID | Tissue | Disease Stage | Description | Gene Ratio | Bg Ratio | pvalue | p.adjust | Count |
| Page: 1 |
| Pathway ID | Tissue | Disease Stage | Description | Gene Ratio | Bg Ratio | pvalue | p.adjust | qvalue | Count |
| Page: 1 |
Top |
Cell-cell communication analysis |
| Identification of potential cell-cell interactions between two cell types and their ligand-receptor pairs for different disease states |
| Ligand | Receptor | LRpair | Pathway | Tissue | Disease Stage |
| Page: 1 |
Top |
Single-cell gene regulatory network inference analysis |
| Find out the significant the regulons (TFs) and the target genes of each regulon across cell types for different disease states |
| TF | Cell Type | Tissue | Disease Stage | Target Gene | RSS | Regulon Activity |
| ZNF251 | PLA | Endometrium | Healthy | SPATS2L,PHKA2,RAB7A, etc. | 2.58e-02 |  |
| ∗The dot plots of a searched regulon are shown for all cell subpopulations in each disease state of each tissue based on the regulon specific score inferred using pySCENIC and by calculating the average expression. |
| Page: 1 |
Top |
Somatic mutation of malignant transformation related genes |
| Annotation of somatic variants for genes involved in malignant transformation |
| Hugo Symbol | Variant Class | Variant Classification | dbSNP RS | HGVSc | HGVSp | HGVSp Short | SWISSPROT | BIOTYPE | SIFT | PolyPhen | Tumor Sample Barcode | Tissue | Histology | Sex | Age | Stage | Therapy Types | Drugs | Outcome |
| ZNF251 | SNV | Missense_Mutation | novel | c.1342C>G | p.Leu448Val | p.L448V | Q9BRH9 | protein_coding | tolerated(0.07) | possibly_damaging(0.659) | TCGA-3C-AALI-01 | Breast | breast invasive carcinoma | Female | <65 | I/II | Unspecific | Poly E | Complete Response |
| ZNF251 | SNV | Missense_Mutation | c.793N>C | p.Phe265Leu | p.F265L | Q9BRH9 | protein_coding | deleterious(0.01) | possibly_damaging(0.684) | TCGA-A2-A0SW-01 | Breast | breast invasive carcinoma | Female | >=65 | III/IV | Hormone Therapy | arimidex | PD | |
| ZNF251 | SNV | Missense_Mutation | c.1682N>T | p.Thr561Ile | p.T561I | Q9BRH9 | protein_coding | deleterious(0.03) | benign(0.443) | TCGA-A8-A09Z-01 | Breast | breast invasive carcinoma | Female | >=65 | I/II | Unknown | Unknown | SD | |
| ZNF251 | SNV | Missense_Mutation | rs750904460 | c.476N>G | p.Asn159Ser | p.N159S | Q9BRH9 | protein_coding | tolerated(0.74) | benign(0) | TCGA-AN-A046-01 | Breast | breast invasive carcinoma | Female | >=65 | I/II | Unknown | Unknown | SD |
| ZNF251 | SNV | Missense_Mutation | c.1666N>A | p.Arg556Ser | p.R556S | Q9BRH9 | protein_coding | deleterious(0) | benign(0.005) | TCGA-BH-A0HF-01 | Breast | breast invasive carcinoma | Female | >=65 | I/II | Hormone Therapy | arimidex | SD | |
| ZNF251 | SNV | Missense_Mutation | c.464T>C | p.Leu155Ser | p.L155S | Q9BRH9 | protein_coding | tolerated(0.22) | benign(0.017) | TCGA-E9-A295-01 | Breast | breast invasive carcinoma | Female | >=65 | I/II | Hormone Therapy | tamoxiphen | SD | |
| ZNF251 | SNV | Missense_Mutation | rs376486971 | c.1231N>A | p.Gly411Ser | p.G411S | Q9BRH9 | protein_coding | deleterious(0) | possibly_damaging(0.837) | TCGA-EW-A1PH-01 | Breast | breast invasive carcinoma | Female | <65 | I/II | Chemotherapy | cyclophosphamide | SD |
| ZNF251 | SNV | Missense_Mutation | novel | c.574N>G | p.Leu192Val | p.L192V | Q9BRH9 | protein_coding | tolerated(0.5) | benign(0.099) | TCGA-LL-A73Y-01 | Breast | breast invasive carcinoma | Female | >=65 | I/II | Chemotherapy | taxotere | SD |
| ZNF251 | insertion | Frame_Shift_Ins | novel | c.1788_1789insATAGTTCT | p.Gln597IlefsTer21 | p.Q597Ifs*21 | Q9BRH9 | protein_coding | TCGA-A2-A0EY-01 | Breast | breast invasive carcinoma | Female | <65 | I/II | Chemotherapy | adriamycin | SD | ||
| ZNF251 | insertion | Nonsense_Mutation | novel | c.1664_1665insTAGGATGTACTTGGGAAGGAAGGAAGAGAGGTGAAG | p.Arg556_Trp557insMetTyrLeuGlyArgLysGluGluArgTerArgArg | p.R556_W557insMYLGRKEER*RR | Q9BRH9 | protein_coding | TCGA-BH-A0HF-01 | Breast | breast invasive carcinoma | Female | >=65 | I/II | Hormone Therapy | arimidex | SD |
| Page: 1 2 3 4 5 6 7 8 |
Top |
Related drugs of malignant transformation related genes |
| Identification of chemicals and drugs interact with genes involved in malignant transfromation |
| (DGIdb 4.0) |
| Entrez ID | Symbol | Category | Interaction Types | Drug Claim Name | Drug Name | PMIDs |
| Page: 1 |

Copyright 2023-Present -The University of Texas Health Science Center at Houston |