
|
|||||
|
 | |
| |
| |
| |
| |
| |
|
Gene: ZNF250 |
Gene summary for ZNF250 |
| Gene information | Species | Human | Gene symbol | ZNF250 | Gene ID | 58500 |
| Gene name | zinc finger protein 250 | |
| Gene Alias | ZFP647 | |
| Cytomap | 8q24.3 | |
| Gene Type | protein-coding | GO ID | GO:0006139 | UniProtAcc | B3KNS9 |
Top |
Malignant transformation analysis |
| Identification of the aberrant gene expression in precancerous and cancerous lesions by comparing the gene expression of stem-like cells in diseased tissues with normal stem cells |
| Entrez ID | Symbol | Replicates | Species | Organ | Tissue | Adj P-value | Log2FC | Malignancy |
| 58500 | ZNF250 | LZE4T | Human | Esophagus | ESCC | 1.60e-06 | 1.52e-01 | 0.0811 |
| 58500 | ZNF250 | LZE8T | Human | Esophagus | ESCC | 4.24e-03 | 1.12e-01 | 0.067 |
| 58500 | ZNF250 | LZE20T | Human | Esophagus | ESCC | 3.73e-03 | 1.10e-01 | 0.0662 |
| 58500 | ZNF250 | LZE24T | Human | Esophagus | ESCC | 5.64e-10 | 2.12e-01 | 0.0596 |
| 58500 | ZNF250 | P2T-E | Human | Esophagus | ESCC | 4.65e-13 | 2.24e-01 | 0.1177 |
| 58500 | ZNF250 | P4T-E | Human | Esophagus | ESCC | 5.13e-05 | 1.29e-01 | 0.1323 |
| 58500 | ZNF250 | P5T-E | Human | Esophagus | ESCC | 5.56e-04 | 6.93e-02 | 0.1327 |
| 58500 | ZNF250 | P8T-E | Human | Esophagus | ESCC | 6.39e-04 | 1.08e-01 | 0.0889 |
| 58500 | ZNF250 | P9T-E | Human | Esophagus | ESCC | 1.96e-06 | 1.01e-01 | 0.1131 |
| 58500 | ZNF250 | P10T-E | Human | Esophagus | ESCC | 1.54e-10 | 2.17e-01 | 0.116 |
| 58500 | ZNF250 | P11T-E | Human | Esophagus | ESCC | 2.38e-04 | 2.45e-01 | 0.1426 |
| 58500 | ZNF250 | P12T-E | Human | Esophagus | ESCC | 1.10e-17 | 3.63e-01 | 0.1122 |
| 58500 | ZNF250 | P15T-E | Human | Esophagus | ESCC | 1.90e-07 | 1.60e-01 | 0.1149 |
| 58500 | ZNF250 | P16T-E | Human | Esophagus | ESCC | 8.73e-16 | 3.00e-01 | 0.1153 |
| 58500 | ZNF250 | P20T-E | Human | Esophagus | ESCC | 6.30e-12 | 2.05e-01 | 0.1124 |
| 58500 | ZNF250 | P21T-E | Human | Esophagus | ESCC | 5.43e-08 | 1.47e-01 | 0.1617 |
| 58500 | ZNF250 | P22T-E | Human | Esophagus | ESCC | 1.23e-03 | 1.15e-01 | 0.1236 |
| 58500 | ZNF250 | P23T-E | Human | Esophagus | ESCC | 1.92e-10 | 2.42e-01 | 0.108 |
| 58500 | ZNF250 | P24T-E | Human | Esophagus | ESCC | 3.37e-04 | 1.28e-01 | 0.1287 |
| 58500 | ZNF250 | P26T-E | Human | Esophagus | ESCC | 5.51e-28 | 5.08e-01 | 0.1276 |
| Page: 1 2 3 |
| Tissue | Expression Dynamics | Abbreviation |
| Esophagus | 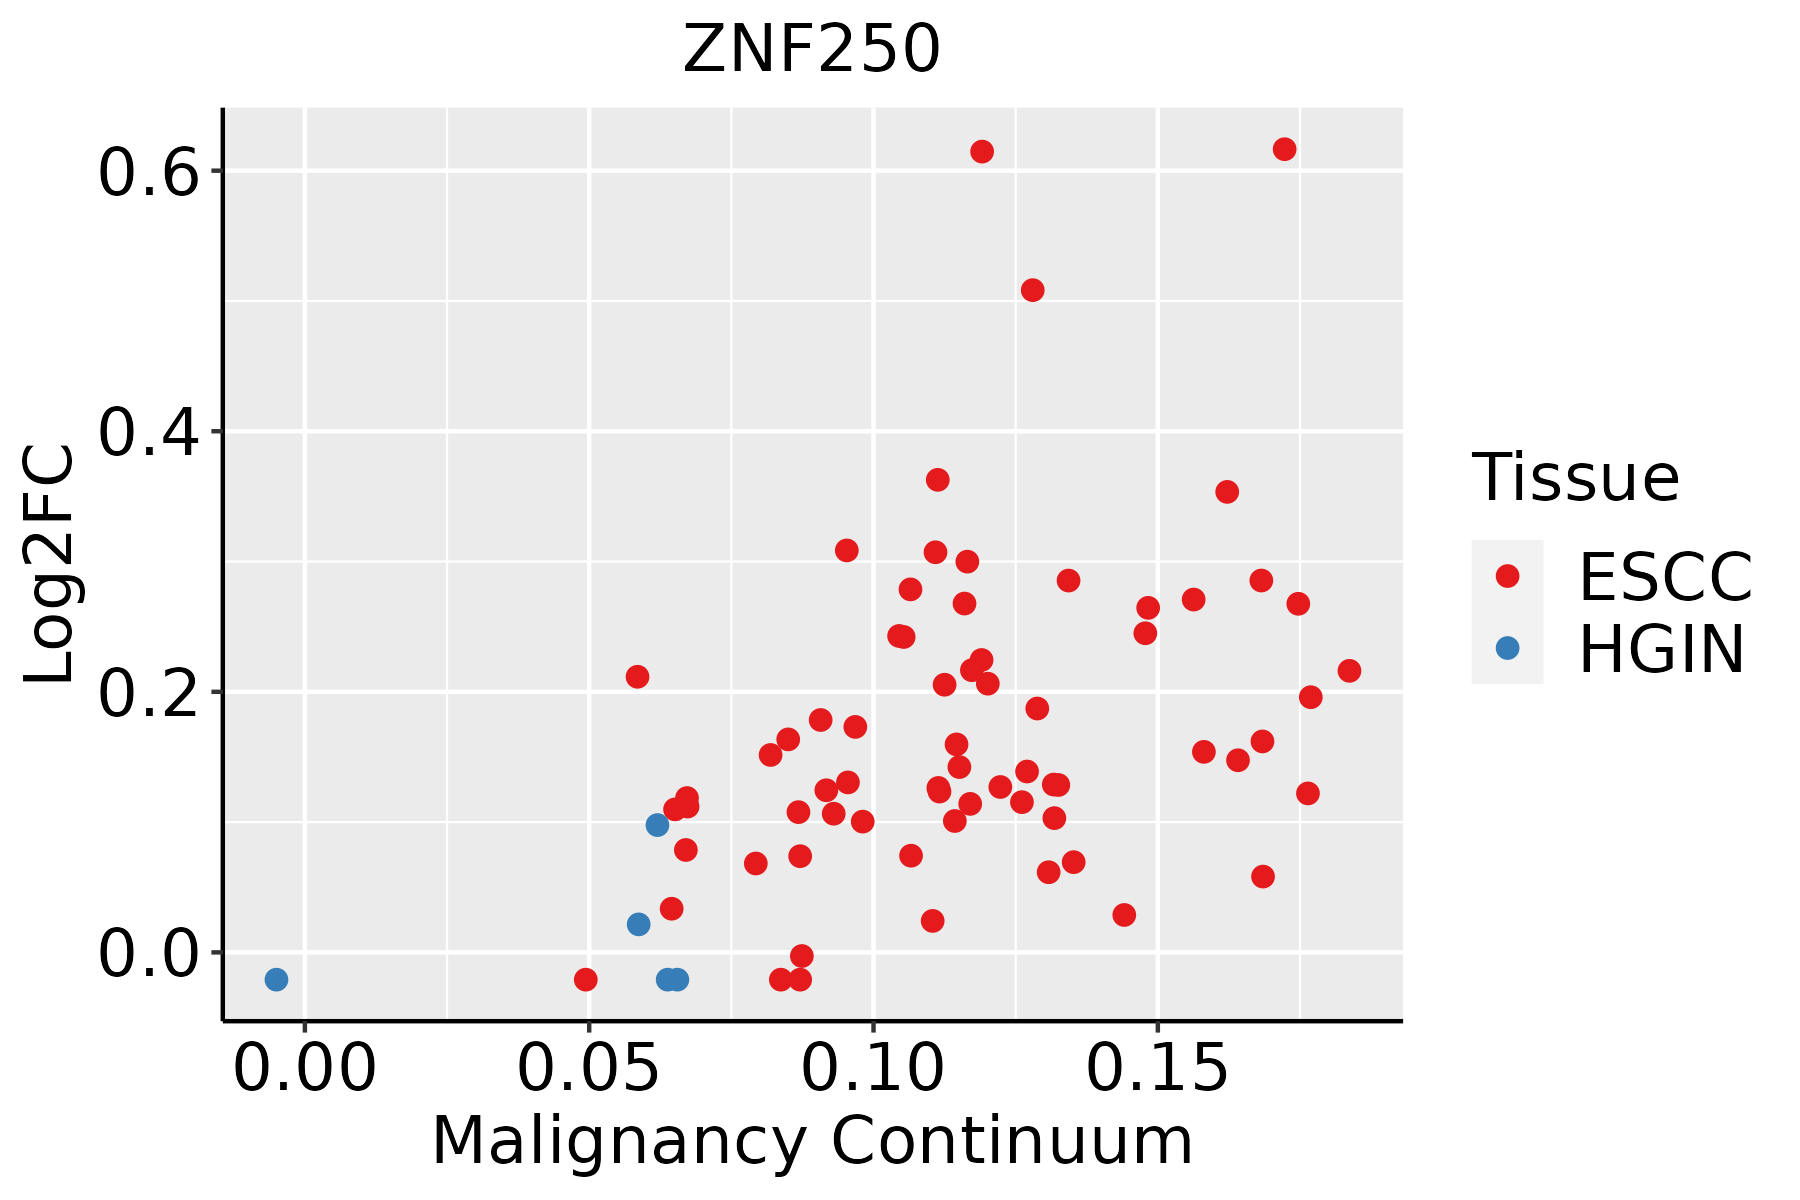 | ESCC: Esophageal squamous cell carcinoma |
| HGIN: High-grade intraepithelial neoplasias | ||
| LGIN: Low-grade intraepithelial neoplasias |
| ∗log2FC in expression of this searched gene in stem-like cells from each diseased tissue sample relative to stem-like cells in normal samples in each tissue plotted against the malignancy continuum. Samples are colored based on if they are from different disease stage. |
Top |
Malignant transformation related pathway analysis |
| Find out the enriched GO biological processes and KEGG pathways involved in transition from healthy to precancer to cancer |
| Tissue | Disease Stage | Enriched GO biological Processes |
| Colorectum | AD |  |
| Colorectum | SER |  |
| Colorectum | MSS |  |
| Colorectum | MSI-H |  |
| Colorectum | FAP |  |
| ∗Top 15 enriched GO BP terms are showed in the bar plot of each disease state in each tissue. Each row represents a significant GO biological process which is colored according to the -log10(p.adjust). |
| Page: 1 2 3 4 5 6 7 8 9 |
| GO ID | Tissue | Disease Stage | Description | Gene Ratio | Bg Ratio | pvalue | p.adjust | Count |
| Page: 1 |
| Pathway ID | Tissue | Disease Stage | Description | Gene Ratio | Bg Ratio | pvalue | p.adjust | qvalue | Count |
| Page: 1 |
Top |
Cell-cell communication analysis |
| Identification of potential cell-cell interactions between two cell types and their ligand-receptor pairs for different disease states |
| Ligand | Receptor | LRpair | Pathway | Tissue | Disease Stage |
| Page: 1 |
Top |
Single-cell gene regulatory network inference analysis |
| Find out the significant the regulons (TFs) and the target genes of each regulon across cell types for different disease states |
| TF | Cell Type | Tissue | Disease Stage | Target Gene | RSS | Regulon Activity |
| ZNF250 | MYOEPI | Breast | IDC | SYT8,PDPN,SQLE, etc. | 8.54e-02 |  |
| ZNF250 | BAS | Breast | Precancer | SYT8,PDPN,SQLE, etc. | 6.05e-02 |  |
| ZNF250 | ICAF | Colorectum | AD | PDE6D,ZNF718,BIRC2, etc. | 4.04e-01 |  |
| ZNF250 | ICAF | Colorectum | MSI-H | PDE6D,ZNF718,BIRC2, etc. | 3.38e-01 |  |
| ZNF250 | ICAF | Colorectum | SER | PDE6D,ZNF718,BIRC2, etc. | 4.34e-01 |  |
| ZNF250 | MAST | Esophagus | Healthy | B3GALNT1,BEX2,ZNF501, etc. | 3.31e-02 |  |
| ZNF250 | pDC | Lung | AIS | GOT2,GTF3C2,FANCA, etc. | 4.97e-02 |  |
| ∗The dot plots of a searched regulon are shown for all cell subpopulations in each disease state of each tissue based on the regulon specific score inferred using pySCENIC and by calculating the average expression. |
| Page: 1 |
Top |
Somatic mutation of malignant transformation related genes |
| Annotation of somatic variants for genes involved in malignant transformation |
| Hugo Symbol | Variant Class | Variant Classification | dbSNP RS | HGVSc | HGVSp | HGVSp Short | SWISSPROT | BIOTYPE | SIFT | PolyPhen | Tumor Sample Barcode | Tissue | Histology | Sex | Age | Stage | Therapy Types | Drugs | Outcome |
| ZNF250 | SNV | Missense_Mutation | c.1508G>A | p.Gly503Asp | p.G503D | P15622 | protein_coding | deleterious(0) | possibly_damaging(0.822) | TCGA-A8-A0A9-01 | Breast | breast invasive carcinoma | Female | >=65 | I/II | Hormone Therapy | anastrozole | SD | |
| ZNF250 | SNV | Missense_Mutation | c.1572N>C | p.Gln524His | p.Q524H | P15622 | protein_coding | tolerated(0.16) | probably_damaging(0.979) | TCGA-AC-A23H-01 | Breast | breast invasive carcinoma | Female | >=65 | I/II | Unknown | Unknown | PD | |
| ZNF250 | SNV | Missense_Mutation | rs561303501 | c.1624C>T | p.Arg542Cys | p.R542C | P15622 | protein_coding | deleterious(0) | probably_damaging(0.916) | TCGA-C8-A27B-01 | Breast | breast invasive carcinoma | Female | <65 | I/II | Chemotherapy | 5-fluorouracil | CR |
| ZNF250 | SNV | Missense_Mutation | c.1195G>C | p.Glu399Gln | p.E399Q | P15622 | protein_coding | deleterious(0.02) | possibly_damaging(0.724) | TCGA-D8-A1J9-01 | Breast | breast invasive carcinoma | Female | <65 | I/II | Unknown | Unknown | SD | |
| ZNF250 | SNV | Missense_Mutation | c.665N>A | p.Thr222Asn | p.T222N | P15622 | protein_coding | deleterious(0.01) | probably_damaging(0.999) | TCGA-E2-A1BD-01 | Breast | breast invasive carcinoma | Female | <65 | I/II | Hormone Therapy | arimidex | SD | |
| ZNF250 | insertion | Nonsense_Mutation | novel | c.997_998insCCTTTATCTGGAGCTTTTAACTTTATTCAAGATCAGAAAGGATATGCT | p.His333delinsProPheIleTrpSerPheTerLeuTyrSerArgSerGluArgIleCysTyr | p.H333delinsPFIWSF*LYSRSERICY | P15622 | protein_coding | TCGA-A8-A06T-01 | Breast | breast invasive carcinoma | Female | >=65 | III/IV | Hormone Therapy | anastrozole | SD | ||
| ZNF250 | insertion | Frame_Shift_Ins | novel | c.1328_1329insGTTCAAGCTTTTCTTGTGCCTCAGTCTCCCAAGT | p.Val444PhefsTer23 | p.V444Ffs*23 | P15622 | protein_coding | TCGA-A8-A081-01 | Breast | breast invasive carcinoma | Female | >=65 | I/II | Unknown | Unknown | SD | ||
| ZNF250 | insertion | In_Frame_Ins | novel | c.447_448insGTGAGTGTGGGA | p.Thr149_Pro150insValSerValGly | p.T149_P150insVSVG | P15622 | protein_coding | TCGA-A8-A08H-01 | Breast | breast invasive carcinoma | Female | >=65 | I/II | Unknown | Unknown | SD | ||
| ZNF250 | insertion | In_Frame_Ins | novel | c.445_446insGCCCTATGAGTG | p.Thr149delinsSerProMetSerAla | p.T149delinsSPMSA | P15622 | protein_coding | TCGA-A8-A08H-01 | Breast | breast invasive carcinoma | Female | >=65 | I/II | Unknown | Unknown | SD | ||
| ZNF250 | insertion | Nonsense_Mutation | novel | c.1253_1254insAAAGTCTTGCTCTTGTTCCCCAGGCTGAAG | p.Thr418_Glu419insLysSerCysSerCysSerProGlyTerSer | p.T418_E419insKSCSCSPG*S | P15622 | protein_coding | TCGA-A8-A09B-01 | Breast | breast invasive carcinoma | Female | <65 | III/IV | Chemotherapy | 5-fluorouracil | SD |
| Page: 1 2 3 4 5 6 |
Top |
Related drugs of malignant transformation related genes |
| Identification of chemicals and drugs interact with genes involved in malignant transfromation |
| (DGIdb 4.0) |
| Entrez ID | Symbol | Category | Interaction Types | Drug Claim Name | Drug Name | PMIDs |
| Page: 1 |

Copyright 2023-Present -The University of Texas Health Science Center at Houston |