
|
|||||
|
 | |
| |
| |
| |
| |
| |
|
Gene: ZNF226 |
Gene summary for ZNF226 |
| Gene information | Species | Human | Gene symbol | ZNF226 | Gene ID | 7769 |
| Gene name | zinc finger protein 226 | |
| Gene Alias | ZNF226 | |
| Cytomap | 19q13.31 | |
| Gene Type | protein-coding | GO ID | GO:0006139 | UniProtAcc | A0A024R0P4 |
Top |
Malignant transformation analysis |
| Identification of the aberrant gene expression in precancerous and cancerous lesions by comparing the gene expression of stem-like cells in diseased tissues with normal stem cells |
| Entrez ID | Symbol | Replicates | Species | Organ | Tissue | Adj P-value | Log2FC | Malignancy |
| 7769 | ZNF226 | LZE24T | Human | Esophagus | ESCC | 5.45e-10 | 1.38e-01 | 0.0596 |
| 7769 | ZNF226 | P2T-E | Human | Esophagus | ESCC | 3.09e-07 | 1.00e-01 | 0.1177 |
| 7769 | ZNF226 | P4T-E | Human | Esophagus | ESCC | 1.37e-09 | 2.60e-01 | 0.1323 |
| 7769 | ZNF226 | P5T-E | Human | Esophagus | ESCC | 4.96e-09 | 9.46e-02 | 0.1327 |
| 7769 | ZNF226 | P8T-E | Human | Esophagus | ESCC | 1.26e-33 | 5.97e-01 | 0.0889 |
| 7769 | ZNF226 | P10T-E | Human | Esophagus | ESCC | 5.43e-45 | 6.57e-01 | 0.116 |
| 7769 | ZNF226 | P11T-E | Human | Esophagus | ESCC | 9.38e-07 | 3.34e-01 | 0.1426 |
| 7769 | ZNF226 | P12T-E | Human | Esophagus | ESCC | 1.02e-18 | 2.33e-01 | 0.1122 |
| 7769 | ZNF226 | P15T-E | Human | Esophagus | ESCC | 2.11e-10 | 1.85e-01 | 0.1149 |
| 7769 | ZNF226 | P16T-E | Human | Esophagus | ESCC | 1.32e-09 | 6.40e-02 | 0.1153 |
| 7769 | ZNF226 | P20T-E | Human | Esophagus | ESCC | 5.95e-04 | 2.34e-01 | 0.1124 |
| 7769 | ZNF226 | P21T-E | Human | Esophagus | ESCC | 4.07e-08 | 5.59e-02 | 0.1617 |
| 7769 | ZNF226 | P22T-E | Human | Esophagus | ESCC | 1.80e-15 | 1.81e-01 | 0.1236 |
| 7769 | ZNF226 | P23T-E | Human | Esophagus | ESCC | 9.59e-05 | 1.10e-01 | 0.108 |
| 7769 | ZNF226 | P24T-E | Human | Esophagus | ESCC | 2.24e-07 | 1.14e-01 | 0.1287 |
| 7769 | ZNF226 | P26T-E | Human | Esophagus | ESCC | 2.91e-18 | 2.48e-01 | 0.1276 |
| 7769 | ZNF226 | P27T-E | Human | Esophagus | ESCC | 1.13e-14 | 2.09e-01 | 0.1055 |
| 7769 | ZNF226 | P28T-E | Human | Esophagus | ESCC | 6.54e-10 | 7.99e-02 | 0.1149 |
| 7769 | ZNF226 | P30T-E | Human | Esophagus | ESCC | 8.66e-04 | 1.74e-01 | 0.137 |
| 7769 | ZNF226 | P31T-E | Human | Esophagus | ESCC | 1.64e-11 | 1.58e-01 | 0.1251 |
| Page: 1 2 3 4 |
| Tissue | Expression Dynamics | Abbreviation |
| Esophagus | 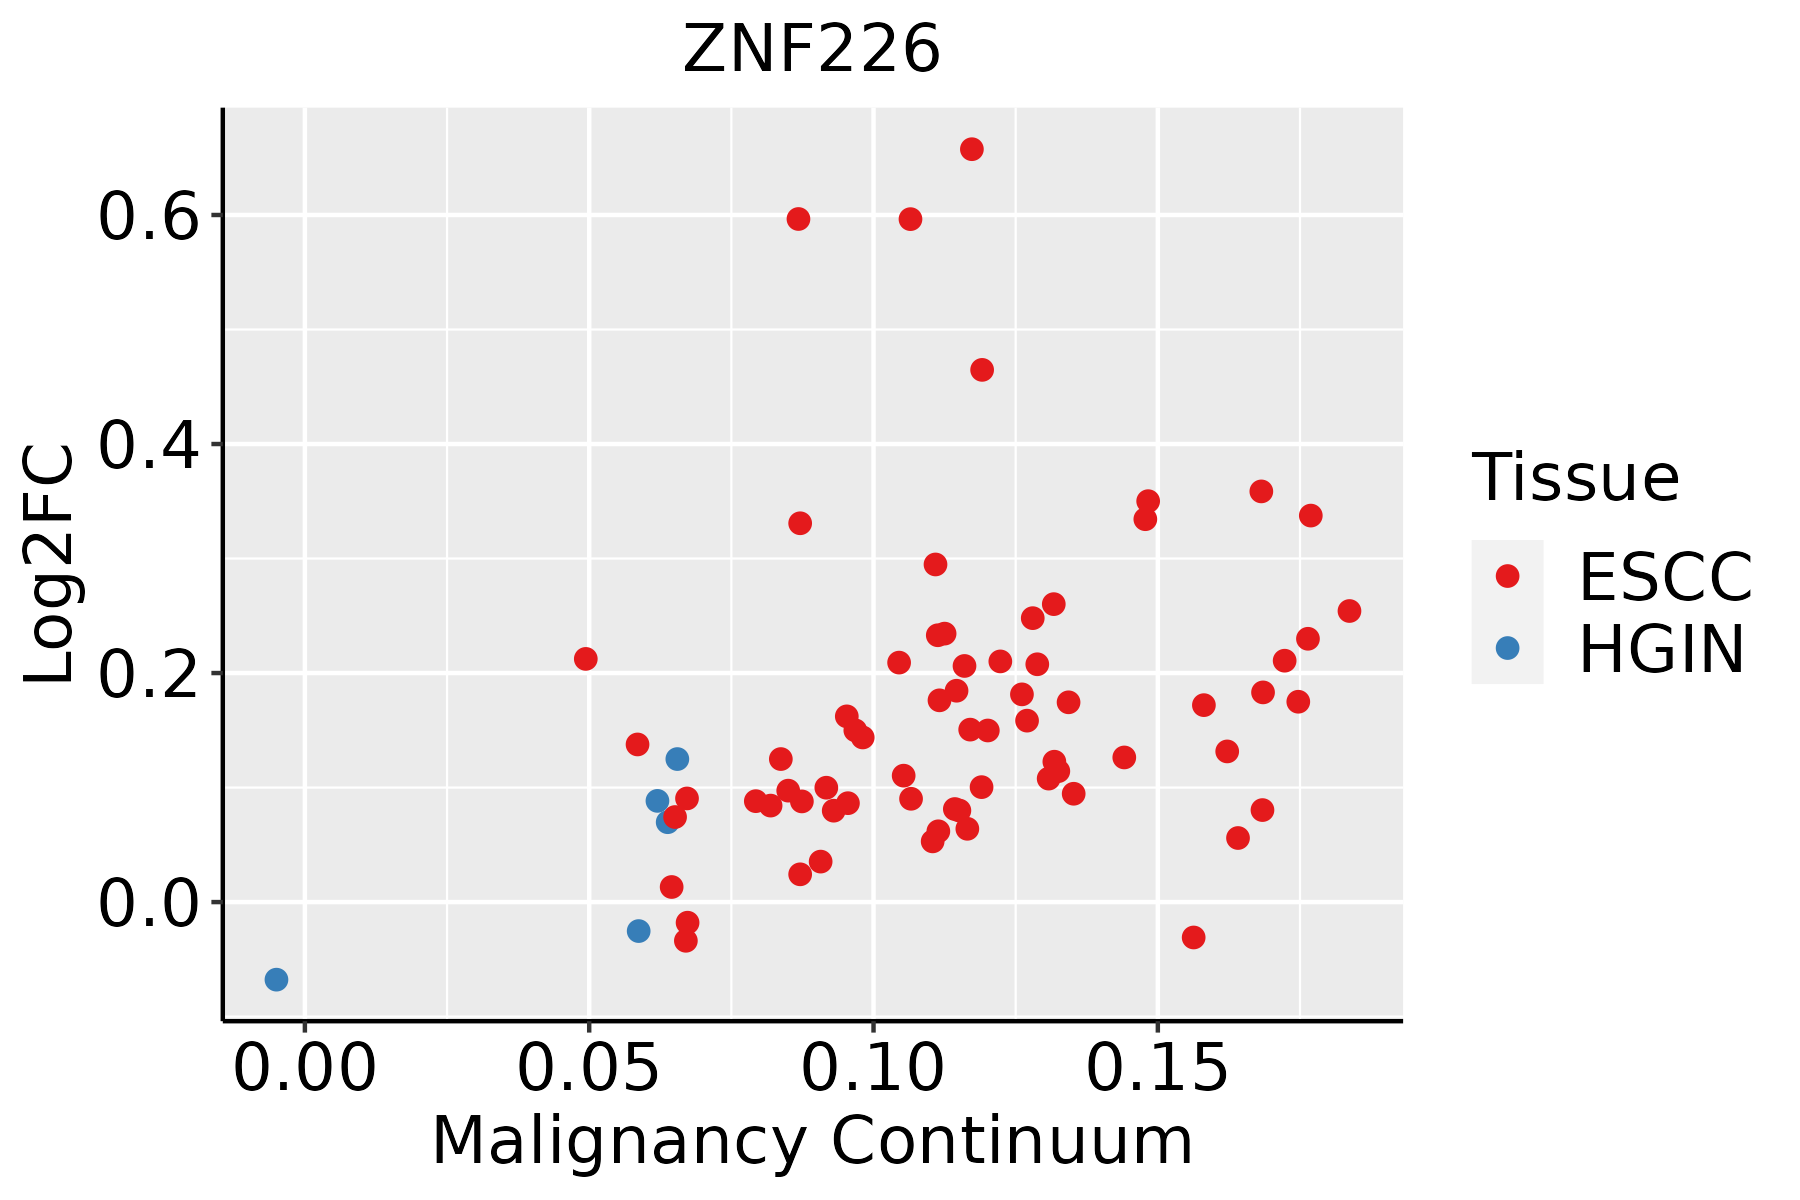 | ESCC: Esophageal squamous cell carcinoma |
| HGIN: High-grade intraepithelial neoplasias | ||
| LGIN: Low-grade intraepithelial neoplasias | ||
| Liver | 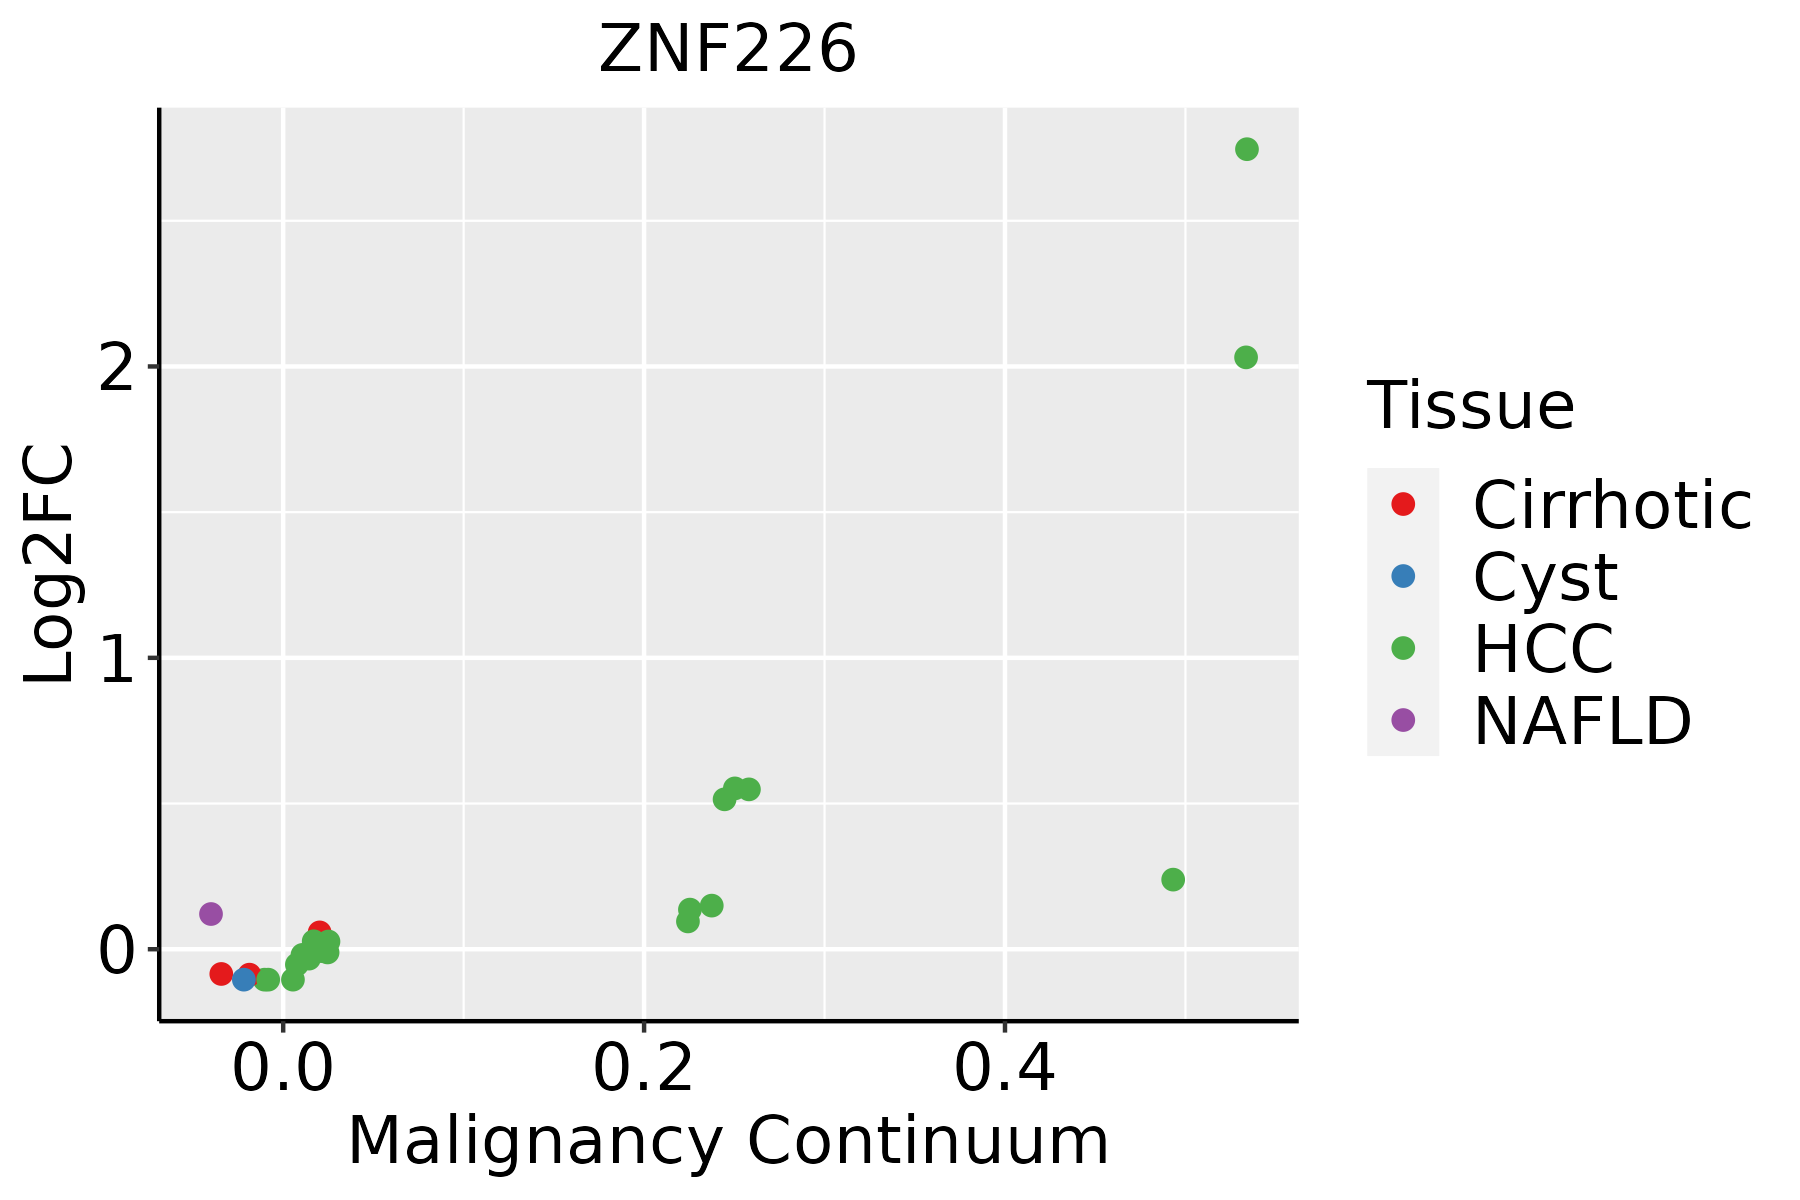 | HCC: Hepatocellular carcinoma |
| NAFLD: Non-alcoholic fatty liver disease | ||
| Oral Cavity |  | EOLP: Erosive Oral lichen planus |
| LP: leukoplakia | ||
| NEOLP: Non-erosive oral lichen planus | ||
| OSCC: Oral squamous cell carcinoma |
| ∗log2FC in expression of this searched gene in stem-like cells from each diseased tissue sample relative to stem-like cells in normal samples in each tissue plotted against the malignancy continuum. Samples are colored based on if they are from different disease stage. |
Top |
Malignant transformation related pathway analysis |
| Find out the enriched GO biological processes and KEGG pathways involved in transition from healthy to precancer to cancer |
| Tissue | Disease Stage | Enriched GO biological Processes |
| Colorectum | AD |  |
| Colorectum | SER |  |
| Colorectum | MSS |  |
| Colorectum | MSI-H |  |
| Colorectum | FAP |  |
| ∗Top 15 enriched GO BP terms are showed in the bar plot of each disease state in each tissue. Each row represents a significant GO biological process which is colored according to the -log10(p.adjust). |
| Page: 1 2 3 4 5 6 7 8 9 |
| GO ID | Tissue | Disease Stage | Description | Gene Ratio | Bg Ratio | pvalue | p.adjust | Count |
| Page: 1 |
| Pathway ID | Tissue | Disease Stage | Description | Gene Ratio | Bg Ratio | pvalue | p.adjust | qvalue | Count |
| Page: 1 |
Top |
Cell-cell communication analysis |
| Identification of potential cell-cell interactions between two cell types and their ligand-receptor pairs for different disease states |
| Ligand | Receptor | LRpair | Pathway | Tissue | Disease Stage |
| Page: 1 |
Top |
Single-cell gene regulatory network inference analysis |
| Find out the significant the regulons (TFs) and the target genes of each regulon across cell types for different disease states |
| TF | Cell Type | Tissue | Disease Stage | Target Gene | RSS | Regulon Activity |
| ZNF226 | MLUM | Breast | ADJ | MS4A7,KISS1R,SPTSSB, etc. | 3.70e-01 |  |
| ZNF226 | MLUM | Breast | Precancer | MS4A7,KISS1R,SPTSSB, etc. | 3.29e-01 |  |
| ZNF226 | MSC | Breast | DCIS | NME2,BX255923.2,CSF3, etc. | 3.42e-02 |  |
| ZNF226 | PFIB | Liver | Cirrhotic | SCD5,FABP4,GPSM1, etc. | 1.83e-01 |  |
| ZNF226 | ADIPO | Skin | ADJ | SARAF,ZNF688,P2RY14, etc. | 0.00e+00 |  |
| ZNF226 | DPC | Skin | Healthy | SARAF,ZNF688,P2RY14, etc. | 8.71e-03 |  |
| ZNF226 | MSC.PVA | Skin | Healthy | SARAF,ZNF688,P2RY14, etc. | 0.00e+00 | |
| ZNF226 | PTC | Thyroid | Healthy | PEX3,IMMP1L,SERPINB6, etc. | 2.03e-02 |  |
| ∗The dot plots of a searched regulon are shown for all cell subpopulations in each disease state of each tissue based on the regulon specific score inferred using pySCENIC and by calculating the average expression. |
| Page: 1 |
Top |
Somatic mutation of malignant transformation related genes |
| Annotation of somatic variants for genes involved in malignant transformation |
| Hugo Symbol | Variant Class | Variant Classification | dbSNP RS | HGVSc | HGVSp | HGVSp Short | SWISSPROT | BIOTYPE | SIFT | PolyPhen | Tumor Sample Barcode | Tissue | Histology | Sex | Age | Stage | Therapy Types | Drugs | Outcome |
| ZNF226 | SNV | Missense_Mutation | c.850N>C | p.Glu284Gln | p.E284Q | Q9NYT6 | protein_coding | tolerated(0.22) | benign(0.118) | TCGA-AC-A23H-01 | Breast | breast invasive carcinoma | Female | >=65 | I/II | Unknown | Unknown | PD | |
| ZNF226 | SNV | Missense_Mutation | novel | c.1520N>G | p.Glu507Gly | p.E507G | Q9NYT6 | protein_coding | deleterious(0.02) | probably_damaging(0.999) | TCGA-C8-A8HQ-01 | Breast | breast invasive carcinoma | Female | <65 | I/II | Unknown | Unknown | SD |
| ZNF226 | SNV | Missense_Mutation | novel | c.2154N>T | p.Gln718His | p.Q718H | Q9NYT6 | protein_coding | tolerated(0.1) | probably_damaging(0.997) | TCGA-C8-A8HQ-01 | Breast | breast invasive carcinoma | Female | <65 | I/II | Unknown | Unknown | SD |
| ZNF226 | SNV | Missense_Mutation | novel | c.766N>C | p.Glu256Gln | p.E256Q | Q9NYT6 | protein_coding | deleterious(0.04) | benign(0.213) | TCGA-E2-A1LG-01 | Breast | breast invasive carcinoma | Female | <65 | I/II | Chemotherapy | doxorubicin | SD |
| ZNF226 | deletion | Frame_Shift_Del | novel | c.151delN | p.Phe52SerfsTer8 | p.F52Sfs*8 | Q9NYT6 | protein_coding | TCGA-EW-A2FV-01 | Breast | breast invasive carcinoma | Female | <65 | III/IV | Chemotherapy | docetaxel | SD | ||
| ZNF226 | deletion | Frame_Shift_Del | novel | c.971delN | p.His325IlefsTer6 | p.H325Ifs*6 | Q9NYT6 | protein_coding | TCGA-EW-A2FV-01 | Breast | breast invasive carcinoma | Female | <65 | III/IV | Chemotherapy | docetaxel | SD | ||
| ZNF226 | SNV | Missense_Mutation | novel | c.1967N>T | p.Ala656Val | p.A656V | Q9NYT6 | protein_coding | deleterious(0.03) | benign(0.059) | TCGA-2W-A8YY-01 | Cervix | cervical & endocervical cancer | Female | <65 | I/II | Chemotherapy | cisplatin | CR |
| ZNF226 | SNV | Missense_Mutation | c.1549N>T | p.His517Tyr | p.H517Y | Q9NYT6 | protein_coding | tolerated(1) | probably_damaging(0.923) | TCGA-C5-A1MH-01 | Cervix | cervical & endocervical cancer | Female | >=65 | III/IV | Chemotherapy | cisplatin | PD | |
| ZNF226 | SNV | Missense_Mutation | novel | c.1309C>A | p.His437Asn | p.H437N | Q9NYT6 | protein_coding | deleterious(0) | probably_damaging(0.999) | TCGA-C5-A7X5-01 | Cervix | cervical & endocervical cancer | Female | >=65 | I/II | Chemotherapy | carboplatin | PD |
| ZNF226 | SNV | Missense_Mutation | novel | c.1264N>A | p.Glu422Lys | p.E422K | Q9NYT6 | protein_coding | tolerated(0.22) | benign(0.036) | TCGA-DS-A1OB-01 | Cervix | cervical & endocervical cancer | Female | <65 | I/II | Chemotherapy | carboplatin | PD |
| Page: 1 2 3 4 5 6 7 8 9 |
Top |
Related drugs of malignant transformation related genes |
| Identification of chemicals and drugs interact with genes involved in malignant transfromation |
| (DGIdb 4.0) |
| Entrez ID | Symbol | Category | Interaction Types | Drug Claim Name | Drug Name | PMIDs |
| Page: 1 |

Copyright 2023-Present -The University of Texas Health Science Center at Houston |