
|
|||||
|
 | |
| |
| |
| |
| |
| |
|
Gene: ZNF224 |
Gene summary for ZNF224 |
| Gene information | Species | Human | Gene symbol | ZNF224 | Gene ID | 7767 |
| Gene name | zinc finger protein 224 | |
| Gene Alias | BMZF-2 | |
| Cytomap | 19q13.31 | |
| Gene Type | protein-coding | GO ID | GO:0000122 | UniProtAcc | Q9NZL3 |
Top |
Malignant transformation analysis |
| Identification of the aberrant gene expression in precancerous and cancerous lesions by comparing the gene expression of stem-like cells in diseased tissues with normal stem cells |
| Entrez ID | Symbol | Replicates | Species | Organ | Tissue | Adj P-value | Log2FC | Malignancy |
| 7767 | ZNF224 | LZE4T | Human | Esophagus | ESCC | 8.07e-03 | 1.40e-01 | 0.0811 |
| 7767 | ZNF224 | LZE7T | Human | Esophagus | ESCC | 3.58e-03 | 1.54e-01 | 0.0667 |
| 7767 | ZNF224 | LZE8T | Human | Esophagus | ESCC | 9.12e-04 | 1.22e-01 | 0.067 |
| 7767 | ZNF224 | LZE20T | Human | Esophagus | ESCC | 2.17e-02 | 9.65e-02 | 0.0662 |
| 7767 | ZNF224 | LZE24T | Human | Esophagus | ESCC | 7.83e-09 | 2.23e-01 | 0.0596 |
| 7767 | ZNF224 | P1T-E | Human | Esophagus | ESCC | 2.15e-05 | 2.90e-01 | 0.0875 |
| 7767 | ZNF224 | P2T-E | Human | Esophagus | ESCC | 2.02e-06 | 1.90e-01 | 0.1177 |
| 7767 | ZNF224 | P4T-E | Human | Esophagus | ESCC | 5.31e-06 | 1.67e-01 | 0.1323 |
| 7767 | ZNF224 | P5T-E | Human | Esophagus | ESCC | 7.90e-03 | 5.39e-02 | 0.1327 |
| 7767 | ZNF224 | P8T-E | Human | Esophagus | ESCC | 3.41e-42 | 6.84e-01 | 0.0889 |
| 7767 | ZNF224 | P9T-E | Human | Esophagus | ESCC | 3.99e-02 | 1.06e-01 | 0.1131 |
| 7767 | ZNF224 | P10T-E | Human | Esophagus | ESCC | 1.15e-45 | 6.33e-01 | 0.116 |
| 7767 | ZNF224 | P11T-E | Human | Esophagus | ESCC | 1.06e-11 | 3.66e-01 | 0.1426 |
| 7767 | ZNF224 | P12T-E | Human | Esophagus | ESCC | 9.53e-09 | 1.52e-01 | 0.1122 |
| 7767 | ZNF224 | P15T-E | Human | Esophagus | ESCC | 5.40e-05 | 1.41e-01 | 0.1149 |
| 7767 | ZNF224 | P16T-E | Human | Esophagus | ESCC | 8.40e-04 | 7.35e-02 | 0.1153 |
| 7767 | ZNF224 | P17T-E | Human | Esophagus | ESCC | 3.40e-04 | 2.46e-01 | 0.1278 |
| 7767 | ZNF224 | P20T-E | Human | Esophagus | ESCC | 1.45e-07 | 2.04e-01 | 0.1124 |
| 7767 | ZNF224 | P21T-E | Human | Esophagus | ESCC | 7.90e-03 | 7.29e-02 | 0.1617 |
| 7767 | ZNF224 | P22T-E | Human | Esophagus | ESCC | 1.30e-15 | 2.61e-01 | 0.1236 |
| Page: 1 2 3 4 |
| Tissue | Expression Dynamics | Abbreviation |
| Esophagus | 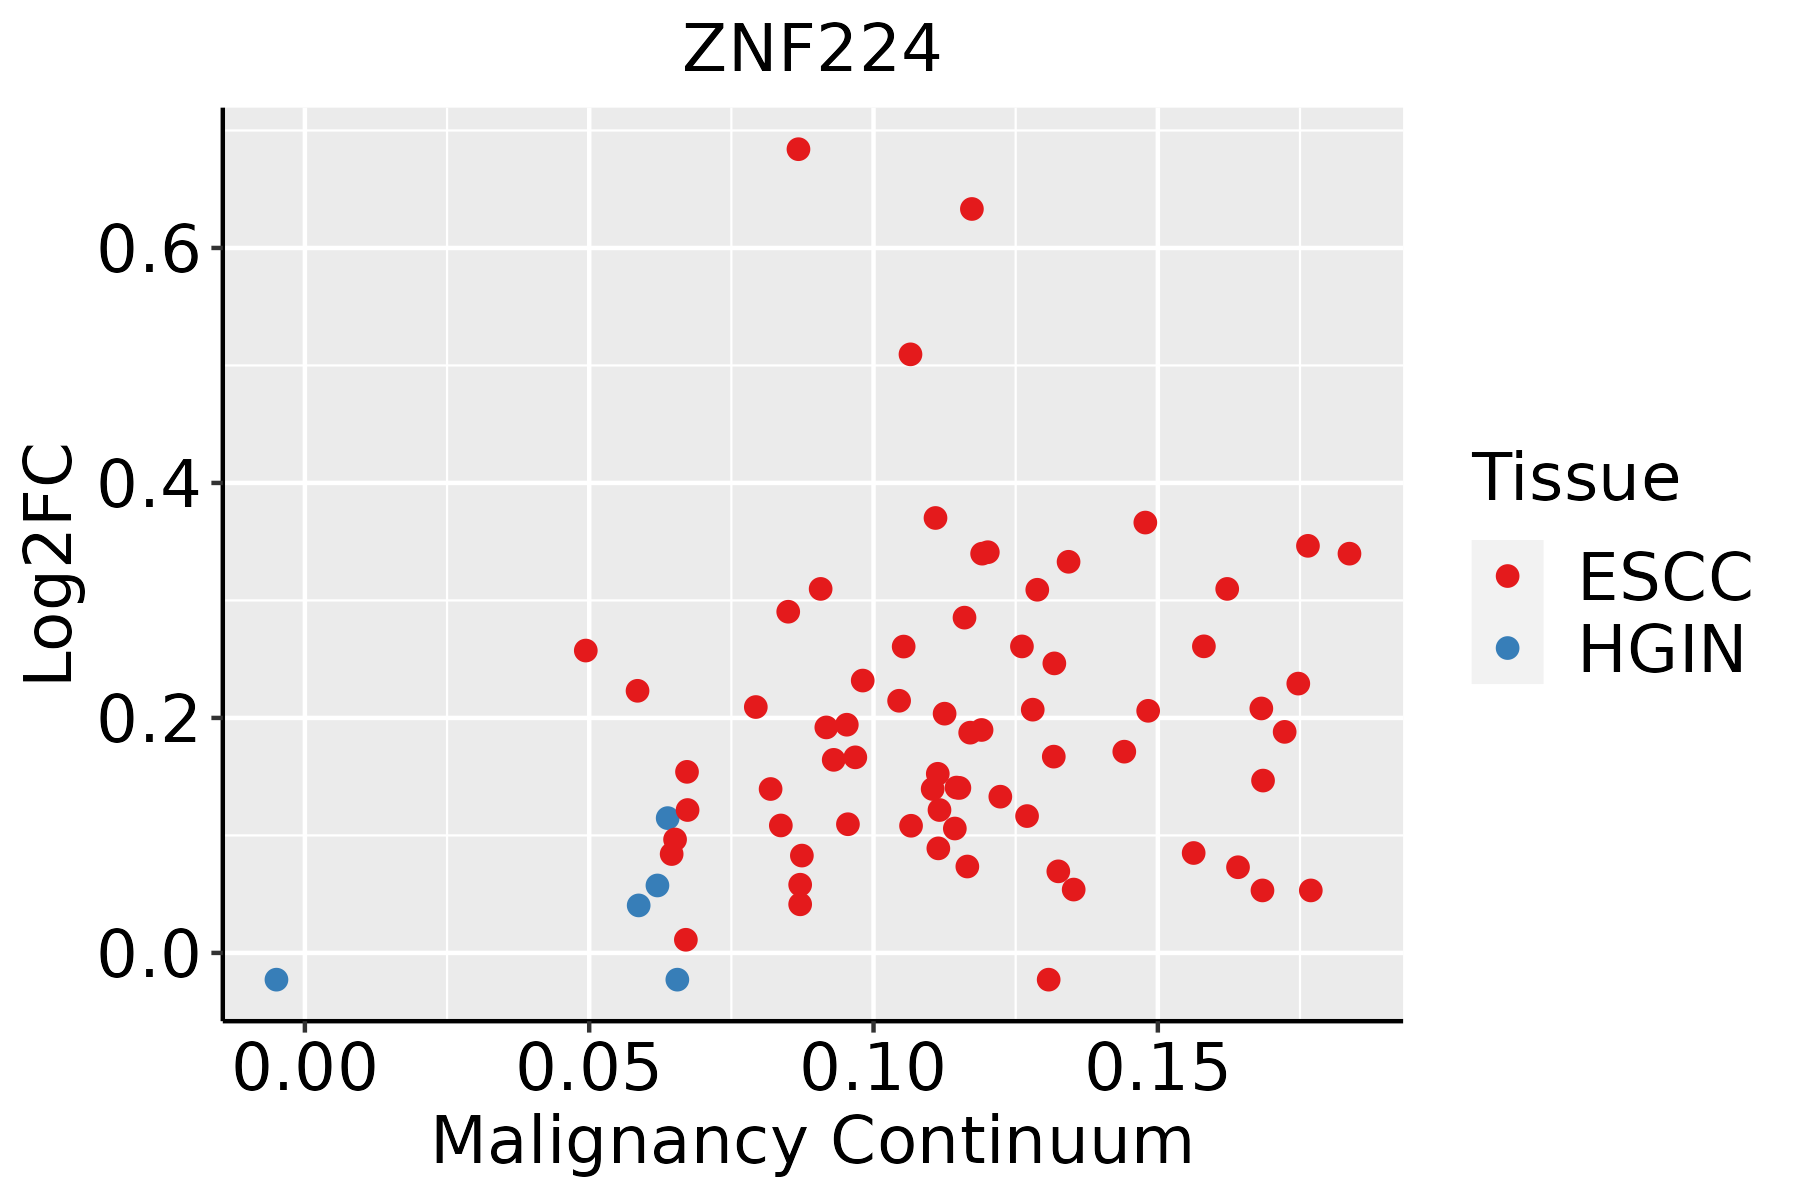 | ESCC: Esophageal squamous cell carcinoma |
| HGIN: High-grade intraepithelial neoplasias | ||
| LGIN: Low-grade intraepithelial neoplasias | ||
| Thyroid | 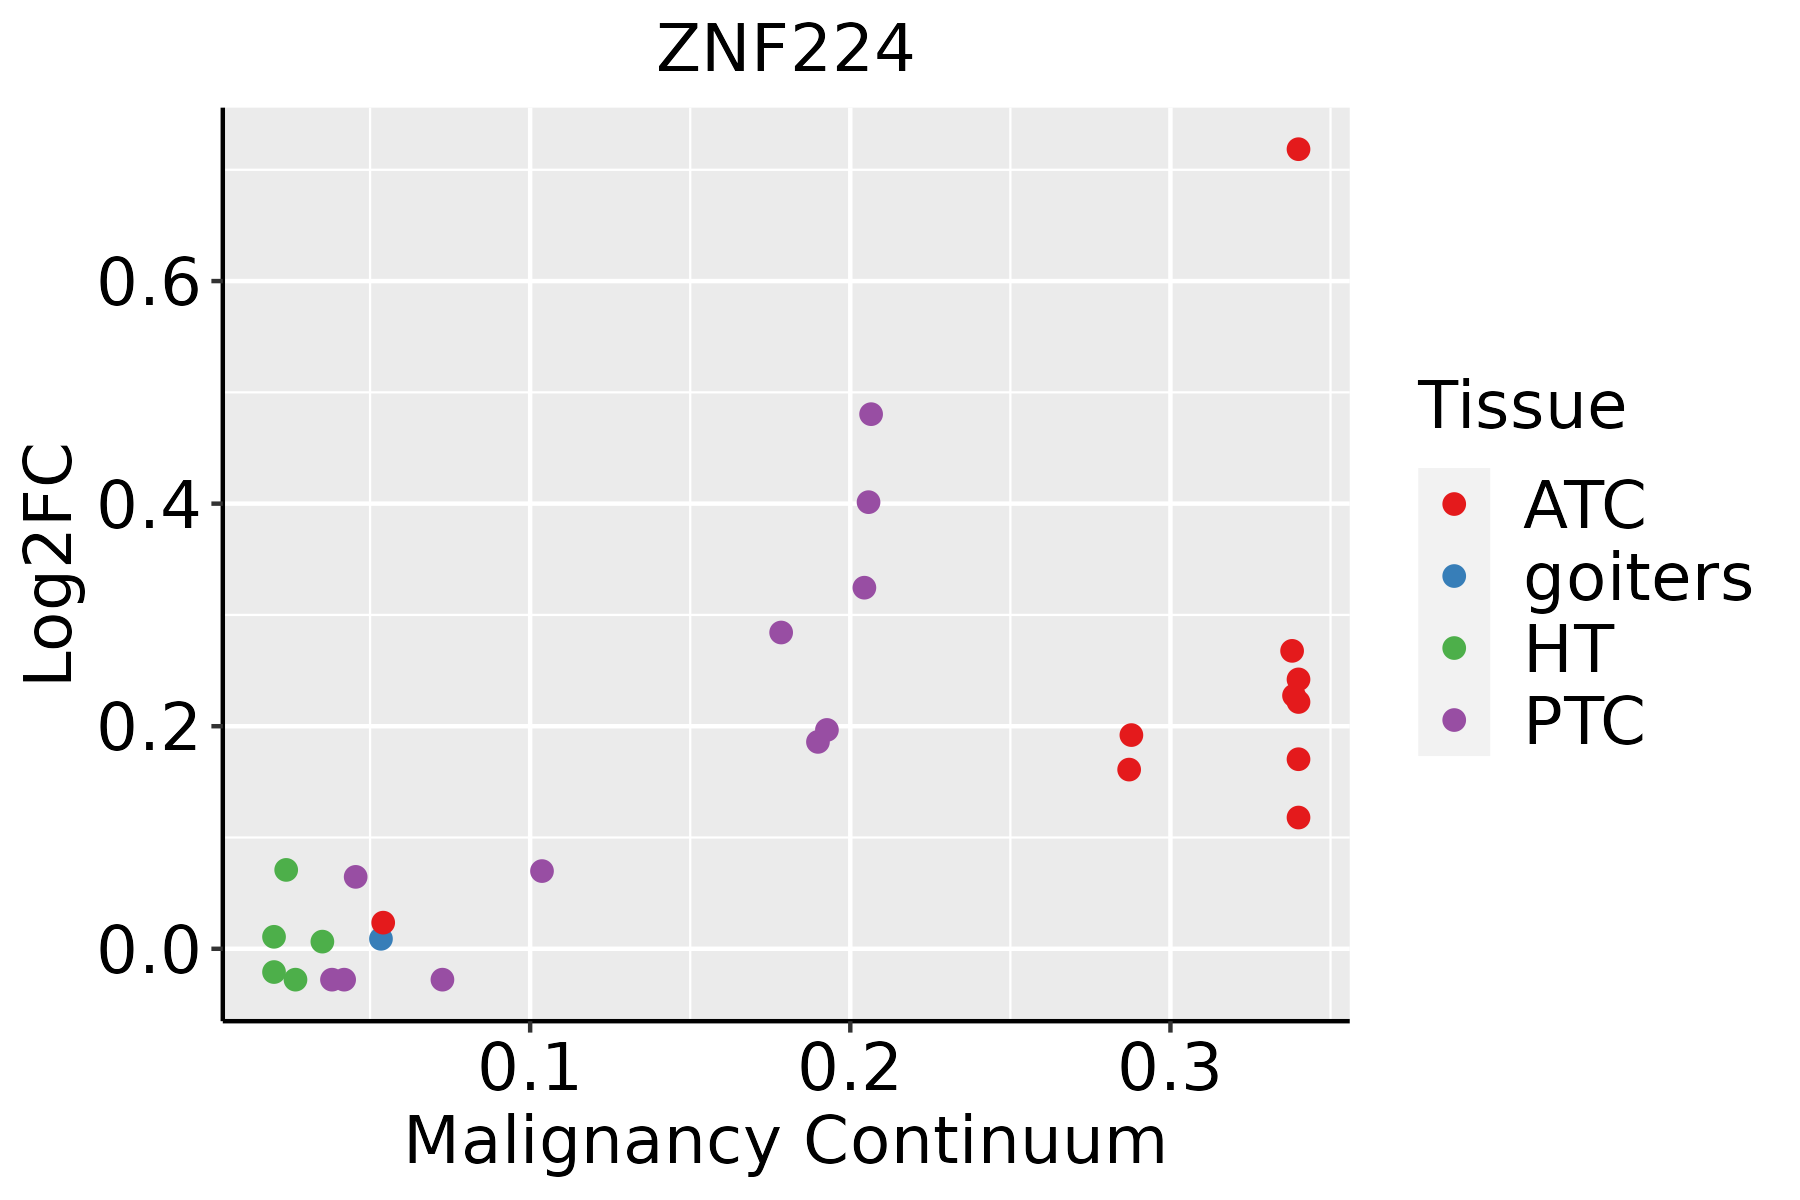 | ATC: Anaplastic thyroid cancer |
| HT: Hashimoto's thyroiditis | ||
| PTC: Papillary thyroid cancer |
| ∗log2FC in expression of this searched gene in stem-like cells from each diseased tissue sample relative to stem-like cells in normal samples in each tissue plotted against the malignancy continuum. Samples are colored based on if they are from different disease stage. |
Top |
Malignant transformation related pathway analysis |
| Find out the enriched GO biological processes and KEGG pathways involved in transition from healthy to precancer to cancer |
| Tissue | Disease Stage | Enriched GO biological Processes |
| Colorectum | AD |  |
| Colorectum | SER |  |
| Colorectum | MSS |  |
| Colorectum | MSI-H |  |
| Colorectum | FAP |  |
| ∗Top 15 enriched GO BP terms are showed in the bar plot of each disease state in each tissue. Each row represents a significant GO biological process which is colored according to the -log10(p.adjust). |
| Page: 1 2 3 4 5 6 7 8 9 |
| GO ID | Tissue | Disease Stage | Description | Gene Ratio | Bg Ratio | pvalue | p.adjust | Count |
| Page: 1 |
| Pathway ID | Tissue | Disease Stage | Description | Gene Ratio | Bg Ratio | pvalue | p.adjust | qvalue | Count |
| Page: 1 |
Top |
Cell-cell communication analysis |
| Identification of potential cell-cell interactions between two cell types and their ligand-receptor pairs for different disease states |
| Ligand | Receptor | LRpair | Pathway | Tissue | Disease Stage |
| Page: 1 |
Top |
Single-cell gene regulatory network inference analysis |
| Find out the significant the regulons (TFs) and the target genes of each regulon across cell types for different disease states |
| TF | Cell Type | Tissue | Disease Stage | Target Gene | RSS | Regulon Activity |
| ZNF224 | QUIE | Esophagus | ADJ | BMP4,ZNF302,RP11-1000B6.3, etc. | 1.23e-01 |  |
| ZNF224 | CD8TEXP | Thyroid | ADJ | AC099811.4,TXK,ALDOC, etc. | 1.78e-02 |  |
| ZNF224 | CD8TEXP | Thyroid | ATC | AC099811.4,TXK,ALDOC, etc. | 2.87e-02 |  |
| ZNF224 | CD8TCM | Thyroid | HT | AC099811.4,TXK,ALDOC, etc. | 5.22e-02 |  |
| ZNF224 | CD8TEXINT | Thyroid | PTC | AC099811.4,TXK,ALDOC, etc. | 1.86e-02 |  |
| ZNF224 | CD4TN | Thyroid | PTC | AC099811.4,TXK,ALDOC, etc. | 1.99e-01 | |
| ∗The dot plots of a searched regulon are shown for all cell subpopulations in each disease state of each tissue based on the regulon specific score inferred using pySCENIC and by calculating the average expression. |
| Page: 1 |
Top |
Somatic mutation of malignant transformation related genes |
| Annotation of somatic variants for genes involved in malignant transformation |
| Hugo Symbol | Variant Class | Variant Classification | dbSNP RS | HGVSc | HGVSp | HGVSp Short | SWISSPROT | BIOTYPE | SIFT | PolyPhen | Tumor Sample Barcode | Tissue | Histology | Sex | Age | Stage | Therapy Types | Drugs | Outcome |
| ZNF224 | SNV | Missense_Mutation | rs3746323 | c.1516N>G | p.His506Asp | p.H506D | Q9NZL3 | protein_coding | deleterious(0) | probably_damaging(0.969) | TCGA-AN-A0XW-01 | Breast | breast invasive carcinoma | Female | <65 | III/IV | Unknown | Unknown | SD |
| ZNF224 | SNV | Missense_Mutation | c.905G>C | p.Arg302Thr | p.R302T | Q9NZL3 | protein_coding | tolerated(0.41) | benign(0.215) | TCGA-B6-A0RE-01 | Breast | breast invasive carcinoma | Female | <65 | I/II | Unknown | Unknown | SD | |
| ZNF224 | SNV | Missense_Mutation | c.1826C>T | p.Ser609Leu | p.S609L | Q9NZL3 | protein_coding | tolerated(0.12) | probably_damaging(0.987) | TCGA-BH-A202-01 | Breast | breast invasive carcinoma | Female | <65 | I/II | Chemotherapy | carboplatin | CR | |
| ZNF224 | insertion | In_Frame_Ins | novel | c.1084_1085insGCTCCAACTCCTGGGTTCTTGCCATTCTCCTGCCTCAGCCTCCCGAGT | p.His362delinsArgSerAsnSerTrpValLeuAlaIleLeuLeuProGlnProProGluTyr | p.H362delinsRSNSWVLAILLPQPPEY | Q9NZL3 | protein_coding | TCGA-AN-A03X-01 | Breast | breast invasive carcinoma | Female | >=65 | I/II | Unknown | Unknown | SD | ||
| ZNF224 | SNV | Missense_Mutation | c.1200N>G | p.Phe400Leu | p.F400L | Q9NZL3 | protein_coding | deleterious(0) | probably_damaging(0.997) | TCGA-DS-A1OC-01 | Cervix | cervical & endocervical cancer | Female | <65 | I/II | Chemotherapy | gemcitabine | SD | |
| ZNF224 | SNV | Missense_Mutation | c.399N>C | p.Gln133His | p.Q133H | Q9NZL3 | protein_coding | tolerated(0.24) | benign(0.127) | TCGA-IR-A3LK-01 | Cervix | cervical & endocervical cancer | Female | >=65 | I/II | Chemotherapy | cisplatin | PD | |
| ZNF224 | SNV | Missense_Mutation | novel | c.240N>A | p.Asp80Glu | p.D80E | Q9NZL3 | protein_coding | tolerated(0.83) | benign(0.029) | TCGA-VS-A8EI-01 | Cervix | cervical & endocervical cancer | Female | <65 | I/II | Chemotherapy | cisplatin | CR |
| ZNF224 | SNV | Missense_Mutation | rs763079230 | c.976N>T | p.Arg326Cys | p.R326C | Q9NZL3 | protein_coding | tolerated(0.1) | probably_damaging(0.93) | TCGA-AA-3510-01 | Colorectum | colon adenocarcinoma | Male | >=65 | I/II | Unknown | Unknown | SD |
| ZNF224 | SNV | Missense_Mutation | c.1684N>T | p.His562Tyr | p.H562Y | Q9NZL3 | protein_coding | deleterious(0) | probably_damaging(0.997) | TCGA-AA-3715-01 | Colorectum | colon adenocarcinoma | Male | >=65 | I/II | Unknown | Unknown | PD | |
| ZNF224 | SNV | Missense_Mutation | rs3208192 | c.1613G>A | p.Arg538Lys | p.R538K | Q9NZL3 | protein_coding | tolerated(1) | benign(0.03) | TCGA-AA-A00N-01 | Colorectum | colon adenocarcinoma | Male | >=65 | I/II | Unknown | Unknown | PD |
| Page: 1 2 3 4 5 6 7 8 9 |
Top |
Related drugs of malignant transformation related genes |
| Identification of chemicals and drugs interact with genes involved in malignant transfromation |
| (DGIdb 4.0) |
| Entrez ID | Symbol | Category | Interaction Types | Drug Claim Name | Drug Name | PMIDs |
| Page: 1 |

Copyright 2023-Present -The University of Texas Health Science Center at Houston |