
|
|||||
|
 | |
| |
| |
| |
| |
| |
|
Gene: ZNF219 |
Gene summary for ZNF219 |
| Gene information | Species | Human | Gene symbol | ZNF219 | Gene ID | 51222 |
| Gene name | zinc finger protein 219 | |
| Gene Alias | ZFP219 | |
| Cytomap | 14q11.2 | |
| Gene Type | protein-coding | GO ID | GO:0000122 | UniProtAcc | Q9P2Y4 |
Top |
Malignant transformation analysis |
| Identification of the aberrant gene expression in precancerous and cancerous lesions by comparing the gene expression of stem-like cells in diseased tissues with normal stem cells |
| Entrez ID | Symbol | Replicates | Species | Organ | Tissue | Adj P-value | Log2FC | Malignancy |
| 51222 | ZNF219 | C04 | Human | Oral cavity | OSCC | 2.91e-23 | 8.53e-01 | 0.2633 |
| 51222 | ZNF219 | C21 | Human | Oral cavity | OSCC | 1.05e-08 | 3.34e-01 | 0.2678 |
| 51222 | ZNF219 | C30 | Human | Oral cavity | OSCC | 1.81e-23 | 9.27e-01 | 0.3055 |
| 51222 | ZNF219 | C43 | Human | Oral cavity | OSCC | 4.54e-12 | 2.54e-01 | 0.1704 |
| 51222 | ZNF219 | C46 | Human | Oral cavity | OSCC | 1.11e-06 | 1.53e-01 | 0.1673 |
| 51222 | ZNF219 | C51 | Human | Oral cavity | OSCC | 9.09e-09 | 4.95e-01 | 0.2674 |
| 51222 | ZNF219 | C06 | Human | Oral cavity | OSCC | 4.91e-03 | 6.48e-01 | 0.2699 |
| 51222 | ZNF219 | C08 | Human | Oral cavity | OSCC | 7.58e-05 | 1.21e-01 | 0.1919 |
| 51222 | ZNF219 | LP17 | Human | Oral cavity | LP | 1.01e-03 | 4.23e-01 | 0.2349 |
| 51222 | ZNF219 | SYSMH2 | Human | Oral cavity | OSCC | 6.71e-06 | 1.81e-01 | 0.2326 |
| 51222 | ZNF219 | SYSMH3 | Human | Oral cavity | OSCC | 4.31e-14 | 2.89e-01 | 0.2442 |
| 51222 | ZNF219 | SYSMH5 | Human | Oral cavity | OSCC | 2.13e-02 | 1.17e-01 | 0.0647 |
| 51222 | ZNF219 | male-WTA | Human | Thyroid | PTC | 2.52e-26 | 3.17e-01 | 0.1037 |
| 51222 | ZNF219 | PTC01 | Human | Thyroid | PTC | 8.26e-13 | 1.34e-01 | 0.1899 |
| 51222 | ZNF219 | PTC04 | Human | Thyroid | PTC | 7.30e-06 | 1.49e-01 | 0.1927 |
| 51222 | ZNF219 | PTC05 | Human | Thyroid | PTC | 1.02e-11 | 2.10e-01 | 0.2065 |
| 51222 | ZNF219 | PTC06 | Human | Thyroid | PTC | 9.64e-17 | 3.65e-01 | 0.2057 |
| 51222 | ZNF219 | PTC07 | Human | Thyroid | PTC | 1.02e-23 | 3.51e-01 | 0.2044 |
| 51222 | ZNF219 | ATC13 | Human | Thyroid | ATC | 1.65e-08 | 1.22e-01 | 0.34 |
| 51222 | ZNF219 | ATC4 | Human | Thyroid | ATC | 2.36e-06 | 7.55e-02 | 0.34 |
| Page: 1 2 |
| Tissue | Expression Dynamics | Abbreviation |
| Oral Cavity | 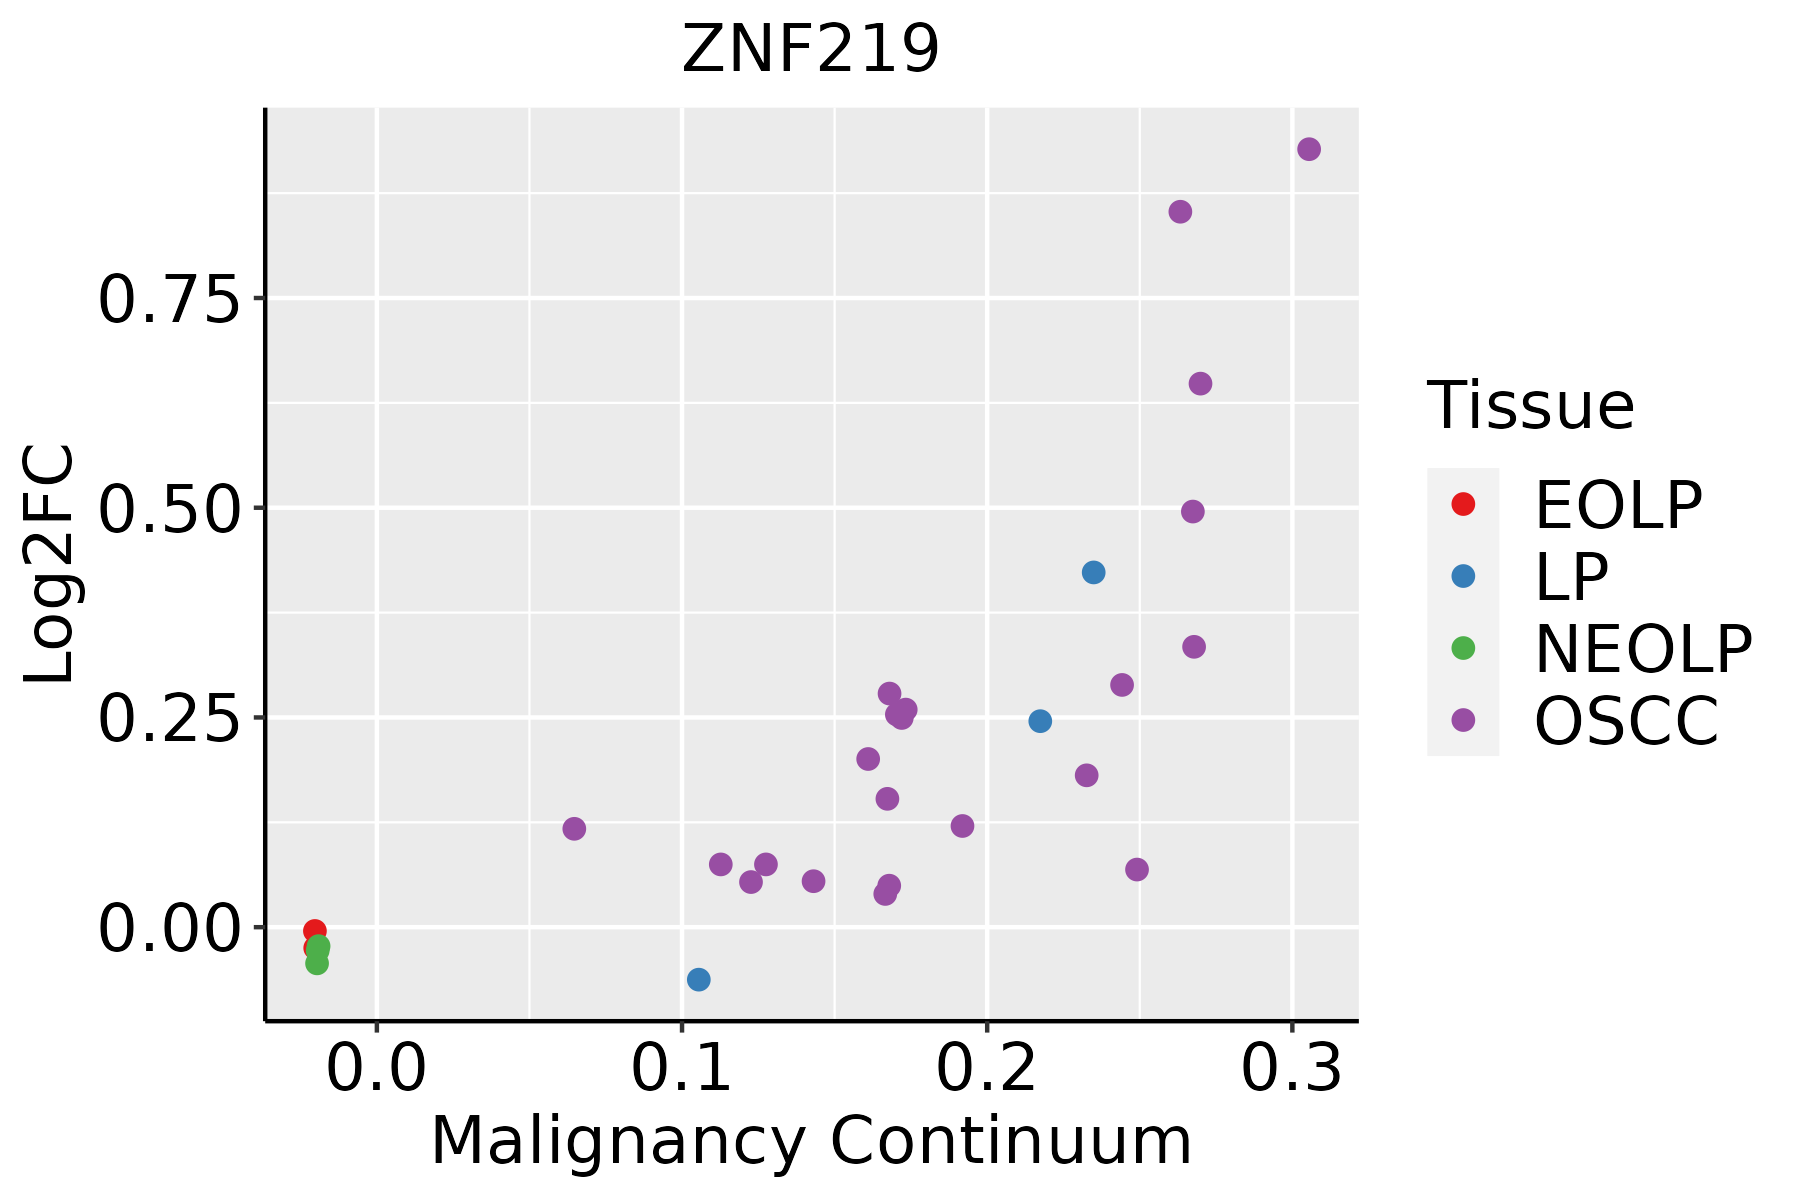 | EOLP: Erosive Oral lichen planus |
| LP: leukoplakia | ||
| NEOLP: Non-erosive oral lichen planus | ||
| OSCC: Oral squamous cell carcinoma | ||
| Thyroid | 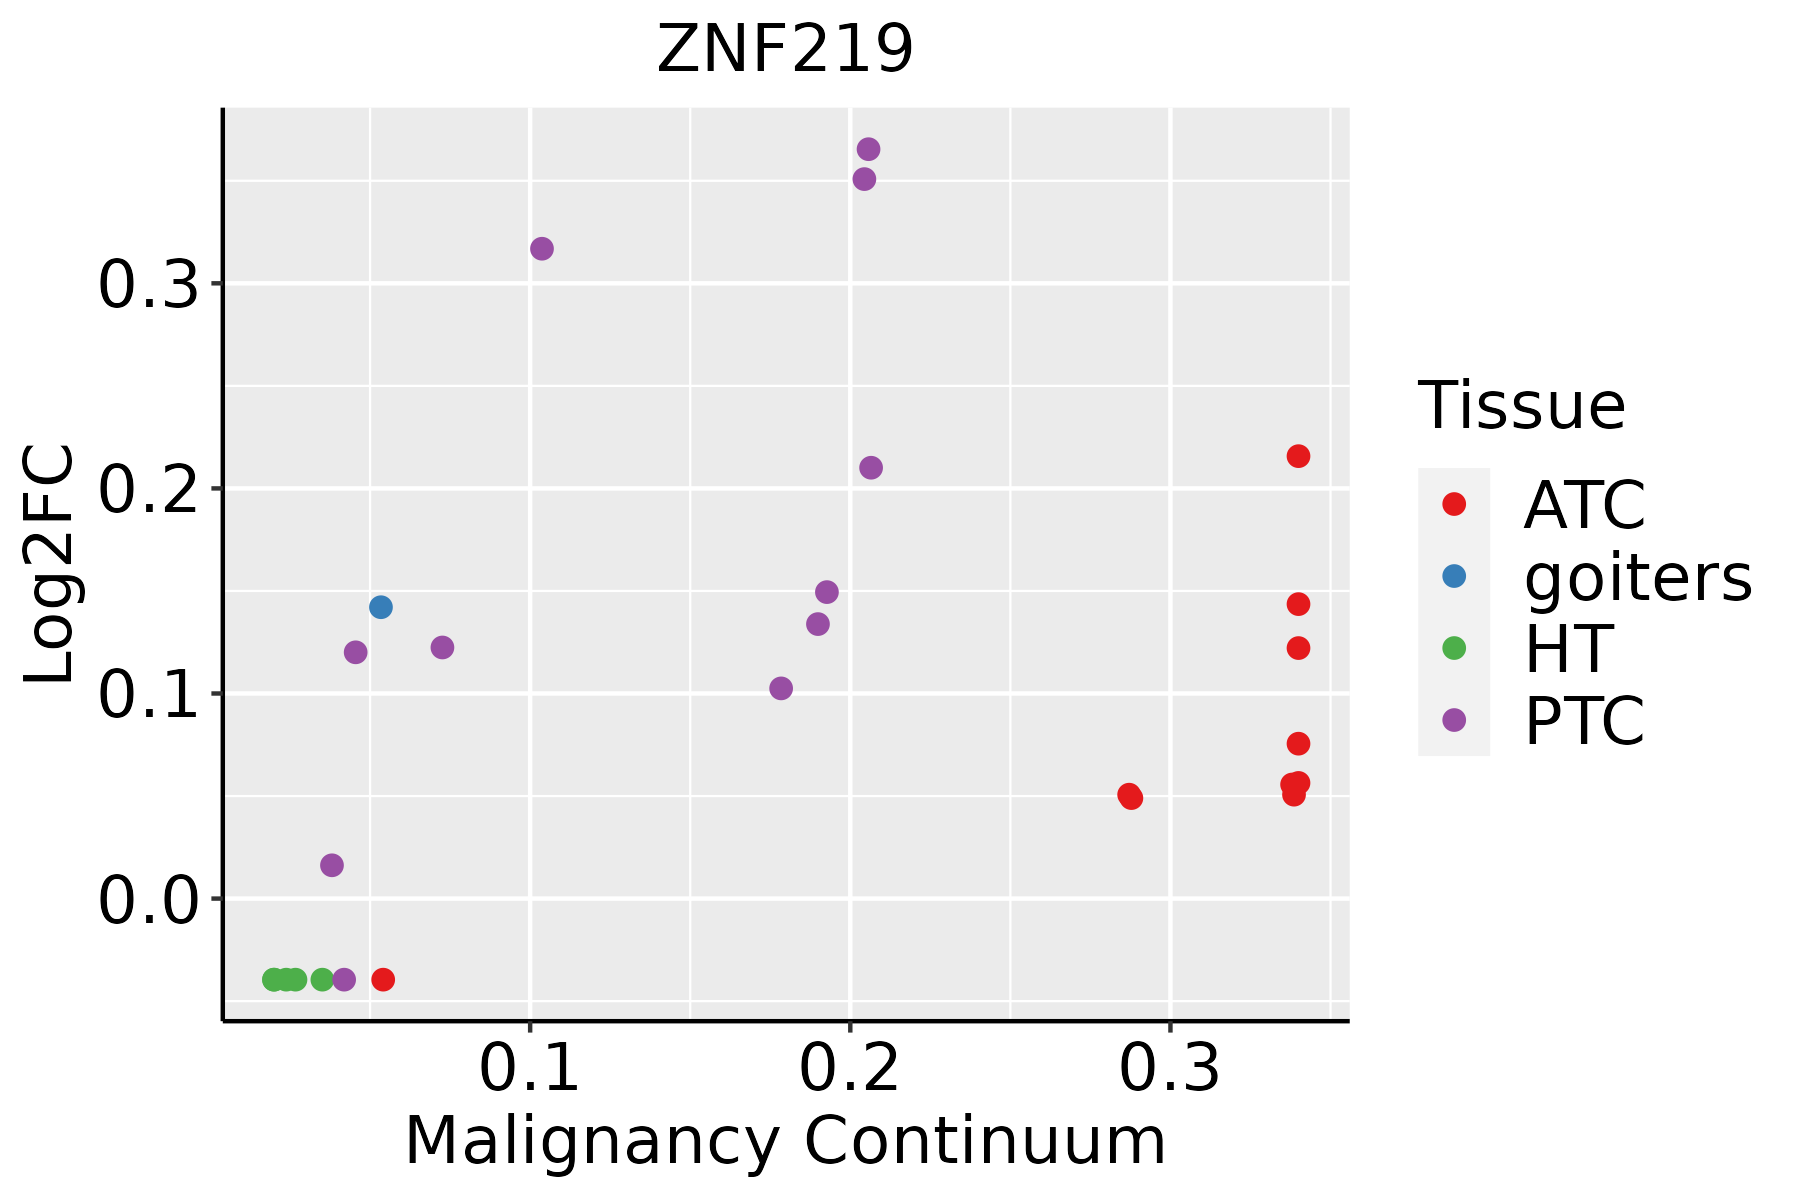 | ATC: Anaplastic thyroid cancer |
| HT: Hashimoto's thyroiditis | ||
| PTC: Papillary thyroid cancer |
| ∗log2FC in expression of this searched gene in stem-like cells from each diseased tissue sample relative to stem-like cells in normal samples in each tissue plotted against the malignancy continuum. Samples are colored based on if they are from different disease stage. |
Top |
Malignant transformation related pathway analysis |
| Find out the enriched GO biological processes and KEGG pathways involved in transition from healthy to precancer to cancer |
| Tissue | Disease Stage | Enriched GO biological Processes |
| Colorectum | AD |  |
| Colorectum | SER |  |
| Colorectum | MSS |  |
| Colorectum | MSI-H |  |
| Colorectum | FAP |  |
| ∗Top 15 enriched GO BP terms are showed in the bar plot of each disease state in each tissue. Each row represents a significant GO biological process which is colored according to the -log10(p.adjust). |
| Page: 1 2 3 4 5 6 7 8 9 |
| GO ID | Tissue | Disease Stage | Description | Gene Ratio | Bg Ratio | pvalue | p.adjust | Count |
| GO:00020624 | Thyroid | ATC | chondrocyte differentiation | 54/6293 | 106/18723 | 1.67e-04 | 1.14e-03 | 54 |
| GO:00614484 | Thyroid | ATC | connective tissue development | 112/6293 | 252/18723 | 2.08e-04 | 1.38e-03 | 112 |
| GO:00351074 | Thyroid | ATC | appendage morphogenesis | 63/6293 | 138/18723 | 2.13e-03 | 1.00e-02 | 63 |
| GO:00351084 | Thyroid | ATC | limb morphogenesis | 63/6293 | 138/18723 | 2.13e-03 | 1.00e-02 | 63 |
| GO:00487368 | Thyroid | ATC | appendage development | 76/6293 | 172/18723 | 2.41e-03 | 1.12e-02 | 76 |
| GO:00601738 | Thyroid | ATC | limb development | 76/6293 | 172/18723 | 2.41e-03 | 1.12e-02 | 76 |
| GO:00512163 | Thyroid | ATC | cartilage development | 81/6293 | 190/18723 | 5.70e-03 | 2.30e-02 | 81 |
| Page: 1 |
| Pathway ID | Tissue | Disease Stage | Description | Gene Ratio | Bg Ratio | pvalue | p.adjust | qvalue | Count |
| Page: 1 |
Top |
Cell-cell communication analysis |
| Identification of potential cell-cell interactions between two cell types and their ligand-receptor pairs for different disease states |
| Ligand | Receptor | LRpair | Pathway | Tissue | Disease Stage |
| Page: 1 |
Top |
Single-cell gene regulatory network inference analysis |
| Find out the significant the regulons (TFs) and the target genes of each regulon across cell types for different disease states |
| TF | Cell Type | Tissue | Disease Stage | Target Gene | RSS | Regulon Activity |
| ZNF219 | LYMEND | Pancreas | ADJ | ABRAXAS1,SLC51A,TMEM116, etc. | 1.97e-01 |  |
| ZNF219 | MYOFIB | Pancreas | PanIN | ABRAXAS1,SLC51A,TMEM116, etc. | 3.31e-01 |  |
| ZNF219 | PARI | Stomach | CAG with IM | PEX5,SERPINA1,THBS1, etc. | 7.80e-02 |  |
| ZNF219 | PARI | Stomach | GC | PEX5,SERPINA1,THBS1, etc. | 3.26e-02 |  |
| ZNF219 | D | Stomach | SIM | PEX5,SERPINA1,THBS1, etc. | 2.64e-02 |  |
| ∗The dot plots of a searched regulon are shown for all cell subpopulations in each disease state of each tissue based on the regulon specific score inferred using pySCENIC and by calculating the average expression. |
| Page: 1 |
Top |
Somatic mutation of malignant transformation related genes |
| Annotation of somatic variants for genes involved in malignant transformation |
| Hugo Symbol | Variant Class | Variant Classification | dbSNP RS | HGVSc | HGVSp | HGVSp Short | SWISSPROT | BIOTYPE | SIFT | PolyPhen | Tumor Sample Barcode | Tissue | Histology | Sex | Age | Stage | Therapy Types | Drugs | Outcome |
| ZNF219 | SNV | Missense_Mutation | novel | c.1526N>T | p.Ser509Leu | p.S509L | Q9P2Y4 | protein_coding | deleterious(0.01) | possibly_damaging(0.727) | TCGA-3C-AALI-01 | Breast | breast invasive carcinoma | Female | <65 | I/II | Unspecific | Poly E | Complete Response |
| ZNF219 | SNV | Missense_Mutation | c.1517N>G | p.Ser506Cys | p.S506C | Q9P2Y4 | protein_coding | deleterious(0.01) | benign(0.181) | TCGA-A8-A07U-01 | Breast | breast invasive carcinoma | Female | >=65 | III/IV | Chemotherapy | 5-fluorouracil | SD | |
| ZNF219 | SNV | Missense_Mutation | c.908C>T | p.Ala303Val | p.A303V | Q9P2Y4 | protein_coding | tolerated(0.11) | possibly_damaging(0.514) | TCGA-AC-A4ZE-01 | Breast | breast invasive carcinoma | Female | <65 | I/II | Unknown | Unknown | SD | |
| ZNF219 | SNV | Missense_Mutation | c.1517N>G | p.Ser506Cys | p.S506C | Q9P2Y4 | protein_coding | deleterious(0.01) | benign(0.181) | TCGA-AN-A0XW-01 | Breast | breast invasive carcinoma | Female | <65 | III/IV | Unknown | Unknown | SD | |
| ZNF219 | SNV | Missense_Mutation | novel | c.926N>A | p.Arg309His | p.R309H | Q9P2Y4 | protein_coding | deleterious(0.01) | probably_damaging(0.989) | TCGA-2W-A8YY-01 | Cervix | cervical & endocervical cancer | Female | <65 | I/II | Chemotherapy | cisplatin | CR |
| ZNF219 | SNV | Missense_Mutation | novel | c.823N>T | p.Arg275Cys | p.R275C | Q9P2Y4 | protein_coding | deleterious(0) | probably_damaging(0.995) | TCGA-2W-A8YY-01 | Cervix | cervical & endocervical cancer | Female | <65 | I/II | Chemotherapy | cisplatin | CR |
| ZNF219 | SNV | Missense_Mutation | novel | c.490N>T | p.Arg164Cys | p.R164C | Q9P2Y4 | protein_coding | deleterious(0) | probably_damaging(0.98) | TCGA-C5-A1MN-01 | Cervix | cervical & endocervical cancer | Female | <65 | III/IV | Chemotherapy | cisplatin | SD |
| ZNF219 | SNV | Missense_Mutation | novel | c.715N>A | p.Glu239Lys | p.E239K | Q9P2Y4 | protein_coding | tolerated_low_confidence(0.94) | benign(0.074) | TCGA-EA-A3HS-01 | Cervix | cervical & endocervical cancer | Female | <65 | I/II | Unknown | Unknown | SD |
| ZNF219 | SNV | Missense_Mutation | c.1517C>G | p.Ser506Cys | p.S506C | Q9P2Y4 | protein_coding | deleterious(0.01) | benign(0.181) | TCGA-EA-A3HU-01 | Cervix | cervical & endocervical cancer | Female | <65 | I/II | Unknown | Unknown | SD | |
| ZNF219 | SNV | Missense_Mutation | novel | c.448N>C | p.Glu150Gln | p.E150Q | Q9P2Y4 | protein_coding | tolerated(0.17) | possibly_damaging(0.541) | TCGA-JW-A5VL-01 | Cervix | cervical & endocervical cancer | Female | <65 | I/II | Unknown | Unknown | SD |
| Page: 1 2 3 4 5 |
Top |
Related drugs of malignant transformation related genes |
| Identification of chemicals and drugs interact with genes involved in malignant transfromation |
| (DGIdb 4.0) |
| Entrez ID | Symbol | Category | Interaction Types | Drug Claim Name | Drug Name | PMIDs |
| Page: 1 |

Copyright 2023-Present -The University of Texas Health Science Center at Houston |