
|
|||||
|
 | |
| |
| |
| |
| |
| |
|
Gene: ZNF217 |
Gene summary for ZNF217 |
| Gene information | Species | Human | Gene symbol | ZNF217 | Gene ID | 7764 |
| Gene name | zinc finger protein 217 | |
| Gene Alias | ZABC1 | |
| Cytomap | 20q13.2 | |
| Gene Type | protein-coding | GO ID | GO:0000122 | UniProtAcc | O75362 |
Top |
Malignant transformation analysis |
| Identification of the aberrant gene expression in precancerous and cancerous lesions by comparing the gene expression of stem-like cells in diseased tissues with normal stem cells |
| Entrez ID | Symbol | Replicates | Species | Organ | Tissue | Adj P-value | Log2FC | Malignancy |
| 7764 | ZNF217 | GSM4909293 | Human | Breast | IDC | 3.14e-02 | 1.67e-01 | 0.1581 |
| 7764 | ZNF217 | GSM4909301 | Human | Breast | IDC | 7.26e-04 | 3.41e-01 | 0.1577 |
| 7764 | ZNF217 | GSM4909311 | Human | Breast | IDC | 3.80e-05 | -1.66e-01 | 0.1534 |
| 7764 | ZNF217 | GSM4909317 | Human | Breast | IDC | 1.22e-15 | 5.34e-01 | 0.1355 |
| 7764 | ZNF217 | GSM4909318 | Human | Breast | IDC | 4.88e-09 | 8.51e-01 | 0.2031 |
| 7764 | ZNF217 | GSM4909319 | Human | Breast | IDC | 3.18e-07 | -1.53e-01 | 0.1563 |
| 7764 | ZNF217 | M1 | Human | Breast | IDC | 2.16e-07 | 4.09e-01 | 0.1577 |
| 7764 | ZNF217 | NCCBC2 | Human | Breast | DCIS | 5.09e-06 | 6.85e-01 | 0.1554 |
| 7764 | ZNF217 | DCIS2 | Human | Breast | DCIS | 6.43e-42 | 2.01e-01 | 0.0085 |
| 7764 | ZNF217 | LZE4T | Human | Esophagus | ESCC | 1.04e-20 | 9.66e-01 | 0.0811 |
| 7764 | ZNF217 | LZE5T | Human | Esophagus | ESCC | 4.77e-06 | 5.35e-01 | 0.0514 |
| 7764 | ZNF217 | LZE7T | Human | Esophagus | ESCC | 6.64e-12 | 8.71e-01 | 0.0667 |
| 7764 | ZNF217 | LZE20T | Human | Esophagus | ESCC | 7.15e-10 | 3.43e-01 | 0.0662 |
| 7764 | ZNF217 | LZE22T | Human | Esophagus | ESCC | 1.27e-02 | 3.51e-01 | 0.068 |
| 7764 | ZNF217 | LZE24T | Human | Esophagus | ESCC | 2.81e-14 | 5.20e-01 | 0.0596 |
| 7764 | ZNF217 | LZE21T | Human | Esophagus | ESCC | 1.64e-08 | 5.00e-01 | 0.0655 |
| 7764 | ZNF217 | LZE6T | Human | Esophagus | ESCC | 7.34e-03 | 1.12e-01 | 0.0845 |
| 7764 | ZNF217 | P1T-E | Human | Esophagus | ESCC | 9.10e-09 | 4.60e-01 | 0.0875 |
| 7764 | ZNF217 | P2T-E | Human | Esophagus | ESCC | 2.14e-22 | 4.17e-01 | 0.1177 |
| 7764 | ZNF217 | P4T-E | Human | Esophagus | ESCC | 7.46e-28 | 9.48e-01 | 0.1323 |
| Page: 1 2 3 4 5 6 |
| Tissue | Expression Dynamics | Abbreviation |
| Breast | 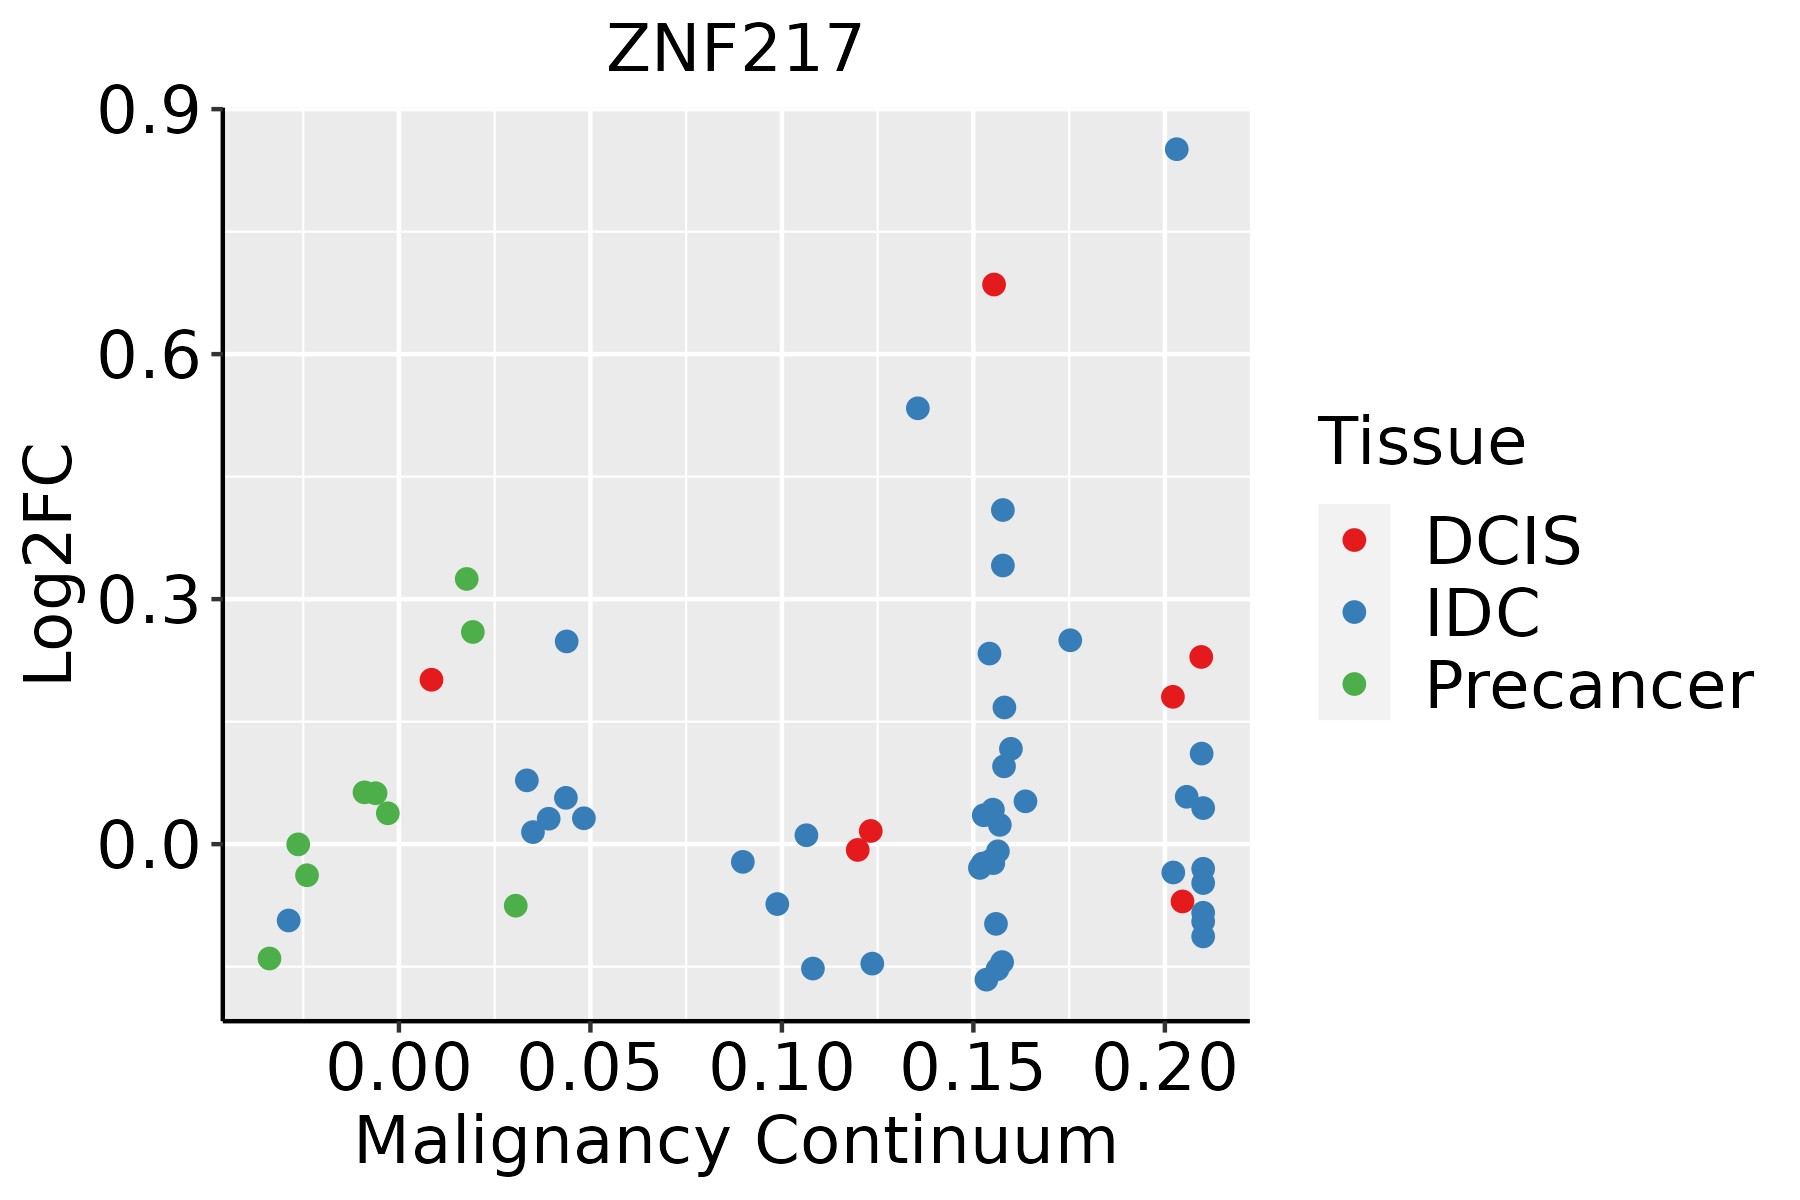 | IDC: Invasive ductal carcinoma |
| DCIS: Ductal carcinoma in situ | ||
| Precancer(BRCA1-mut): Precancerous lesion from BRCA1 mutation carriers | ||
| Esophagus | 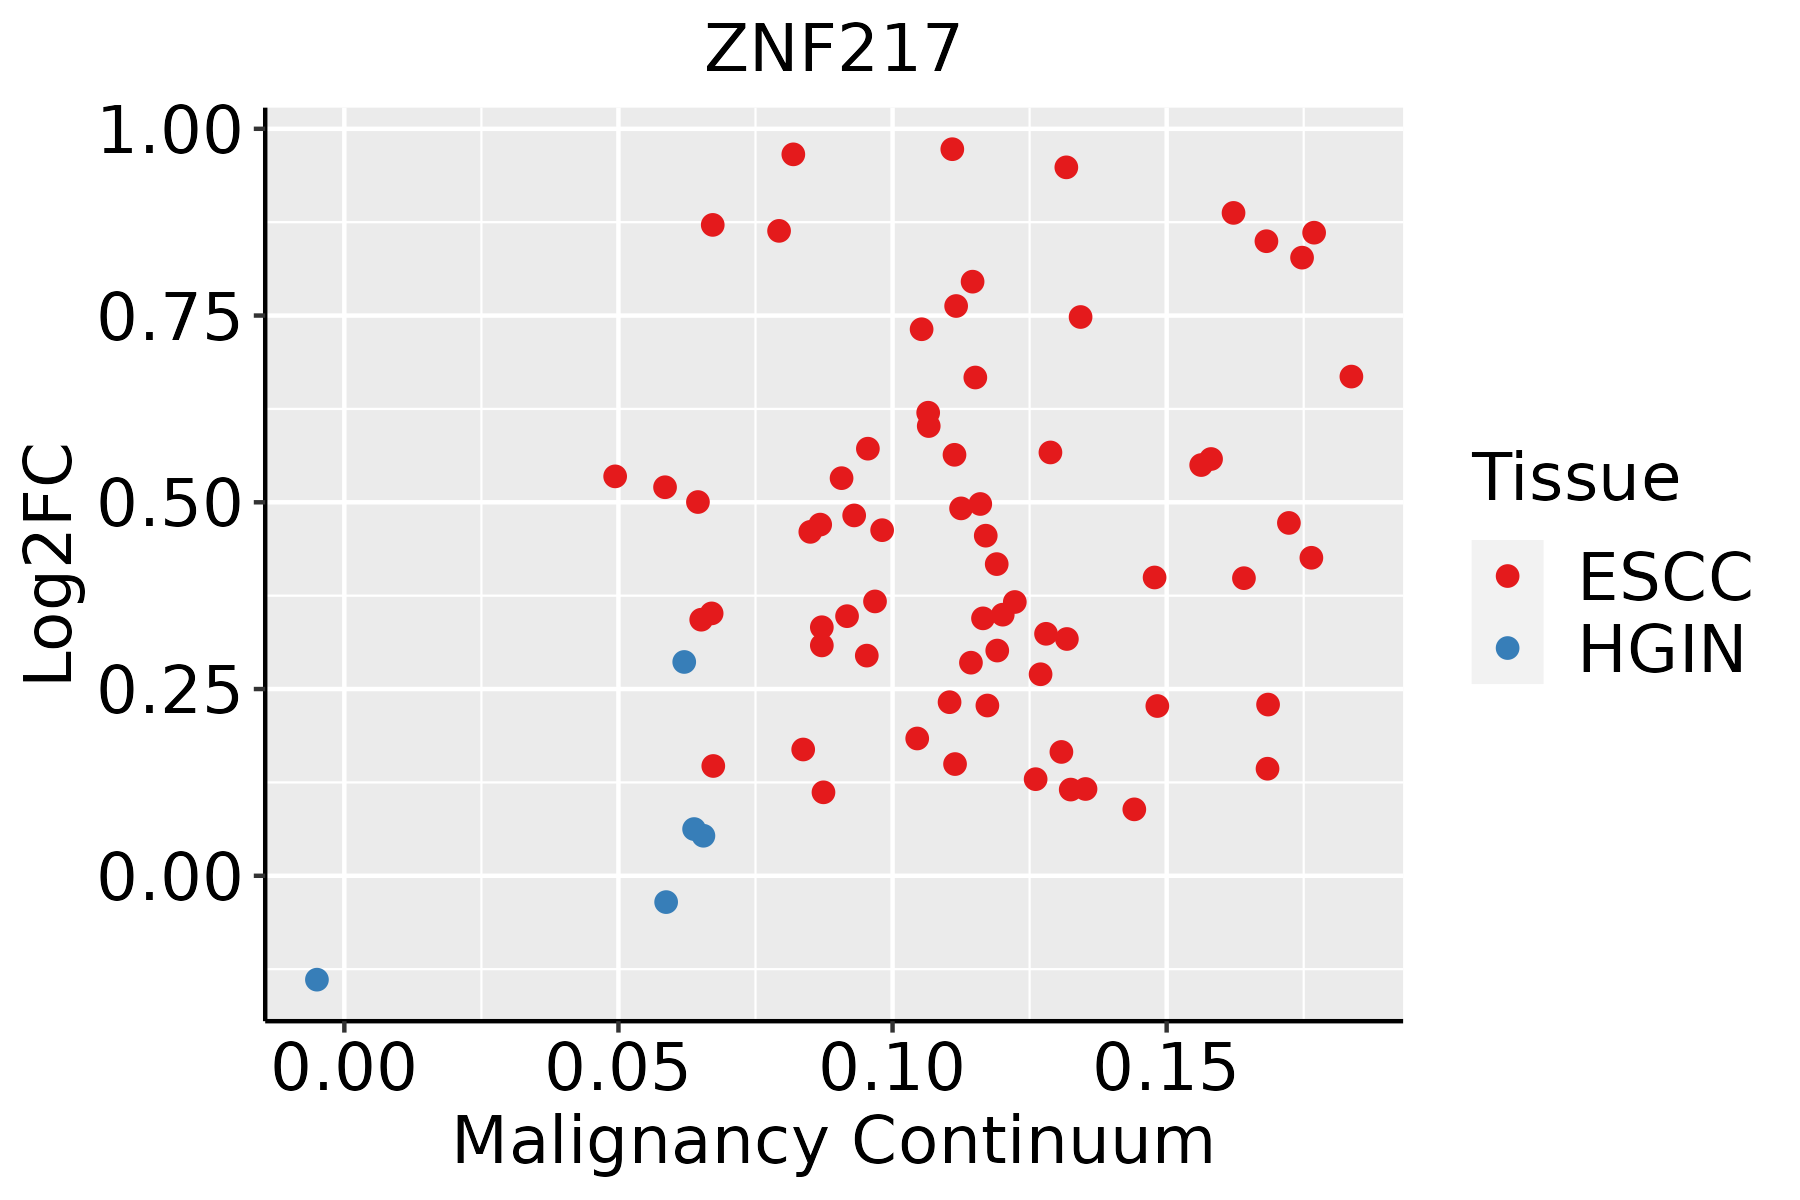 | ESCC: Esophageal squamous cell carcinoma |
| HGIN: High-grade intraepithelial neoplasias | ||
| LGIN: Low-grade intraepithelial neoplasias | ||
| Liver | 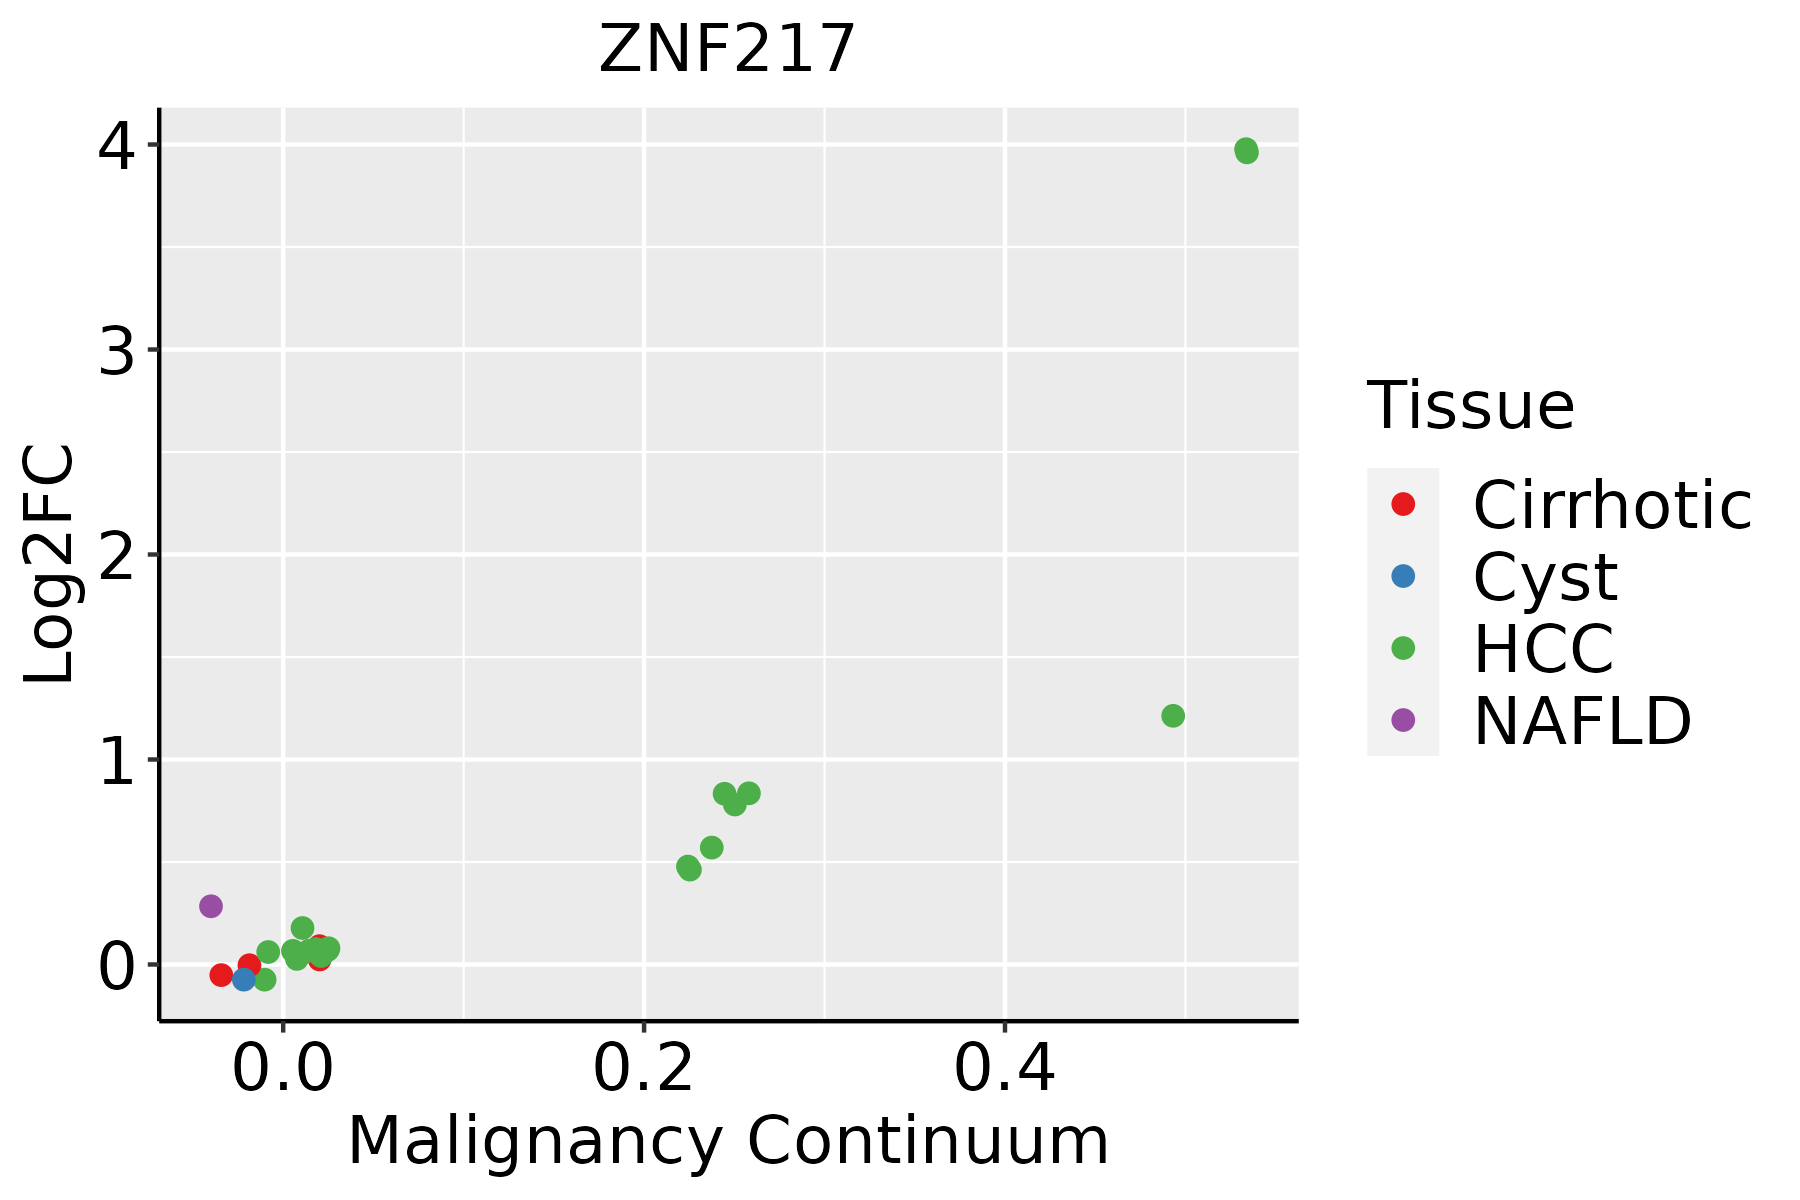 | HCC: Hepatocellular carcinoma |
| NAFLD: Non-alcoholic fatty liver disease | ||
| Lung | 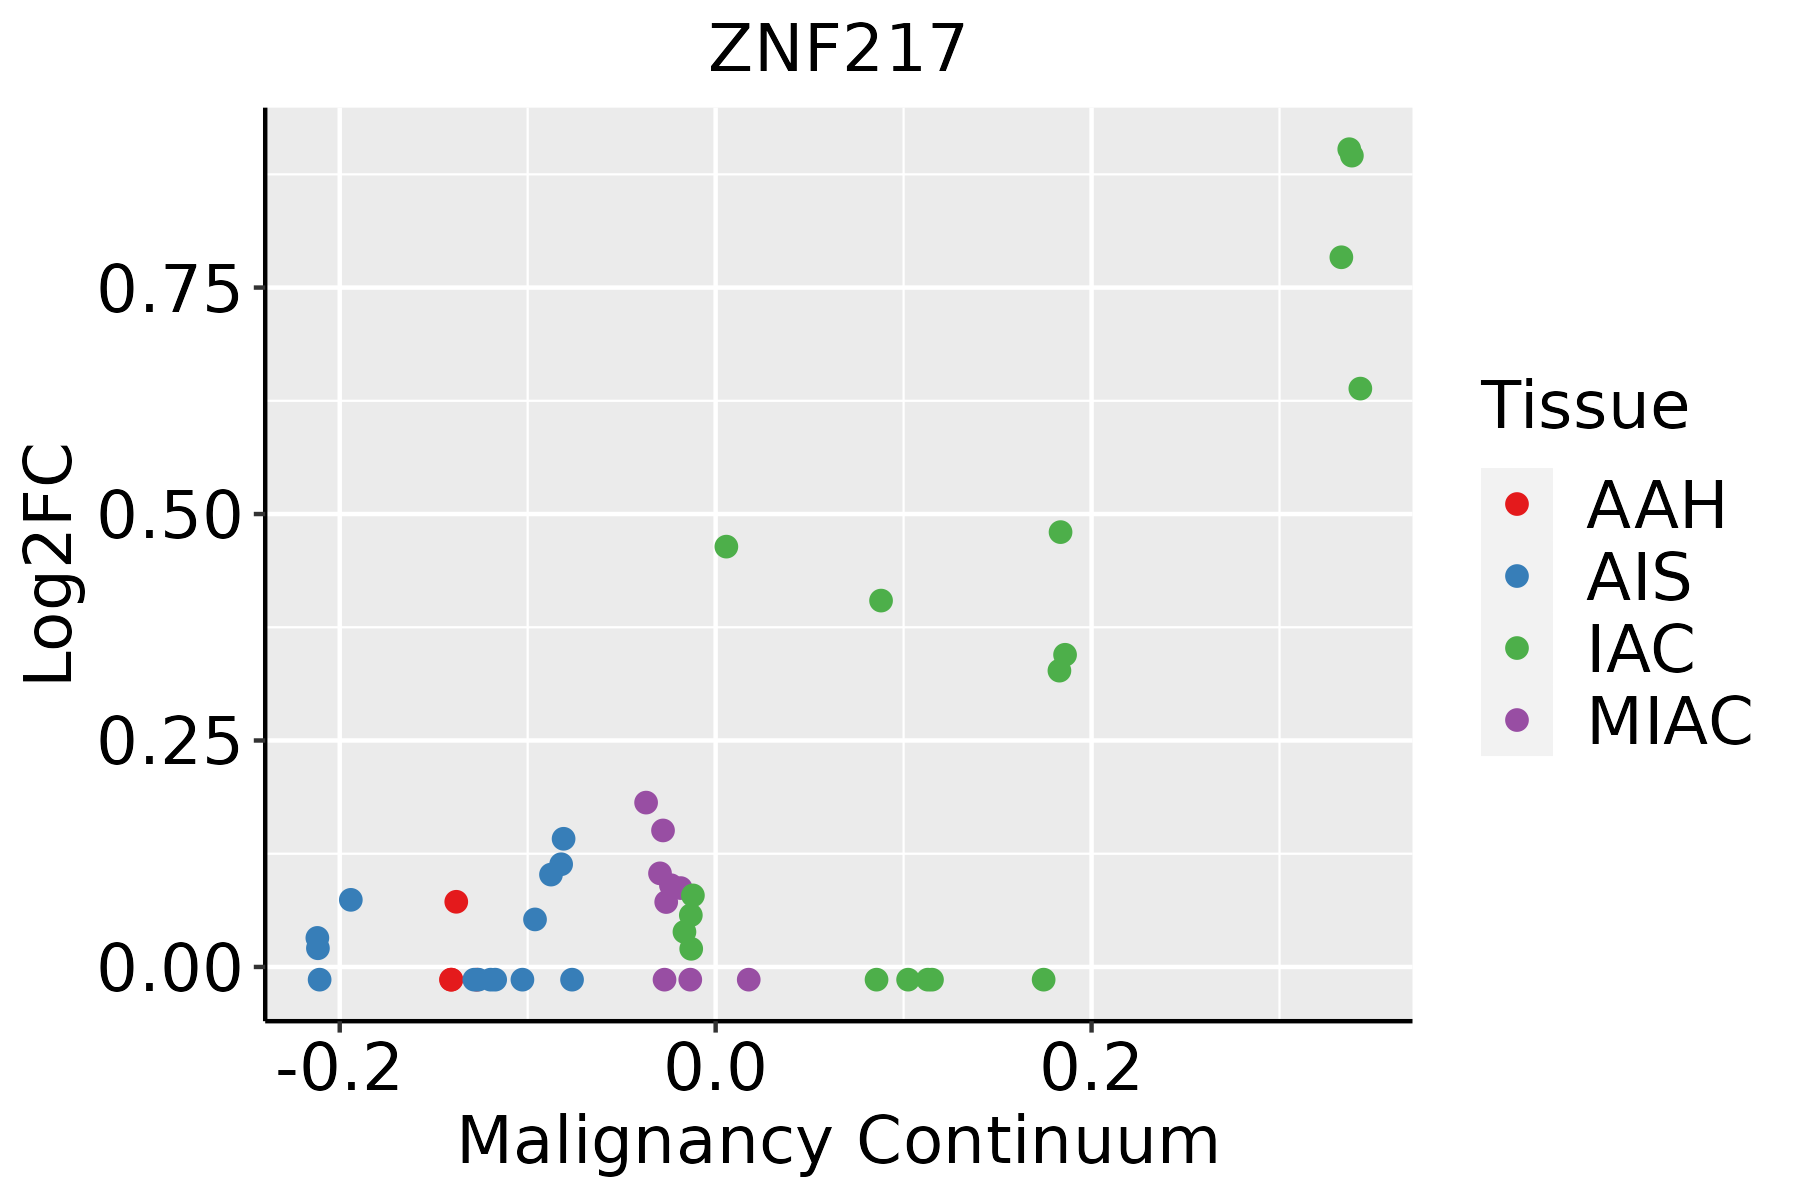 | AAH: Atypical adenomatous hyperplasia |
| AIS: Adenocarcinoma in situ | ||
| IAC: Invasive lung adenocarcinoma | ||
| MIA: Minimally invasive adenocarcinoma | ||
| Prostate | 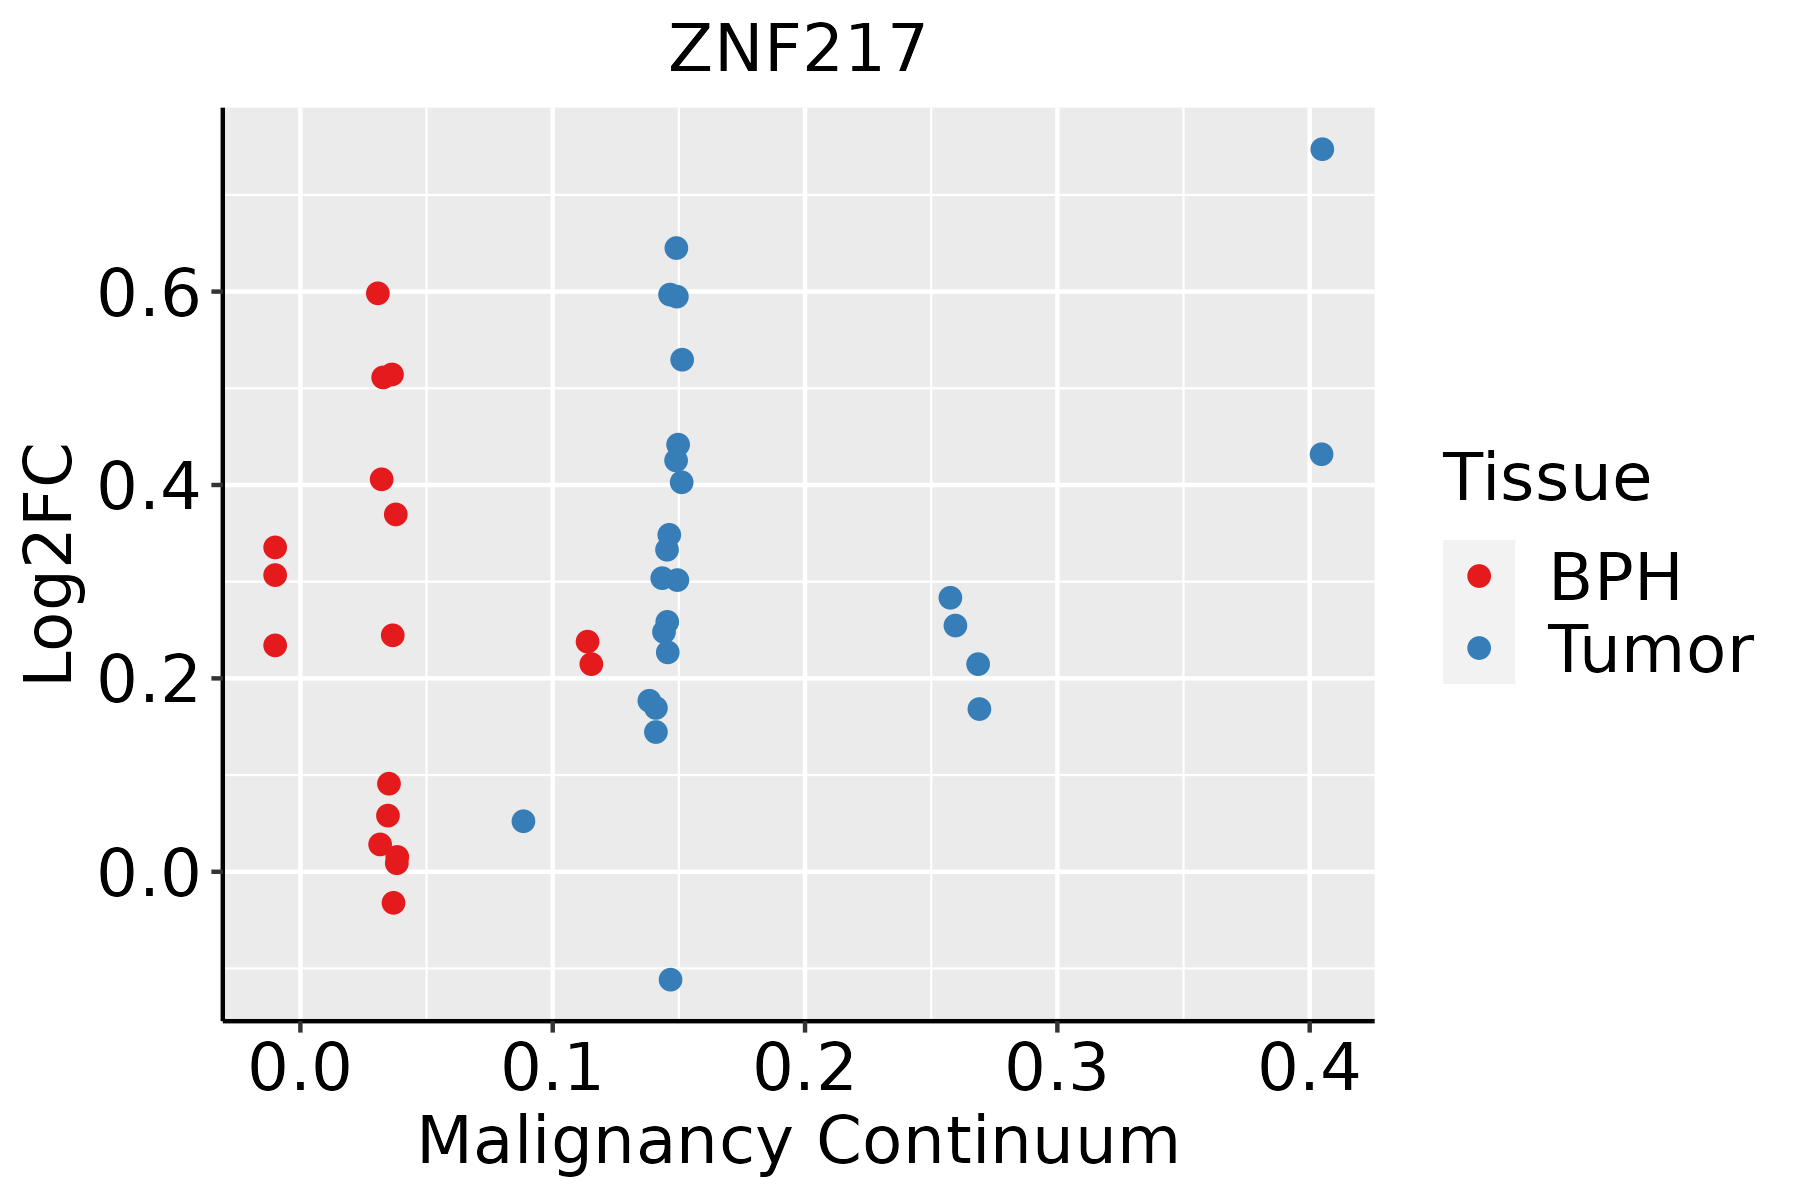 | BPH: Benign Prostatic Hyperplasia |
| Thyroid |  | ATC: Anaplastic thyroid cancer |
| HT: Hashimoto's thyroiditis | ||
| PTC: Papillary thyroid cancer |
| ∗log2FC in expression of this searched gene in stem-like cells from each diseased tissue sample relative to stem-like cells in normal samples in each tissue plotted against the malignancy continuum. Samples are colored based on if they are from different disease stage. |
Top |
Malignant transformation related pathway analysis |
| Find out the enriched GO biological processes and KEGG pathways involved in transition from healthy to precancer to cancer |
| Tissue | Disease Stage | Enriched GO biological Processes |
| Colorectum | AD |  |
| Colorectum | SER |  |
| Colorectum | MSS |  |
| Colorectum | MSI-H |  |
| Colorectum | FAP |  |
| ∗Top 15 enriched GO BP terms are showed in the bar plot of each disease state in each tissue. Each row represents a significant GO biological process which is colored according to the -log10(p.adjust). |
| Page: 1 2 3 4 5 6 7 8 9 |
| GO ID | Tissue | Disease Stage | Description | Gene Ratio | Bg Ratio | pvalue | p.adjust | Count |
| Page: 1 |
| Pathway ID | Tissue | Disease Stage | Description | Gene Ratio | Bg Ratio | pvalue | p.adjust | qvalue | Count |
| Page: 1 |
Top |
Cell-cell communication analysis |
| Identification of potential cell-cell interactions between two cell types and their ligand-receptor pairs for different disease states |
| Ligand | Receptor | LRpair | Pathway | Tissue | Disease Stage |
| Page: 1 |
Top |
Single-cell gene regulatory network inference analysis |
| Find out the significant the regulons (TFs) and the target genes of each regulon across cell types for different disease states |
| TF | Cell Type | Tissue | Disease Stage | Target Gene | RSS | Regulon Activity |
| ZNF217 | NK | Breast | ADJ | MMS22L,METAP1,LINC00649, etc. | 4.10e-02 |  |
| ZNF217 | MSC | Breast | DCIS | CAVIN1,RHOU,PRRX1, etc. | 9.99e-03 |  |
| ZNF217 | TRANS | Cervix | CC | CEACAM6,PRSS8,PIK3IP1, etc. | 8.85e-02 |  |
| ZNF217 | ICAF | Cervix | Healthy | IL6,CNKSR3,CSF2RB, etc. | 4.64e-04 |  |
| ZNF217 | PARI | Stomach | GC | CTR9,SYTL4,WNT2B, etc. | 9.19e-03 |  |
| ZNF217 | GOB | Stomach | GC | CTR9,SYTL4,WNT2B, etc. | 2.53e-03 | |
| ZNF217 | MYOFIB | Stomach | CSG | RAB26,HDX,NFKB1, etc. | 4.70e-02 |  |
| ZNF217 | FIB | Stomach | GC | RAB26,HDX,NFKB1, etc. | 3.74e-02 | |
| ZNF217 | MVA | Stomach | Healthy | RAB26,HDX,NFKB1, etc. | 1.54e-02 |  |
| ZNF217 | MSC | Stomach | WIM | RAB26,HDX,NFKB1, etc. | 7.01e-02 |  |
| ∗The dot plots of a searched regulon are shown for all cell subpopulations in each disease state of each tissue based on the regulon specific score inferred using pySCENIC and by calculating the average expression. |
| Page: 1 |
Top |
Somatic mutation of malignant transformation related genes |
| Annotation of somatic variants for genes involved in malignant transformation |
| Hugo Symbol | Variant Class | Variant Classification | dbSNP RS | HGVSc | HGVSp | HGVSp Short | SWISSPROT | BIOTYPE | SIFT | PolyPhen | Tumor Sample Barcode | Tissue | Histology | Sex | Age | Stage | Therapy Types | Drugs | Outcome |
| ZNF217 | SNV | Missense_Mutation | c.2935N>T | p.Asp979Tyr | p.D979Y | O75362 | protein_coding | deleterious(0) | possibly_damaging(0.731) | TCGA-A1-A0SG-01 | Breast | breast invasive carcinoma | Female | <65 | I/II | Chemotherapy | SD | ||
| ZNF217 | SNV | Missense_Mutation | c.2369N>T | p.Ala790Val | p.A790V | O75362 | protein_coding | tolerated(0.13) | benign(0.003) | TCGA-A2-A0EQ-01 | Breast | breast invasive carcinoma | Female | <65 | I/II | Chemotherapy | adriamycin | SD | |
| ZNF217 | SNV | Missense_Mutation | c.2927G>C | p.Ser976Thr | p.S976T | O75362 | protein_coding | tolerated(0.28) | benign(0.024) | TCGA-A8-A081-01 | Breast | breast invasive carcinoma | Female | >=65 | I/II | Unknown | Unknown | SD | |
| ZNF217 | SNV | Missense_Mutation | c.1232N>T | p.Ser411Phe | p.S411F | O75362 | protein_coding | deleterious(0) | possibly_damaging(0.751) | TCGA-BH-A18U-01 | Breast | breast invasive carcinoma | Female | >=65 | III/IV | Unknown | Unknown | SD | |
| ZNF217 | SNV | Missense_Mutation | c.1318N>T | p.Gly440Cys | p.G440C | O75362 | protein_coding | deleterious(0.05) | probably_damaging(0.972) | TCGA-D8-A1XK-01 | Breast | breast invasive carcinoma | Female | <65 | I/II | Chemotherapy | doxorubicine+cyclophosphamide | SD | |
| ZNF217 | SNV | Missense_Mutation | c.2020N>C | p.Cys674Arg | p.C674R | O75362 | protein_coding | tolerated(0.35) | benign(0) | TCGA-E2-A155-01 | Breast | breast invasive carcinoma | Female | <65 | I/II | Chemotherapy | cytoxan | SD | |
| ZNF217 | SNV | Missense_Mutation | rs755258720 | c.1256N>T | p.Thr419Met | p.T419M | O75362 | protein_coding | tolerated(0.05) | probably_damaging(0.959) | TCGA-LL-A6FR-01 | Breast | breast invasive carcinoma | Female | <65 | I/II | Chemotherapy | adriamycin | SD |
| ZNF217 | insertion | In_Frame_Ins | novel | c.190_191insTCACCCTGAAACGGGGAAGAAGCCTGTCAGATGCAT | p.Pro64delinsLeuThrLeuLysArgGlyArgSerLeuSerAspAlaSer | p.P64delinsLTLKRGRSLSDAS | O75362 | protein_coding | TCGA-A2-A0CT-01 | Breast | breast invasive carcinoma | Female | >=65 | I/II | Chemotherapy | cytoxan | SD | ||
| ZNF217 | insertion | Nonsense_Mutation | novel | c.1381_1382insTGTGATCTCAGCTCACTGCAATCTCTGCCTCCCAGGTCCAAGCA | p.Gly461ValfsTer2 | p.G461Vfs*2 | O75362 | protein_coding | TCGA-A8-A0A1-01 | Breast | breast invasive carcinoma | Female | >=65 | I/II | Hormone Therapy | tamoxiphen | SD | ||
| ZNF217 | insertion | Frame_Shift_Ins | novel | c.1039_1040insTGGCATTTAT | p.Glu347ValfsTer27 | p.E347Vfs*27 | O75362 | protein_coding | TCGA-AN-A0FX-01 | Breast | breast invasive carcinoma | Female | <65 | I/II | Unknown | Unknown | SD |
| Page: 1 2 3 4 5 6 7 8 9 10 11 12 13 |
Top |
Related drugs of malignant transformation related genes |
| Identification of chemicals and drugs interact with genes involved in malignant transfromation |
| (DGIdb 4.0) |
| Entrez ID | Symbol | Category | Interaction Types | Drug Claim Name | Drug Name | PMIDs |
| Page: 1 |

Copyright 2023-Present -The University of Texas Health Science Center at Houston |