Schematic overview of the cellular and molecular mechanisms involved in the cancer progression, including the proposed cellular and molecular mechanisms in cancer cells trajectory. AT1: alveolar type 1 cells; AT2: alveolar type 2 cells; AAH: atypical adenomatous hyperplasia; AIS: adenocarcinoma in situ; MIA: minimally invasive adenocarcinoma; IA: invasive adenocarcinoma; EMT: epithelial-mesenchymal transition

Home

Download

Statistics

Help

Contact

Center for Computational Systems Medicine
leaf

Gene summary

leaf

Malignant transformation analysis

leaf

Malignant transformation related pathway analysis

leaf

Cell-cell communication analysis

leaf

Single-cell gene regulatory network inference analysis

leaf

Somatic mutation of malignant transformation related genes

leaf

Related drugs of malignant transformation related genes

Gene: ZNF207

Gene summary for ZNF207

check button Gene summary.

Gene informationSpeciesHuman
Gene symbol

ZNF207

Gene ID

7756

Gene namezinc finger protein 207
Gene AliasBuGZ
Cytomap17q11.2
Gene Typeprotein-coding
GO ID

GO:0000070

UniProtAcc

O43670


Top

Malignant transformation analysis

check button Identification of the aberrant gene expression in precancerous and cancerous lesions by comparing the gene expression of stem-like cells in diseased tissues with normal stem cells
check button Malignant transformation involving gene list.
Entrez IDSymbolReplicatesSpeciesOrganTissueAdj P-valueLog2FCMalignancy
7756ZNF207GSM4909293HumanBreastIDC2.64e-971.07e+000.1581
7756ZNF207GSM4909294HumanBreastIDC3.97e-07-2.86e-010.2022
7756ZNF207GSM4909296HumanBreastIDC4.75e-18-3.86e-010.1524
7756ZNF207GSM4909297HumanBreastIDC3.00e-15-2.38e-010.1517
7756ZNF207GSM4909298HumanBreastIDC2.12e-02-1.33e-010.1551
7756ZNF207GSM4909311HumanBreastIDC9.94e-29-4.10e-010.1534
7756ZNF207GSM4909312HumanBreastIDC2.51e-09-1.43e-010.1552
7756ZNF207GSM4909319HumanBreastIDC3.00e-36-4.07e-010.1563
7756ZNF207GSM4909320HumanBreastIDC7.16e-05-4.33e-010.1575
7756ZNF207GSM4909321HumanBreastIDC1.77e-14-2.41e-010.1559
7756ZNF207ctrl6HumanBreastPrecancer2.88e-022.83e-01-0.0061
7756ZNF207brca2HumanBreastPrecancer2.96e-021.37e-02-0.024
7756ZNF207M1HumanBreastIDC1.61e-155.62e-010.1577
7756ZNF207M2HumanBreastIDC6.37e-052.32e-010.21
7756ZNF207NCCBC14HumanBreastDCIS1.46e-04-2.94e-010.2021
7756ZNF207NCCBC3HumanBreastDCIS3.74e-02-3.00e-020.1198
7756ZNF207NCCBC5HumanBreastDCIS7.01e-07-1.85e-010.2046
7756ZNF207P1HumanBreastIDC1.14e-182.55e-010.1527
7756ZNF207P2HumanBreastIDC1.19e-042.91e-010.21
7756ZNF207DCIS2HumanBreastDCIS1.84e-621.66e-010.0085
Page: 1 2 3 4 5 6 7 8 9 10 11 12 

check button Transcriptomic changes along malignancy continuum.
TissueExpression DynamicsAbbreviation
BreastThe image shows the transcriptomic changes along malignancy continuum.log2FC in expression of this searched gene in stem-like cells from each diseased tissue sample relative to stem-like cells in normal samples in each tissue plotted against the malignancy continuum. Samples are colored based on if they are from different disease stage.IDC: Invasive ductal carcinoma
DCIS: Ductal carcinoma in situ
Precancer(BRCA1-mut): Precancerous lesion from BRCA1 mutation carriers
Colorectum (GSE201348)The image shows the transcriptomic changes along malignancy continuum.log2FC in expression of this searched gene in stem-like cells from each diseased tissue sample relative to stem-like cells in normal samples in each tissue plotted against the malignancy continuum. Samples are colored based on if they are from different disease stage.FAP: Familial adenomatous polyposis
CRC: Colorectal cancer
Colorectum (HTA11)The image shows the transcriptomic changes along malignancy continuum.log2FC in expression of this searched gene in stem-like cells from each diseased tissue sample relative to stem-like cells in normal samples in each tissue plotted against the malignancy continuum. Samples are colored based on if they are from different disease stage.AD: Adenomas
SER: Sessile serrated lesions
MSI-H: Microsatellite-high colorectal cancer
MSS: Microsatellite stable colorectal cancer
EndometriumThe image shows the transcriptomic changes along malignancy continuum.log2FC in expression of this searched gene in stem-like cells from each diseased tissue sample relative to stem-like cells in normal samples in each tissue plotted against the malignancy continuum. Samples are colored based on if they are from different disease stage.AEH: Atypical endometrial hyperplasia
EEC: Endometrioid Cancer
EsophagusThe image shows the transcriptomic changes along malignancy continuum.log2FC in expression of this searched gene in stem-like cells from each diseased tissue sample relative to stem-like cells in normal samples in each tissue plotted against the malignancy continuum. Samples are colored based on if they are from different disease stage.ESCC: Esophageal squamous cell carcinoma
HGIN: High-grade intraepithelial neoplasias
LGIN: Low-grade intraepithelial neoplasias
LiverThe image shows the transcriptomic changes along malignancy continuum.log2FC in expression of this searched gene in stem-like cells from each diseased tissue sample relative to stem-like cells in normal samples in each tissue plotted against the malignancy continuum. Samples are colored based on if they are from different disease stage.HCC: Hepatocellular carcinoma
NAFLD: Non-alcoholic fatty liver disease
LungThe image shows the transcriptomic changes along malignancy continuum.log2FC in expression of this searched gene in stem-like cells from each diseased tissue sample relative to stem-like cells in normal samples in each tissue plotted against the malignancy continuum. Samples are colored based on if they are from different disease stage.
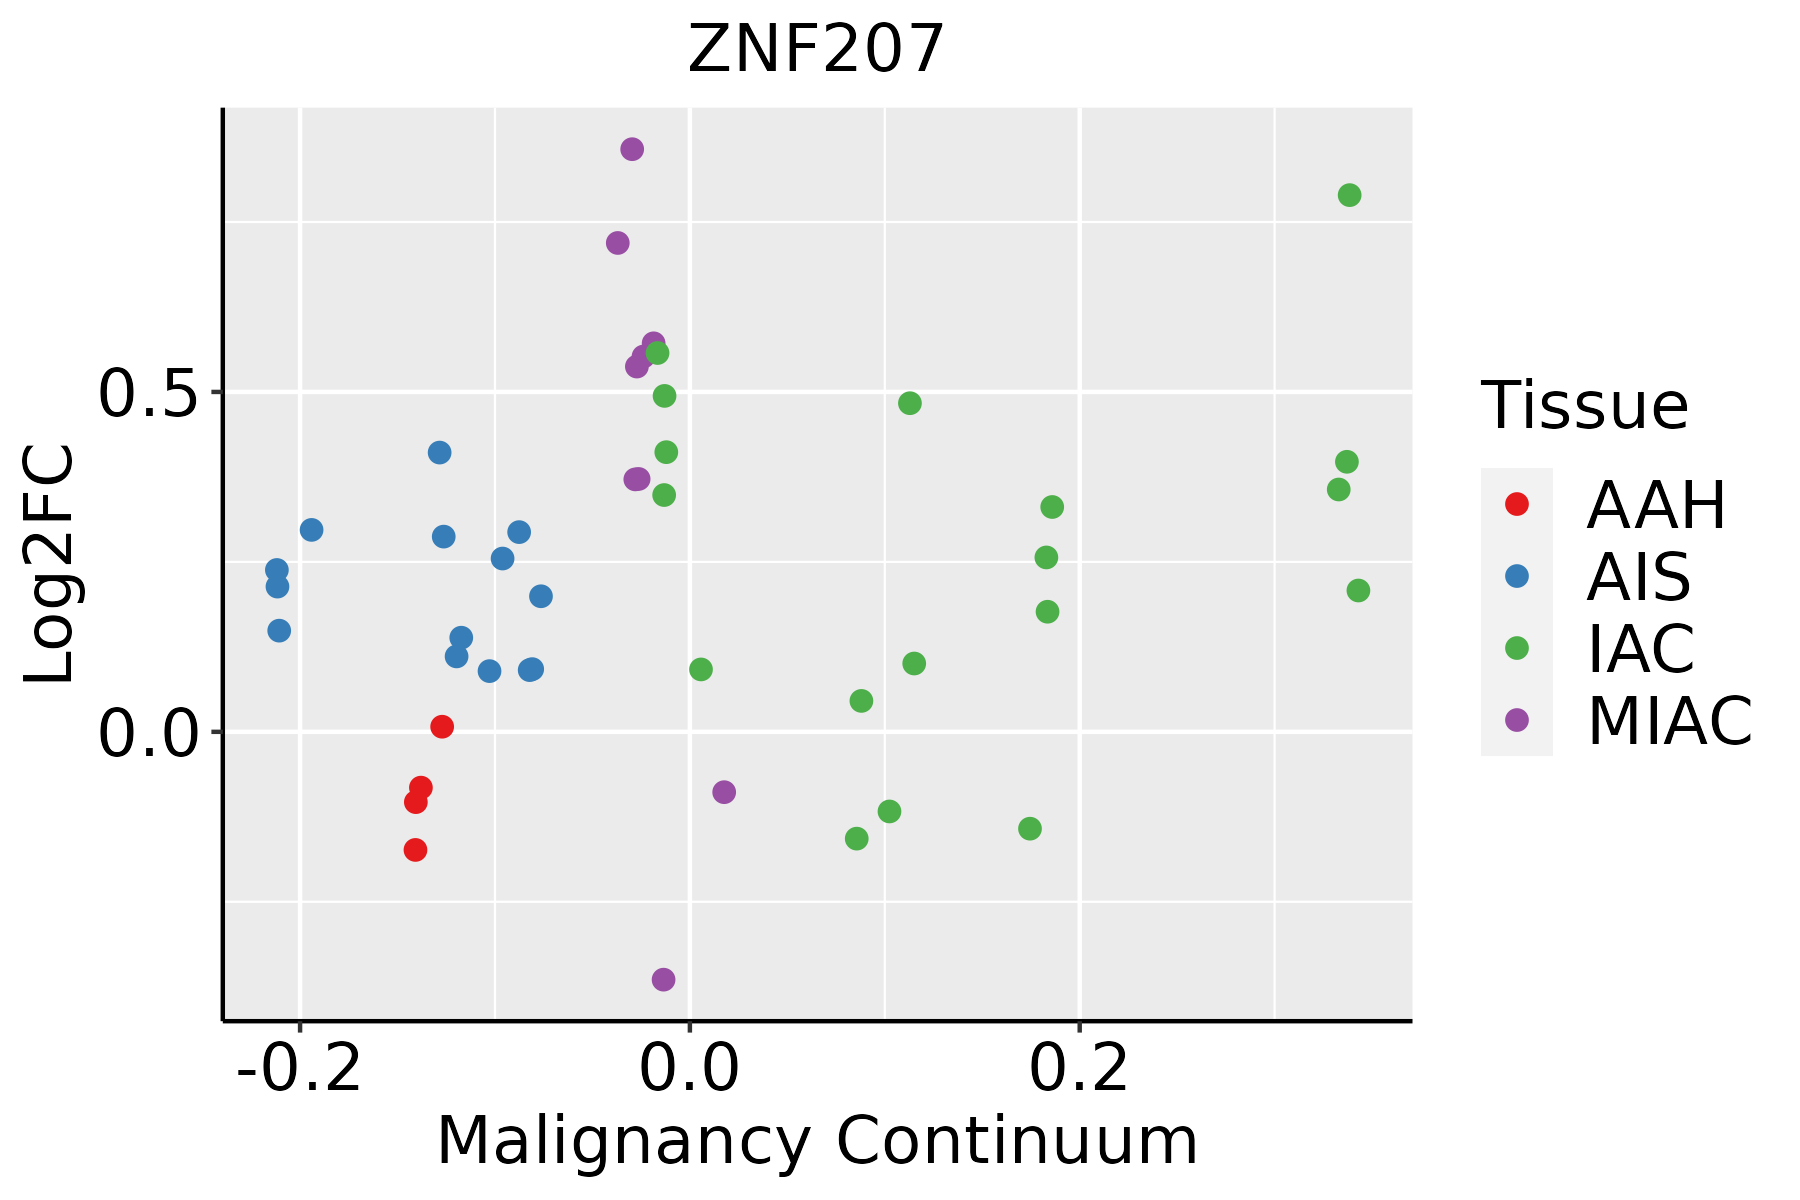
AAH: Atypical adenomatous hyperplasia
AIS: Adenocarcinoma in situ
IAC: Invasive lung adenocarcinoma
MIA: Minimally invasive adenocarcinoma
Oral CavityThe image shows the transcriptomic changes along malignancy continuum.log2FC in expression of this searched gene in stem-like cells from each diseased tissue sample relative to stem-like cells in normal samples in each tissue plotted against the malignancy continuum. Samples are colored based on if they are from different disease stage.EOLP: Erosive Oral lichen planus
LP: leukoplakia
NEOLP: Non-erosive oral lichen planus
OSCC: Oral squamous cell carcinoma
ProstateThe image shows the transcriptomic changes along malignancy continuum.log2FC in expression of this searched gene in stem-like cells from each diseased tissue sample relative to stem-like cells in normal samples in each tissue plotted against the malignancy continuum. Samples are colored based on if they are from different disease stage.
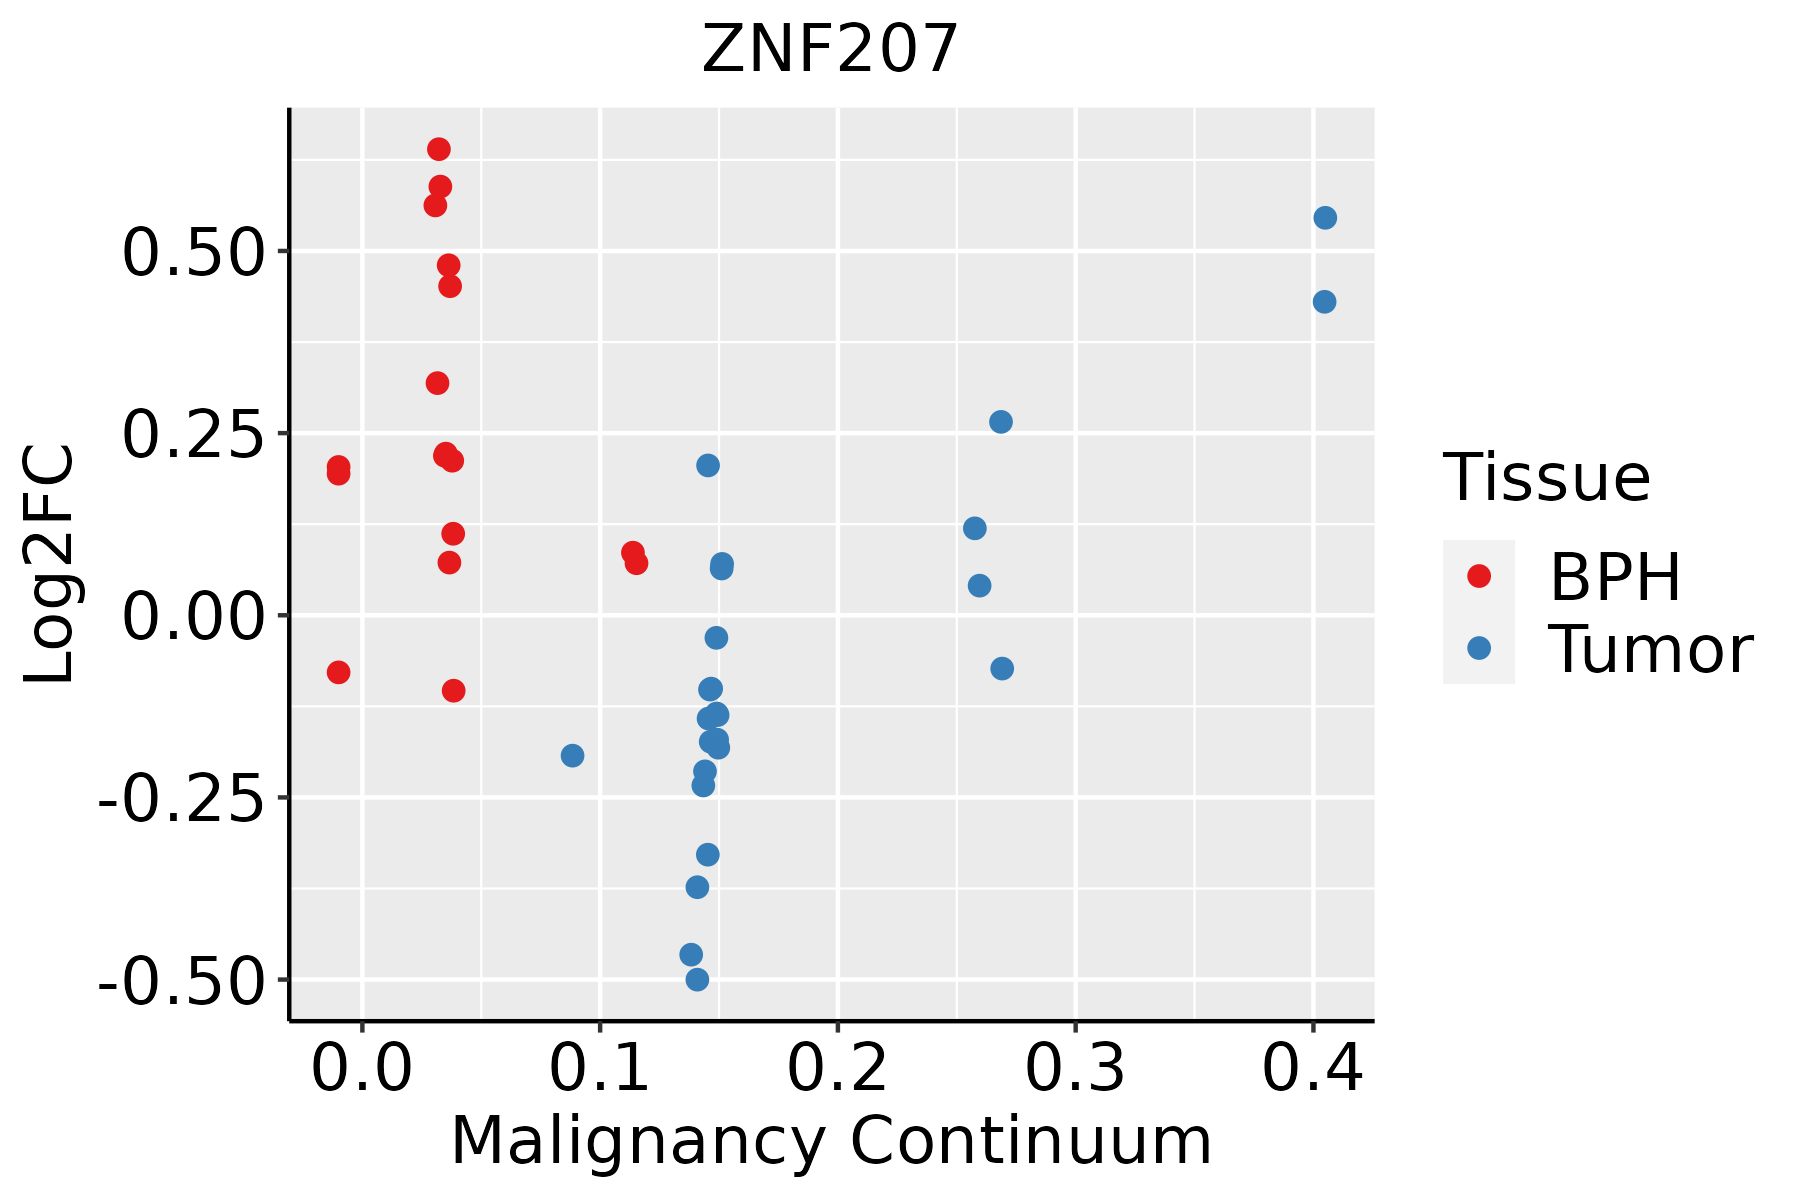
BPH: Benign Prostatic Hyperplasia
SkinThe image shows the transcriptomic changes along malignancy continuum.log2FC in expression of this searched gene in stem-like cells from each diseased tissue sample relative to stem-like cells in normal samples in each tissue plotted against the malignancy continuum. Samples are colored based on if they are from different disease stage.
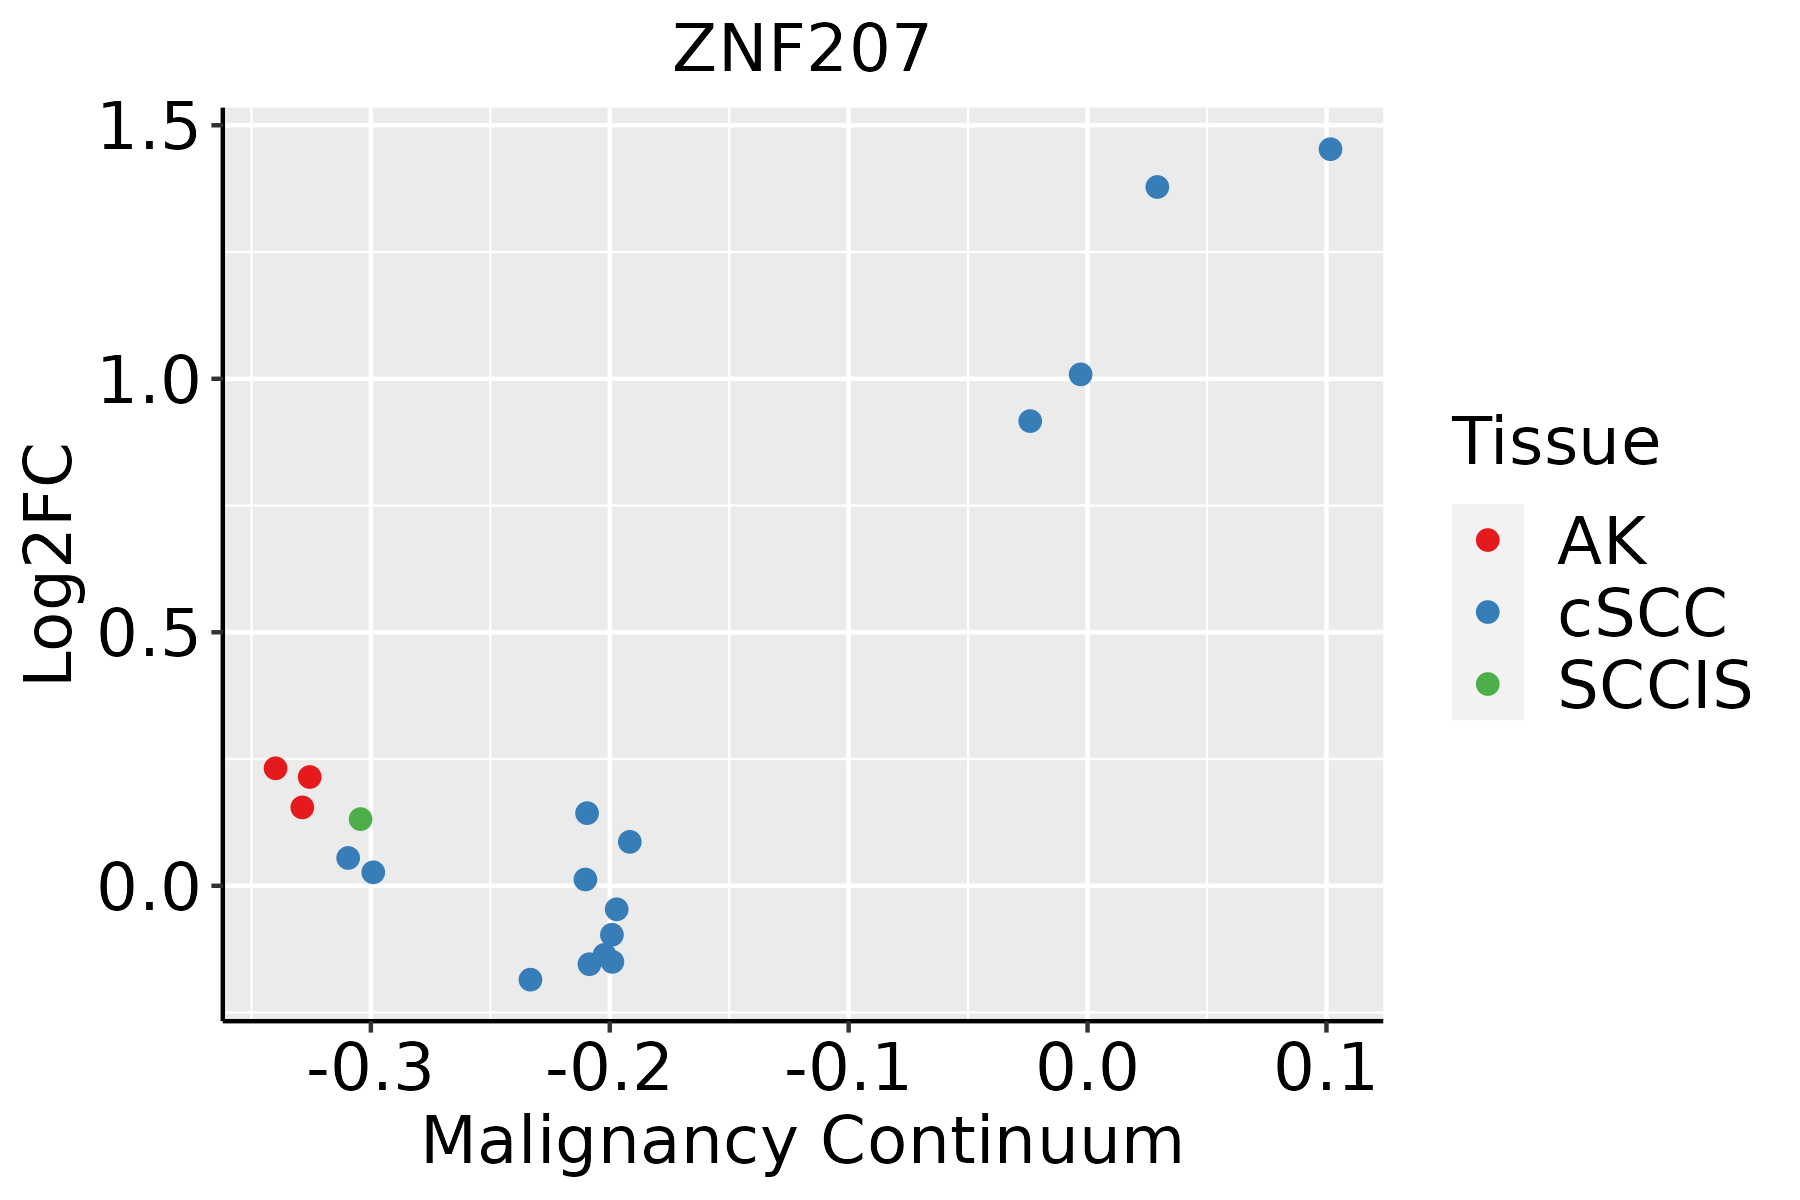
AK: Actinic keratosis
cSCC: Cutaneous squamous cell carcinoma
SCCIS:squamous cell carcinoma in situ
ThyroidThe image shows the transcriptomic changes along malignancy continuum.log2FC in expression of this searched gene in stem-like cells from each diseased tissue sample relative to stem-like cells in normal samples in each tissue plotted against the malignancy continuum. Samples are colored based on if they are from different disease stage.
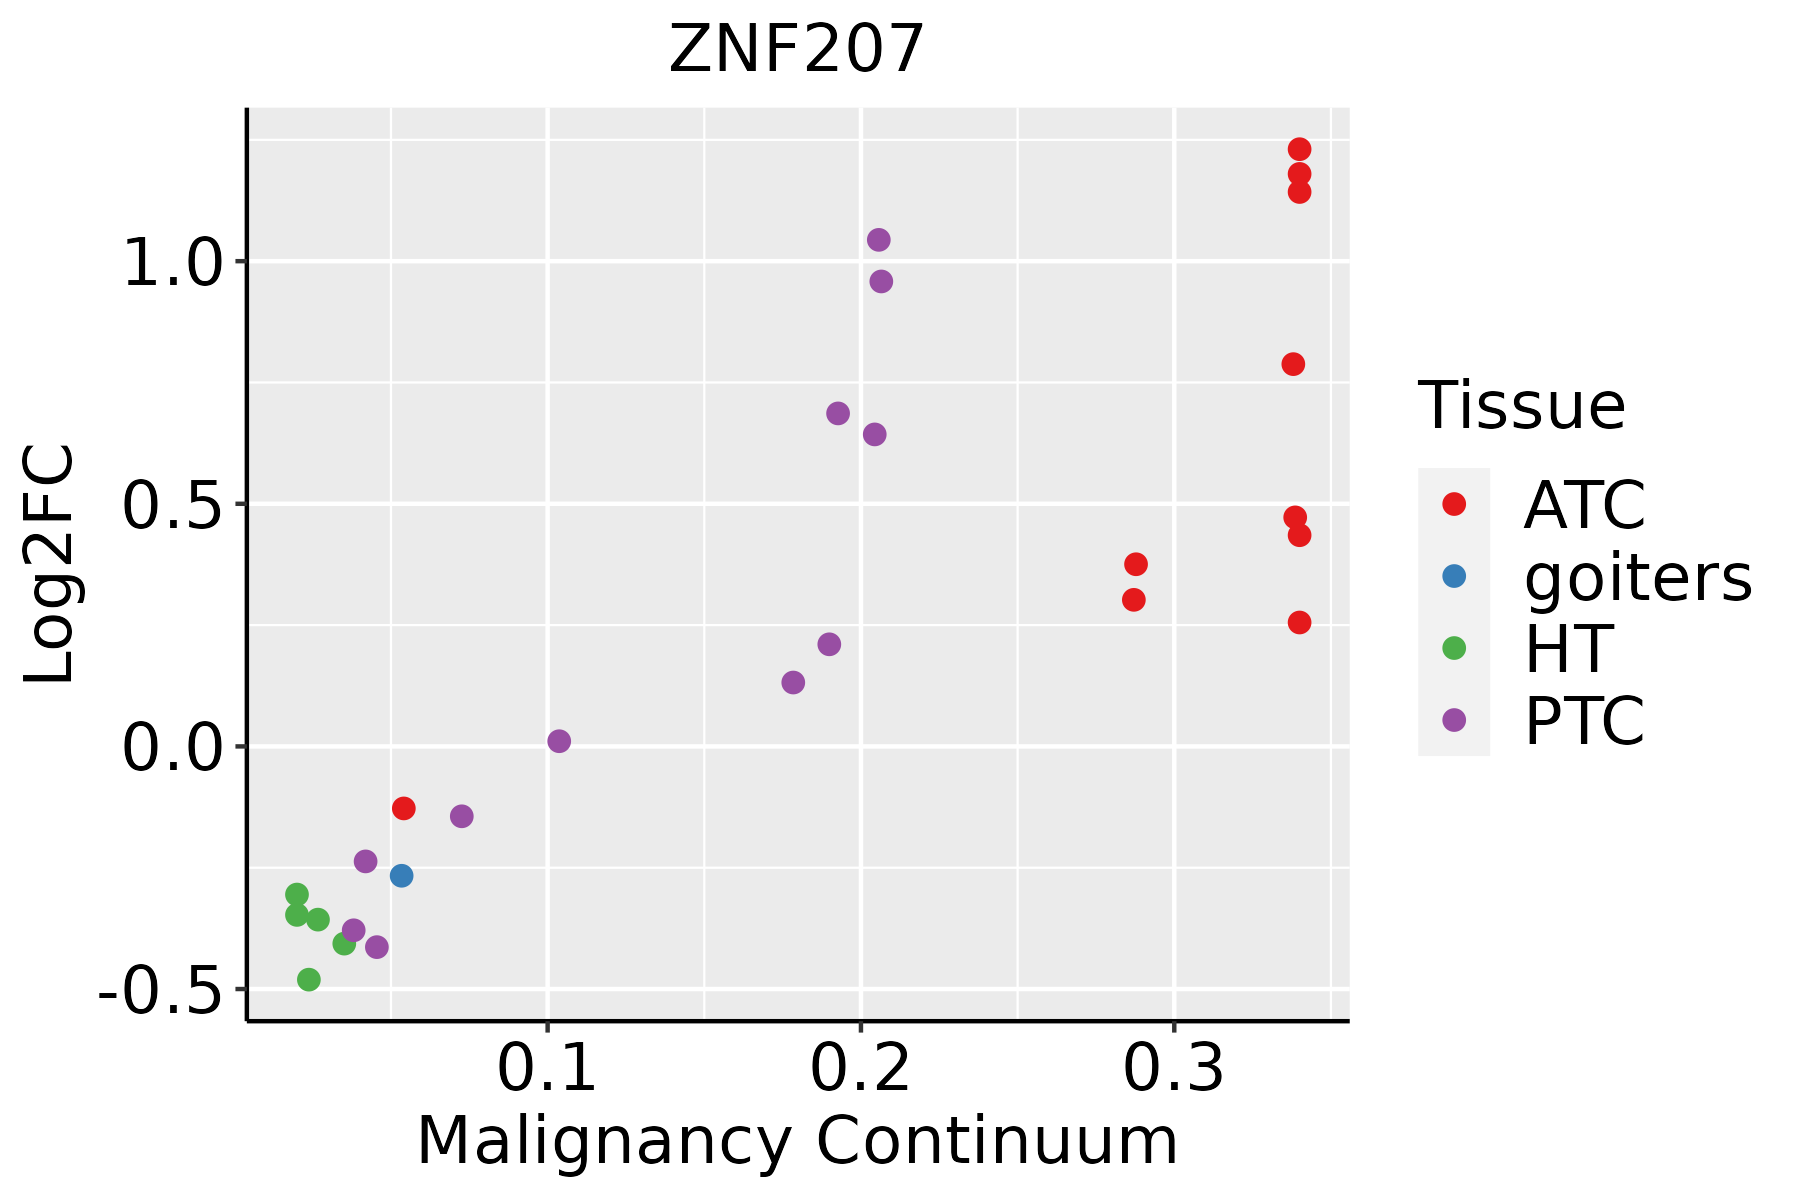
ATC: Anaplastic thyroid cancer
HT: Hashimoto's thyroiditis
PTC: Papillary thyroid cancer
∗log2FC in expression of this searched gene in stem-like cells from each diseased tissue sample relative to stem-like cells in normal samples in each tissue plotted against the malignancy continuum. Samples are colored based on if they are from different disease stage.

Top

Malignant transformation related pathway analysis

check buttonFind out the enriched GO biological processes and KEGG pathways involved in transition from healthy to precancer to cancer
check button Figure of enriched GO biological processes.
TissueDisease StageEnriched GO biological Processes
ColorectumADGO analysis - Figure of enriched GO biological processes: Top 15 enriched GO BP terms are showed in the bar plot of each disease state in each tissue. Each row represents a significant GO biological process which is colored according to the -log10(p.adjust).
ColorectumSERGO analysis - Figure of enriched GO biological processes: Top 15 enriched GO BP terms are showed in the bar plot of each disease state in each tissue. Each row represents a significant GO biological process which is colored according to the -log10(p.adjust).
ColorectumMSSGO analysis - Figure of enriched GO biological processes: Top 15 enriched GO BP terms are showed in the bar plot of each disease state in each tissue. Each row represents a significant GO biological process which is colored according to the -log10(p.adjust).
ColorectumMSI-HGO analysis - Figure of enriched GO biological processes: Top 15 enriched GO BP terms are showed in the bar plot of each disease state in each tissue. Each row represents a significant GO biological process which is colored according to the -log10(p.adjust).
ColorectumFAPGO analysis - Figure of enriched GO biological processes: Top 15 enriched GO BP terms are showed in the bar plot of each disease state in each tissue. Each row represents a significant GO biological process which is colored according to the -log10(p.adjust).
∗Top 15 enriched GO BP terms are showed in the bar plot of each disease state in each tissue. Each row represents a significant GO biological process which is colored according to the -log10(p.adjust).
Page: 1 2 3 4 5 6 7 8 9 

check button Enriched GO biological processes.
GO IDTissueDisease StageDescriptionGene RatioBg Ratiopvaluep.adjustCount
GO:00508219BreastPrecancerprotein stabilization29/1080191/187231.67e-066.08e-0529
GO:00316479BreastPrecancerregulation of protein stability38/1080298/187233.73e-061.19e-0438
GO:003164714BreastIDCregulation of protein stability50/1434298/187231.14e-076.57e-0650
GO:005082114BreastIDCprotein stabilization35/1434191/187231.12e-065.04e-0535
GO:00512589BreastIDCprotein polymerization38/1434297/187231.26e-031.34e-0238
GO:00330445BreastIDCregulation of chromosome organization26/1434187/187232.22e-032.06e-0226
GO:00073465BreastIDCregulation of mitotic cell cycle51/1434457/187234.30e-033.35e-0251
GO:003164724BreastDCISregulation of protein stability51/1390298/187231.63e-081.15e-0651
GO:005082124BreastDCISprotein stabilization36/1390191/187231.82e-079.14e-0636
GO:005125814BreastDCISprotein polymerization39/1390297/187233.64e-045.15e-0339
GO:000734612BreastDCISregulation of mitotic cell cycle52/1390457/187231.38e-031.43e-0252
GO:003304412BreastDCISregulation of chromosome organization26/1390187/187231.44e-031.47e-0226
GO:00447724BreastDCISmitotic cell cycle phase transition46/1390424/187236.16e-034.39e-0246
GO:0051258ColorectumADprotein polymerization112/3918297/187231.85e-112.27e-09112
GO:0031647ColorectumADregulation of protein stability108/3918298/187236.33e-105.08e-08108
GO:0050821ColorectumADprotein stabilization73/3918191/187233.02e-081.64e-0673
GO:0010639ColorectumADnegative regulation of organelle organization114/3918348/187231.41e-076.49e-06114
GO:0033044ColorectumADregulation of chromosome organization60/3918187/187232.25e-042.94e-0360
GO:0007051ColorectumADspindle organization58/3918184/187234.71e-045.20e-0358
GO:1902850ColorectumADmicrotubule cytoskeleton organization involved in mitosis48/3918147/187235.87e-046.21e-0348
Page: 1 2 3 4 5 6 7 8 9 10 11 12 13 14 15 16 17 18 19 20 21 22 23 24 25 26 27 28 29 

check button Enriched KEGG pathways.
Pathway IDTissueDisease StageDescriptionGene RatioBg Ratiopvaluep.adjustqvalueCount
Page: 1 

Top

Cell-cell communication analysis

check buttonIdentification of potential cell-cell interactions between two cell types and their ligand-receptor pairs for different disease states
LigandReceptorLRpairPathwayTissueDisease Stage
Page: 1 

Top

Single-cell gene regulatory network inference analysis

check buttonFind out the significant the regulons (TFs) and the target genes of each regulon across cell types for different disease states
TFCell TypeTissueDisease StageTarget GeneRSSRegulon Activity
∗The dot plots of a searched regulon are shown for all cell subpopulations in each disease state of each tissue based on the regulon specific score inferred using pySCENIC and by calculating the average expression.
Page: 1 

Top

Somatic mutation of malignant transformation related genes

check buttonAnnotation of somatic variants for genes involved in malignant transformation
Hugo SymbolVariant ClassVariant ClassificationdbSNP RSHGVScHGVSpHGVSp ShortSWISSPROTBIOTYPESIFTPolyPhenTumor Sample BarcodeTissueHistologySexAgeStageTherapy TypesDrugsOutcome
ZNF207SNVMissense_Mutationc.157N>Tp.His53Tyrp.H53YO43670protein_codingdeleterious(0)probably_damaging(0.969)TCGA-A8-A094-01Breastbreast invasive carcinomaFemale>=65I/IIUnknownUnknownSD
ZNF207SNVMissense_Mutationnovelc.841N>Ap.Val281Ilep.V281IO43670protein_codingtolerated(0.31)probably_damaging(0.971)TCGA-EW-A6SD-01Breastbreast invasive carcinomaFemale<65I/IIChemotherapytchSD
ZNF207insertionNonsense_Mutationnovelc.1472_1473insCTAAATACTCGAAp.Gly492Terp.G492*O43670protein_codingTCGA-B6-A0IA-01Breastbreast invasive carcinomaFemale<65I/IIUnknownUnknownSD
ZNF207SNVMissense_Mutationc.715N>Gp.Gln239Glup.Q239EO43670protein_codingtolerated(0.23)benign(0.078)TCGA-C5-A3HE-01Cervixcervical & endocervical cancerFemale<65I/IIUnknownUnknownPD
ZNF207SNVMissense_Mutationc.1300N>Tp.Met434Leup.M434LO43670protein_codingdeleterious_low_confidence(0.04)benign(0.138)TCGA-C5-A7CL-01Cervixcervical & endocervical cancerFemale<65III/IVChemotherapycisplatinPD
ZNF207SNVMissense_Mutationnovelc.679C>Tp.Pro227Serp.P227SO43670protein_codingtolerated(0.05)possibly_damaging(0.457)TCGA-VS-A8EK-01Cervixcervical & endocervical cancerFemale>=65I/IIChemotherapycisplatinPD
ZNF207SNVMissense_Mutationc.849N>Gp.Ser283Argp.S283RO43670protein_codingdeleterious(0.01)benign(0.221)TCGA-A6-2680-01Colorectumcolon adenocarcinomaFemale>=65I/IIUnknownUnknownSD
ZNF207SNVMissense_Mutationnovelc.265N>Tp.Asp89Tyrp.D89YO43670protein_codingdeleterious(0)probably_damaging(0.997)TCGA-AA-3984-01Colorectumcolon adenocarcinomaFemale<65I/IIUnknownUnknownSD
ZNF207SNVMissense_Mutationc.1433G>Ap.Arg478Glnp.R478QO43670protein_codingdeleterious_low_confidence(0.03)probably_damaging(0.947)TCGA-CK-5916-01Colorectumcolon adenocarcinomaFemale>=65I/IIUnknownUnknownPD
ZNF207SNVMissense_Mutationc.974N>Ap.Ser325Asnp.S325NO43670protein_codingtolerated(0.37)benign(0)TCGA-AP-A059-01Endometriumuterine corpus endometrioid carcinomaFemale>=65I/IIUnknownUnknownSD
Page: 1 2 3 4 5 

Top

Related drugs of malignant transformation related genes

check buttonIdentification of chemicals and drugs interact with genes involved in malignant transfromation
(DGIdb 4.0)
Entrez IDSymbolCategoryInteraction TypesDrug Claim NameDrug NamePMIDs
Page: 1