
|
|||||
|
 | |
| |
| |
| |
| |
| |
|
Gene: ZNF205 |
Gene summary for ZNF205 |
| Gene information | Species | Human | Gene symbol | ZNF205 | Gene ID | 7755 |
| Gene name | zinc finger protein 205 | |
| Gene Alias | RhitH | |
| Cytomap | 16p13.3 | |
| Gene Type | protein-coding | GO ID | GO:0000122 | UniProtAcc | O95201 |
Top |
Malignant transformation analysis |
| Identification of the aberrant gene expression in precancerous and cancerous lesions by comparing the gene expression of stem-like cells in diseased tissues with normal stem cells |
| Entrez ID | Symbol | Replicates | Species | Organ | Tissue | Adj P-value | Log2FC | Malignancy |
| 7755 | ZNF205 | LZE22T | Human | Esophagus | ESCC | 9.85e-04 | 3.58e-01 | 0.068 |
| 7755 | ZNF205 | LZE24T | Human | Esophagus | ESCC | 8.13e-13 | 3.56e-01 | 0.0596 |
| 7755 | ZNF205 | LZE21T | Human | Esophagus | ESCC | 3.76e-02 | 2.49e-01 | 0.0655 |
| 7755 | ZNF205 | P1T-E | Human | Esophagus | ESCC | 1.18e-04 | 2.73e-01 | 0.0875 |
| 7755 | ZNF205 | P2T-E | Human | Esophagus | ESCC | 4.90e-35 | 4.85e-01 | 0.1177 |
| 7755 | ZNF205 | P4T-E | Human | Esophagus | ESCC | 3.14e-08 | 1.59e-01 | 0.1323 |
| 7755 | ZNF205 | P5T-E | Human | Esophagus | ESCC | 8.57e-10 | 1.86e-01 | 0.1327 |
| 7755 | ZNF205 | P8T-E | Human | Esophagus | ESCC | 3.27e-18 | 2.48e-01 | 0.0889 |
| 7755 | ZNF205 | P9T-E | Human | Esophagus | ESCC | 2.21e-03 | 1.03e-01 | 0.1131 |
| 7755 | ZNF205 | P10T-E | Human | Esophagus | ESCC | 2.33e-11 | 1.47e-01 | 0.116 |
| 7755 | ZNF205 | P11T-E | Human | Esophagus | ESCC | 1.50e-17 | 5.10e-01 | 0.1426 |
| 7755 | ZNF205 | P12T-E | Human | Esophagus | ESCC | 6.02e-28 | 4.87e-01 | 0.1122 |
| 7755 | ZNF205 | P15T-E | Human | Esophagus | ESCC | 2.34e-19 | 3.66e-01 | 0.1149 |
| 7755 | ZNF205 | P16T-E | Human | Esophagus | ESCC | 2.80e-16 | 1.90e-01 | 0.1153 |
| 7755 | ZNF205 | P17T-E | Human | Esophagus | ESCC | 1.75e-09 | 4.10e-01 | 0.1278 |
| 7755 | ZNF205 | P19T-E | Human | Esophagus | ESCC | 3.51e-02 | 3.09e-01 | 0.1662 |
| 7755 | ZNF205 | P20T-E | Human | Esophagus | ESCC | 1.27e-08 | 2.51e-01 | 0.1124 |
| 7755 | ZNF205 | P21T-E | Human | Esophagus | ESCC | 7.47e-19 | 3.54e-01 | 0.1617 |
| 7755 | ZNF205 | P22T-E | Human | Esophagus | ESCC | 1.68e-12 | 2.52e-01 | 0.1236 |
| 7755 | ZNF205 | P23T-E | Human | Esophagus | ESCC | 3.39e-15 | 3.58e-01 | 0.108 |
| Page: 1 2 3 |
| Tissue | Expression Dynamics | Abbreviation |
| Esophagus | 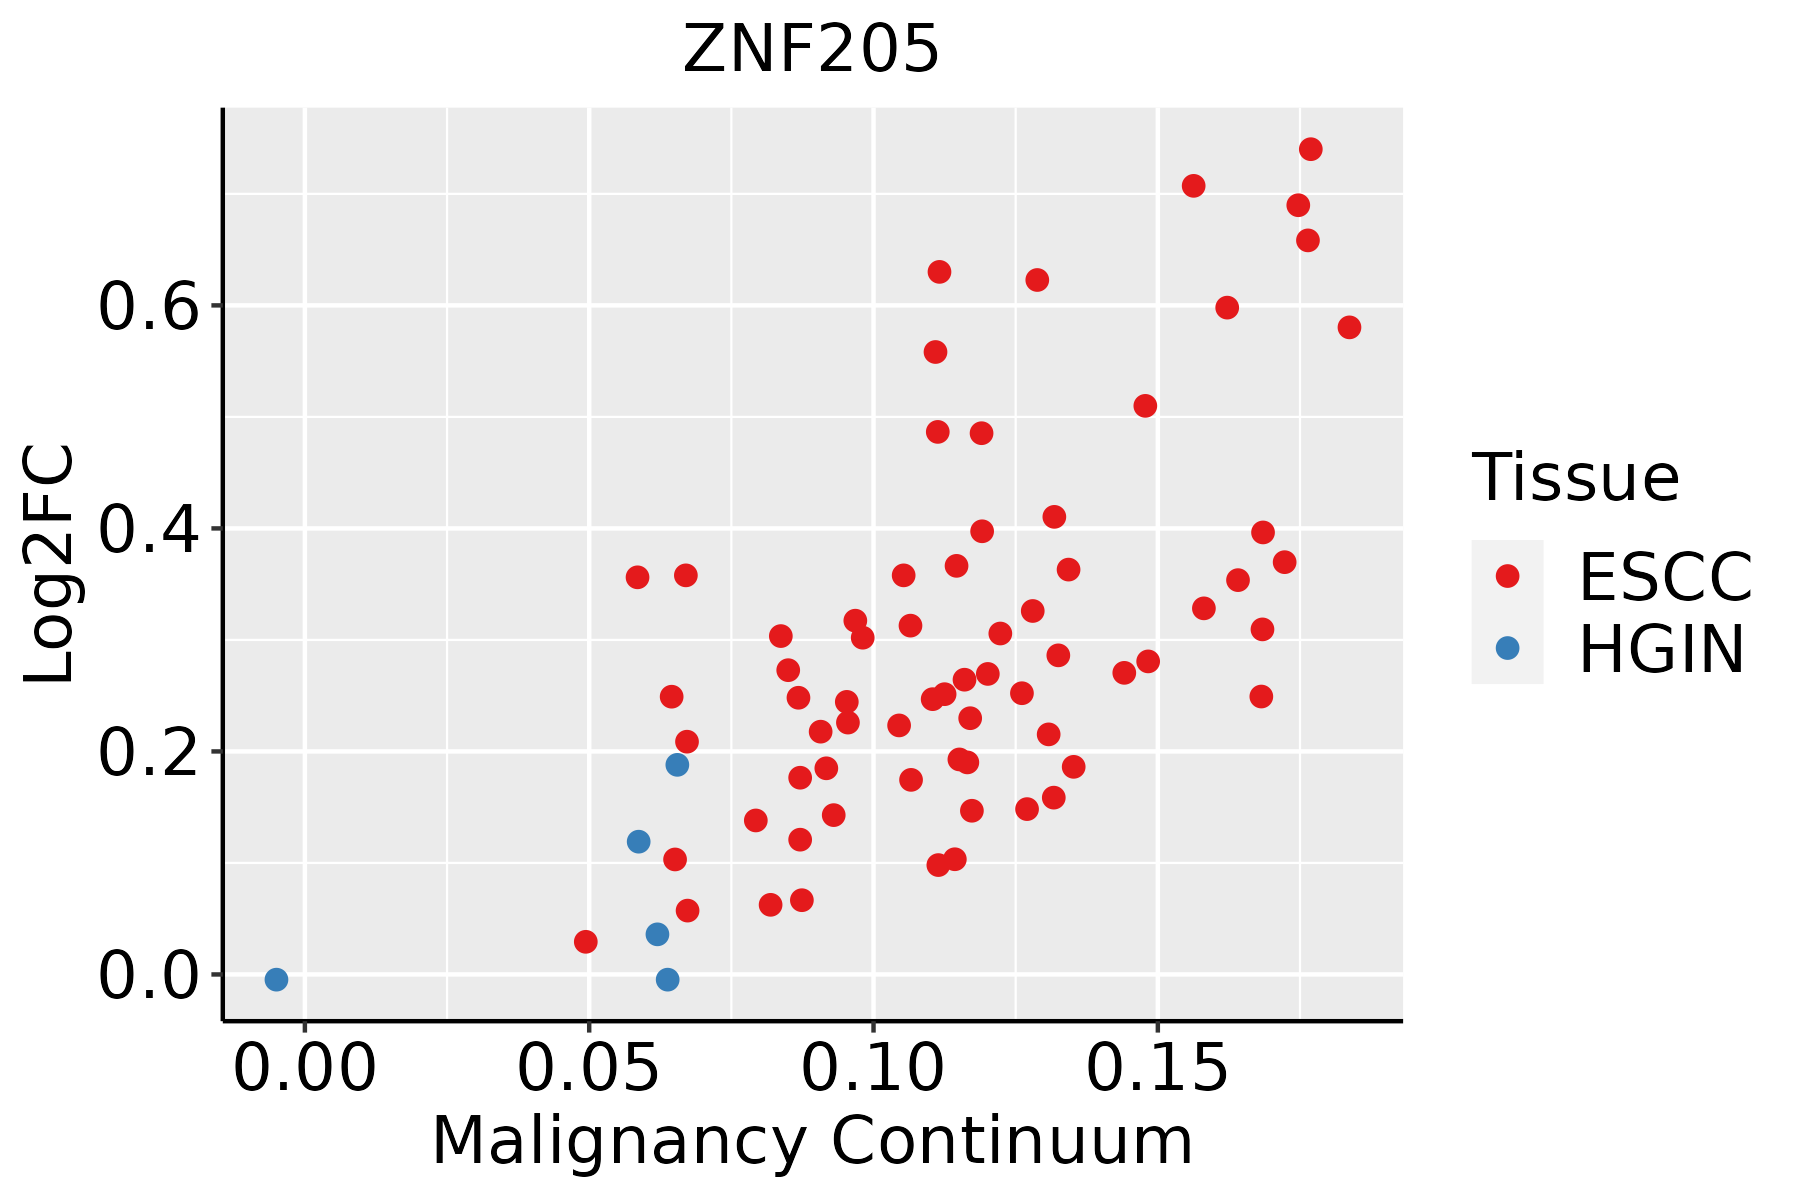 | ESCC: Esophageal squamous cell carcinoma |
| HGIN: High-grade intraepithelial neoplasias | ||
| LGIN: Low-grade intraepithelial neoplasias |
| ∗log2FC in expression of this searched gene in stem-like cells from each diseased tissue sample relative to stem-like cells in normal samples in each tissue plotted against the malignancy continuum. Samples are colored based on if they are from different disease stage. |
Top |
Malignant transformation related pathway analysis |
| Find out the enriched GO biological processes and KEGG pathways involved in transition from healthy to precancer to cancer |
| Tissue | Disease Stage | Enriched GO biological Processes |
| Colorectum | AD |  |
| Colorectum | SER |  |
| Colorectum | MSS |  |
| Colorectum | MSI-H |  |
| Colorectum | FAP |  |
| ∗Top 15 enriched GO BP terms are showed in the bar plot of each disease state in each tissue. Each row represents a significant GO biological process which is colored according to the -log10(p.adjust). |
| Page: 1 2 3 4 5 6 7 8 9 |
| GO ID | Tissue | Disease Stage | Description | Gene Ratio | Bg Ratio | pvalue | p.adjust | Count |
| GO:0006839110 | Esophagus | ESCC | mitochondrial transport | 187/8552 | 254/18723 | 8.35e-20 | 9.81e-18 | 187 |
| GO:000700619 | Esophagus | ESCC | mitochondrial membrane organization | 93/8552 | 116/18723 | 2.16e-14 | 1.11e-12 | 93 |
| GO:0010821110 | Esophagus | ESCC | regulation of mitochondrion organization | 107/8552 | 144/18723 | 2.31e-12 | 9.41e-11 | 107 |
| GO:0008637110 | Esophagus | ESCC | apoptotic mitochondrial changes | 83/8552 | 107/18723 | 1.43e-11 | 5.08e-10 | 83 |
| GO:001082215 | Esophagus | ESCC | positive regulation of mitochondrion organization | 58/8552 | 74/18723 | 8.55e-09 | 1.73e-07 | 58 |
| GO:004690217 | Esophagus | ESCC | regulation of mitochondrial membrane permeability | 49/8552 | 63/18723 | 1.91e-07 | 2.97e-06 | 49 |
| GO:00905599 | Esophagus | ESCC | regulation of membrane permeability | 58/8552 | 78/18723 | 2.38e-07 | 3.61e-06 | 58 |
| GO:00357948 | Esophagus | ESCC | positive regulation of mitochondrial membrane permeability | 36/8552 | 43/18723 | 2.90e-07 | 4.20e-06 | 36 |
| GO:009734510 | Esophagus | ESCC | mitochondrial outer membrane permeabilization | 28/8552 | 32/18723 | 1.02e-06 | 1.29e-05 | 28 |
| GO:190268614 | Esophagus | ESCC | mitochondrial outer membrane permeabilization involved in programmed cell death | 33/8552 | 40/18723 | 1.80e-06 | 2.11e-05 | 33 |
| GO:200037718 | Esophagus | ESCC | regulation of reactive oxygen species metabolic process | 100/8552 | 157/18723 | 3.87e-06 | 4.17e-05 | 100 |
| GO:19021108 | Esophagus | ESCC | positive regulation of mitochondrial membrane permeability involved in apoptotic process | 31/8552 | 38/18723 | 5.93e-06 | 6.10e-05 | 31 |
| GO:19057108 | Esophagus | ESCC | positive regulation of membrane permeability | 37/8552 | 48/18723 | 8.99e-06 | 8.65e-05 | 37 |
| GO:19010289 | Esophagus | ESCC | regulation of mitochondrial outer membrane permeabilization involved in apoptotic signaling pathway | 19/8552 | 21/18723 | 2.28e-05 | 1.96e-04 | 19 |
| GO:19021086 | Esophagus | ESCC | regulation of mitochondrial membrane permeability involved in apoptotic process | 34/8552 | 45/18723 | 4.37e-05 | 3.49e-04 | 34 |
| GO:19010304 | Esophagus | ESCC | positive regulation of mitochondrial outer membrane permeabilization involved in apoptotic signaling pathway | 11/8552 | 11/18723 | 1.80e-04 | 1.16e-03 | 11 |
| GO:007259318 | Esophagus | ESCC | reactive oxygen species metabolic process | 137/8552 | 239/18723 | 1.82e-04 | 1.16e-03 | 137 |
| GO:00103101 | Esophagus | ESCC | regulation of hydrogen peroxide metabolic process | 16/8552 | 22/18723 | 9.46e-03 | 3.28e-02 | 16 |
| GO:200037918 | Esophagus | ESCC | positive regulation of reactive oxygen species metabolic process | 45/8552 | 76/18723 | 1.21e-02 | 4.04e-02 | 45 |
| Page: 1 |
| Pathway ID | Tissue | Disease Stage | Description | Gene Ratio | Bg Ratio | pvalue | p.adjust | qvalue | Count |
| Page: 1 |
Top |
Cell-cell communication analysis |
| Identification of potential cell-cell interactions between two cell types and their ligand-receptor pairs for different disease states |
| Ligand | Receptor | LRpair | Pathway | Tissue | Disease Stage |
| Page: 1 |
Top |
Single-cell gene regulatory network inference analysis |
| Find out the significant the regulons (TFs) and the target genes of each regulon across cell types for different disease states |
| TF | Cell Type | Tissue | Disease Stage | Target Gene | RSS | Regulon Activity |
| ZNF205 | GC | Esophagus | ESCC | ATXN2L,KIAA0391,BCAP31, etc. | 2.95e-01 |  |
| ZNF205 | CD8TEXINT | Skin | AK | CCL13,LRG1,HS3ST1, etc. | 1.23e-03 |  |
| ZNF205 | CD8TCM | Skin | AK | CCL13,LRG1,HS3ST1, etc. | 0.00e+00 | |
| ∗The dot plots of a searched regulon are shown for all cell subpopulations in each disease state of each tissue based on the regulon specific score inferred using pySCENIC and by calculating the average expression. |
| Page: 1 |
Top |
Somatic mutation of malignant transformation related genes |
| Annotation of somatic variants for genes involved in malignant transformation |
| Hugo Symbol | Variant Class | Variant Classification | dbSNP RS | HGVSc | HGVSp | HGVSp Short | SWISSPROT | BIOTYPE | SIFT | PolyPhen | Tumor Sample Barcode | Tissue | Histology | Sex | Age | Stage | Therapy Types | Drugs | Outcome |
| ZNF205 | SNV | Missense_Mutation | c.1402N>T | p.Arg468Cys | p.R468C | O95201 | protein_coding | deleterious(0.03) | probably_damaging(0.998) | TCGA-A8-A07W-01 | Breast | breast invasive carcinoma | Female | >=65 | III/IV | Hormone Therapy | exemestane | SD | |
| ZNF205 | SNV | Missense_Mutation | novel | c.1256N>A | p.Pro419Gln | p.P419Q | O95201 | protein_coding | deleterious(0) | probably_damaging(1) | TCGA-AN-A0AK-01 | Breast | breast invasive carcinoma | Female | >=65 | I/II | Unknown | Unknown | SD |
| ZNF205 | SNV | Missense_Mutation | novel | c.698C>T | p.Pro233Leu | p.P233L | O95201 | protein_coding | tolerated(0.17) | benign(0) | TCGA-B6-A402-01 | Breast | breast invasive carcinoma | Female | <65 | I/II | Chemotherapy | cyclophosphamide | PD |
| ZNF205 | SNV | Missense_Mutation | novel | c.966N>G | p.His322Gln | p.H322Q | O95201 | protein_coding | tolerated(0.11) | possibly_damaging(0.489) | TCGA-EW-A3U0-01 | Breast | breast invasive carcinoma | Female | <65 | III/IV | Chemotherapy | cisplatin | CR |
| ZNF205 | insertion | Frame_Shift_Ins | novel | c.927_928insGAGAAAGCTCTCTTCC | p.Cys310GlufsTer36 | p.C310Efs*36 | O95201 | protein_coding | TCGA-AN-A04C-01 | Breast | breast invasive carcinoma | Female | <65 | I/II | Unknown | Unknown | SD | ||
| ZNF205 | SNV | Missense_Mutation | c.330G>C | p.Gln110His | p.Q110H | O95201 | protein_coding | tolerated(0.08) | possibly_damaging(0.459) | TCGA-EK-A3GK-01 | Cervix | cervical & endocervical cancer | Female | <65 | I/II | Unknown | Unknown | SD | |
| ZNF205 | SNV | Missense_Mutation | novel | c.1592A>G | p.Lys531Arg | p.K531R | O95201 | protein_coding | tolerated(0.08) | possibly_damaging(0.681) | TCGA-A6-6780-01 | Colorectum | colon adenocarcinoma | Male | >=65 | I/II | Unknown | Unknown | SD |
| ZNF205 | SNV | Missense_Mutation | rs770380526 | c.341C>T | p.Ala114Val | p.A114V | O95201 | protein_coding | deleterious(0) | probably_damaging(0.995) | TCGA-AA-3509-01 | Colorectum | colon adenocarcinoma | Female | <65 | I/II | Unknown | Unknown | SD |
| ZNF205 | SNV | Missense_Mutation | rs746491530 | c.1394N>T | p.Ala465Val | p.A465V | O95201 | protein_coding | deleterious(0.01) | possibly_damaging(0.518) | TCGA-AA-3519-01 | Colorectum | colon adenocarcinoma | Male | <65 | III/IV | Unknown | Unknown | SD |
| ZNF205 | SNV | Missense_Mutation | c.236N>A | p.Gly79Asp | p.G79D | O95201 | protein_coding | deleterious(0.04) | benign(0.36) | TCGA-AA-3672-01 | Colorectum | colon adenocarcinoma | Female | >=65 | III/IV | Unknown | Unknown | SD |
| Page: 1 2 3 4 5 6 |
Top |
Related drugs of malignant transformation related genes |
| Identification of chemicals and drugs interact with genes involved in malignant transfromation |
| (DGIdb 4.0) |
| Entrez ID | Symbol | Category | Interaction Types | Drug Claim Name | Drug Name | PMIDs |
| Page: 1 |

Copyright 2023-Present -The University of Texas Health Science Center at Houston |